HAL Id: halshs-00586795
https://halshs.archives-ouvertes.fr/halshs-00586795
Preprint submitted on 18 Apr 2011
HAL is a multi-disciplinary open access archive for the deposit and dissemination of sci-entific research documents, whether they are pub-lished or not. The documents may come from teaching and research institutions in France or abroad, or from public or private research centers.
L’archive ouverte pluridisciplinaire HAL, est destinée au dépôt et à la diffusion de documents scientifiques de niveau recherche, publiés ou non, émanant des établissements d’enseignement et de recherche français ou étrangers, des laboratoires publics ou privés.
To cite this version:
WORKING PAPER N° 2008 - 17
Top incomes and earnings in Portugal 1936-2004
Facundo Alvaredo
JEL Codes: D3, H2, N3, O1
Keywords: top incomes, top wages, concentration, Portugal
PARIS-JOURDAN SCIENCES ECONOMIQUES
LABORATOIRE D’ECONOMIE APPLIQUÉE - INRA
48,BD JOURDAN –E.N.S.–75014PARIS TÉL. :33(0)143136300 – FAX :33(0)143136310
www.pse.ens.fr
CENTRE NATIONAL DE LA RECHERCHE SCIENTIFIQUE –ÉCOLE DES HAUTES ÉTUDES EN SCIENCES SOCIALES ÉCOLE NATIONALE DES PONTS ET CHAUSSÉES –ÉCOLE NORMALE SUPÉRIEURE
Top Incomes and Earnings in Portugal 1936-2004
Facundo Alvaredo
Paris School of Economics and CREST alvaredo@pse.ens.fr
This version: March 2008
Abstract
This paper analyzes income and earnings concentration in Portugal from a long-run perspective using personal income and wage tax statistics. Our results suggest that income concentration was much higher during the 1930s and early 1940s than it is today. Top income shares estimated from reported incomes deteriorated during the Second World War, even if Portugal did not take active participation in the conflict. However, the magnitude of the drop was less important than in other European countries. The level of concentration between 1950 and 1970 remained relatively high compared to countries such as Spain, France, UK or the United States. The decrease in income concentration, started very moderately at the end of the 1960s and which accelerated after the revolution of 1974, began to be reversed during the first half of the 1980s. During the last fifteen years top income shares have increased steadily. The rise in wage concentration contributed to this process in a significant way. The evidence since 1989 suggests that the level of marginal tax rate at the top has not been the primary determinant of the level of top reported incomes. Marginal rates have stayed constant in a context of growing top shares.
JEL classification: D3, H2, N3, O1
I thank Jose Albuquerque, Tony Atkinson, Catia Batista, Santiago Budría, Ana Rute Cardoso, Manoel João, Pedro Lains, Alfredo Pereira, Thomas Piketty, Carlos Farinha Rodrigues and Emmanuel Saez. Special acknowledgments go to António Manuel Sá Santos and the staff of the Centro de Estudos Fiscais at the Direcçao-Geral dos Impostos and the Instituto Nacional de Estatística (Lisbon).
1. Introduction
This paper analyzes the evolution of income and wage concentration in Portugal between 1936 and 2004 using tax statistics and administrative records on individual earnings. This research is strictly linked to the studies recently gathered in Atkinson and Piketty, 2007, where series for shares of income accruing to upper income groups have been constructed for the United States, Ireland, the United Kingdom, Canada, New Zealand, Australia, Finland, France, Germany, the Netherlands, Sweden and Switzerland. Research has also been done on the experiences of Argentina, Spain, India, Japan, Sweden, Finland, Norway, China and Indonesia.1 The case of Portugal is interesting on several grounds.
First, Portugal has undergone important changes in the political arena since the beginning of the XXth century. After the decline and final collapse of the constitutional monarchy, the First Republic was established in 1910. The parliamentary regime was turbulent and unstable, with eight presidents, thirty-eight prime ministers and a brief monarchy restoration over a seventeen-year period.2 Participation in the First World War on the Entente side, large government deficits, rapid monetary expansion and high inflation dominated the scenario. The First Republic was ended in 1926 by a military coup, which installed an authoritarian republic followed by seven years of institutional change. There was no apocalyptic civil war as in Spain and the ultimate leader of the new regime was not a general, but a university professor, António Salazar. The Second Republic evolved to a right-wing dictatorship under the form of a single party
1 Aarberge and Atkinson, 2008, Atkinson, 2005, Atkinson and Leigh, 2007a,b, Banerjee and
Piketty, 2005, Dell, 2007, Dell et al., 2007, Kopczuk and Saez, 2004, Leigh and van der Eng, 2007, Moriguchi and Saez, 2007, Nolan, 2007, Piketty, 2001, 2003, Piketty and Qian, 2006, Piketty and Saez, 2003, Piketty et al, 2006, Saez and Veall, 2005, Salverda and Atkinson, 2007,
Riihelä et al, 2005, Roine and Waldenström, 2006.
2
For an account of the history of Portugal until the late 1960s, see Payne, 1972. See also Robinson, 1979 and Gallaher, 1983.
corporative regime.3 Due to the absence of the clear polarization of the Spanish society, the authoritarian system developed in a framework of institutional continuity. In 1928 Salazar was appointed ministry of finance, and in 1933 he became prime minister, remaining in power until 1968. From the early 1930s to the end of the 1950s, Portugal followed a policy of relative isolationism under a corporatist socio-economic system (extensive state regulation and private ownership of means of production). In the late 1950s, the regime shifted towards a moderately outward looking policy, which inaugurated a period of rapid growth until the beginning of the 1970s. Unlike Spain, Portugal was accepted into the Marshall plan in 1947 and the NATO in 1949. In 1974 a left-wing military coup put an end to the dictatorship. The revolutionary government granted independence to the Portuguese colonies in Africa and Asia, set out on a course of land expropriation and sweeping nationalization (banks, basic industries, utilities, insurance companies, newspapers) and followed a policy of freezing prices and rising wages.4 The process has been described as a successful challenge to capitalist property.5 In 1975 the country held its first free multi-party elections since 1926. By the beginning of the 1980s most of the reforms of the revolutionary period started to be reversed, one of the motivating factors being Portugal joining the European Communities, which happened in 1986. The country adopted the Euro in 2002. The study of top incomes in Portugal provides
3
“[…] one of the greatest fallacies of the nineteenth century was that the English parliamentarism and English democracy were adaptable to every European country […]”, Salazar, 1939.
4
Between 1974 and 1975 more than 1,300 industrial companies were nationalized; for a detailed account of nationalizations in the industrial sector see Martins and Chaves Rosa, 1979. In less than six months 1.2 million hectares were expropriated in the southern and central provinces south of the Tagus river, that is, 13% of the country’s surface and 25% of total farm land. The occupation of large estates had begun even before a governmental decision gave it legal status through Decree-Law 203C/1975 and Decree-Law 207/1975 (see Barreto, 1983, 1987 and 1988). Two thousand houses were seized in the two weeks following the fall of the dictatorship, and only in February 1975 2,500 apartments were occupied in Lisbon alone (see Downs, 1983). A decollectivization process started modestly by the end of the 1970s and culminated with the reformed agrarian law enacted in 1988 (Law 109/1988 of 9/26/1988) and with the final setting of monetary compensations for original proprietors (Law 199/1988 of 5/31/1988). By the mid 1990s only one tenth of the expropriated estates was still in possession of collective farms.
5
new insights on the relationships between the political regimes and the evolution of income concentration.
Second, from the economic point of view, Portugal underwent dramatic changes over the last hundred years. During the first half of the XXth. century, the country was an agricultural-based economy in which wine accounted for one third of total agrarian output.6 In 1950s, GDP per capita was 15% lower than that of Spain, 60% lower than that of France and 70% lower than in the United Kingdom.7 Between the 1950s and the beginning of the 1970s the government shifted towards mild liberalization policies and imposed a strategy aimed at economic development and structural change; economic growth resumed at a quicker pace. However, the growth rates of per capita income should be read with caution in the light of important emigration flows between 1950 and the early 1980s.8 In the 1970s growth came to a halt, affected by the revolution of 1974, the nationalization spree and the less favorable international conditions. Since the mid 1980s, the privatization of major financial and industrial conglomerates and the fiscal and monetary policies followed to join the European Union started a period of considerable modernization and growth. Today, Portugal’s GDP per capita is about 30-35% lower than the GDP per capita of the largest western European economies such as France, Germany or the United Kingdom, and about 20% lower than the GDP per capita in Spain.9 As in the case of Spain, it is important to analyze income concentration during the growth and stagnation years in order to re-assess the link between economic development and income distribution.
Third, Portugal (as well as Spain) provides new evidence on the relationship between economic integration and income concentration. As
6
Lains, 2003a,b argue that, despite its backwardness, the Portuguese economy had a good performance during the first half of the XXth century if compared to the previous fifty years. The economy expanded slowly under favorable external conditions before 1913, and expanded more rapidly when international economic conditions were less favorable after the First World War. Nevertheless, improvements were poor by Western European standards. See also Lains, 2003c.
7
Comparative data from Maddison, 2001, 2003. 8
The debate around the dynamic or stagnating features of the Estado Novo economic policy can be seen in Baklanoff, 1992, Hudson, 1989, ILO 1979 and Wheeler, 1990.
9
For an account of the economic evolution of Portugal during the XXth. century, see also Lains, 1995, Lopes 1994, 1996, Nunes et al., 1989 and Valério, 2001.
mentioned above, the country joined the European Union in 1986, after seven years of gradual reforms for the dismantling of barriers to trade, capital and labor mobility.
Finally, there are no studies on the evolution of inequality in Portugal from a long-run historical perspective. Therefore, this study can be seen as the first serious attempt at compiling systematic time series of income concentration using primarily individual tax statistics, which have been completely ignored by previous studies.10
A number of researchers have analyzed the evolution of income, earnings and expenditure inequality during the last thirty years in Portugal based on two types of sources: survey data and administrative records on wages and salaries. In the following paragraphs we summarize the main findings, which point to a reduction of income inequality and a sharp increase in earnings concentration since the beginning of the 1980s.
Using micro-data from the 1980/1981 and 1990/1991 households’ surveys, Rodrigues, 1993, 1994, 1996 and Gouveia and Tavares, 1995 detect an unambiguous decline in income inequality during the 1980s.11 In particular, Rodrigues 1994 finds that wages and capital income would have raised inequality, but their effects were nonetheless offset by the evolution of self-employees’ income and pensions. On the contrary, Gouveia and Tavares, 1995 argue that the reduction in inequality during the 1980s could have been the result of the trade-earnings argument acting in reverse in Portugal: increased trade with Europe could have reinforced the country’s specialization in low-skilled activities and therefore increased wages of unskilled workers. Nevertheless, the returns to education augmented substantially during the years after joining the European
10
The first two households’ budget surveys were conducted in 1967/1968 and 1973/1974. As it is usually the case, the primary purpose of the surveys was to collect expenditure information required as input to the construction of the consumer price index. As a result, the 1967/1968 survey did not contain income information. The 1973/1974 survey did inquire about incomes. Descriptive results from these two first surveys can be found in Castinheira and Ribeiro, 1977, Rodrigues, 1988 and Silva, 1971, 1982. However, the micro-data for these first two surveys have not survived. Since the 1980/1981 survey, information has been collected on household income, household composition and other socioeconomic characteristics.
11
This conclusion relies on the comparison of both surveys, implying that it is not possible to rigorously establish the evolution of income inequality in the intermediate years.
Union, as shown in Hartog, Pereira and Vieria, 2001, providing no clear evidence of a decline in the skill premium.12
Research has also been done on the basis of the European Community Household Panel (ECHP). Rodrigues, 1999 compares the 1994/1995 households’ survey with the 1995 ECHP. Budría, 2007 analyzes in detail the ECHP between 1994 and 2001 and documents a reduction in earnings and income inequality as well as a rise in the concentration of capital income during that period.
Several researchers have focused on earnings inequality. Based on the employees’ administrative records that we also use as a data source in this paper, Cardoso, 1998a analyzes the period 1983-1992 and finds that rising inequality characterized the evolution of labor returns over the whole period, the upper part of the earnings distribution playing a major role in shaping both the level and the trend of inequality. One feature stands out: a stretched top, where dispersion increased remarkably. The same tendency has been described in OECD, 1993 and Ministéro do Emprego, 1992, which reports a 10 percent rise in the Gini index for earnings from 1982 to 1989.13 Machado and Mata, 2001 and Hartog, Pereira and Vieria, 2001 suggest that a substantial part of this increase must be attributed to the returns to education, especially since joining the European Union.14
As we have already emphasized in Alvaredo and Saez, 2007, our series measure only top income (or wage) concentration and hence are silent about changes in the lower and middle part of the distribution. Therefore, our series can very well follow different patterns when compared to global inequality measures such as Gini coefficients or macro-based estimates. Additionally, it is worth
12
Batista, 2002 finds that the skill premium in Portugal has indeed fallen since the mid 1990s. 13
Other studies on income and earnings inequality in Portugal over the last decades include Albuquerque and Gouveia, 1994, Budría, 2008, Budría and Nunes, 2005, Budría and Pereira, 2007, 2008, Cantó et al, 2002, Cardoso, 1994, 1998b, 1999, 2006, Carneiro, 2007, Castanheira and Carvalho, 1997, Costa, 1994, Ferreira, 1992, Gouveia and Rodrigues, 2002, Hartog et al., 1999, Jimeno et al., 2000, Martins and Pereira, 2004, Rodrigues, 1996, 2005, 2008, Rodrigues et al.,
2000, Santos, 1983, Teekens, 1990, Vieira, 1999, Viera, Couto and Tiago, 2006. Cardoso and
Cunha, 2005 estimate aggregate wealth owned by Portuguese households between 1980 and 2004; however the authors do not deal with the distribution of wealth. Bover et al., 1998 study the Portuguese and the Spanish labor markets from a comparative perspective.
14
Murray and Steedman, 1998 analyze the evolution of workers’ skills in France, Germany, the Netherlands, Portugal, Sweden and the United Kingdom from a comparative perspective and
remembering that the rich are usually missing from surveys either for sampling reasons or because they refuse to cooperate with the time-consuming task of completing or answering to a long form. This explains the fact that the dynamics of top income shares estimated from tax statistics may not resemble those deriving from survey data. In particular, high-income earners in our study are much richer than those described in Budría, 2007, whose results are based on the ECHP.15
Our results show that income concentration was much higher during the 1930s and 1940s than it is today. Top income shares stayed relatively stable between the end of the Second World War and the end of the 1960s, followed by a large drop that began to be reversed at the beginning of the 1980s. Over the last fifteen years top income shares have increased significantly, and the rise in wage concentration contributed to the process in an important way.
The paper is organized as follows. Section 5.2 describes our data sources and outlines our estimation methods. In section 5.3 we present and analyze the evolution of top income between 1936 and 2003. Section 5.4 focuses on earnings concentration. Finally, section 5.5 offers a brief conclusion. The details on our data and methods together with the complete set of results are presented in the appendix.
2. Data and Methodological Issues
We study top income shares and wage concentration based on personal income tax statistics, information from schedular taxes on wages and salaries, and micro-data from administrative records on earnings.
2.1. Income
15
According to the results presented in Budría, 2007, an income of (in 2000 Euros) 62,760 was required in 2001 to belong to the top 1%, which had an average income of 75,879. Our estimations of top fractiles income levels show that the same group had an average income of 121,948, while an income of 62,760 only qualified as top 5-1%; see Table C. Budría’s unit of analysis is the household; ours is the tax unit defined in section 5.2.1.
Our estimates of top income shares are based on personal income tax return statistics compiled by the Portuguese bureau of statistics and the tax agency from 1936 to 1982 and between 1989 and 2003. Before 1976, because of high exemption levels, only a small fraction of individuals had to file a tax return; consequently we must restrict our analysis to the top 0.1% of the income distribution. From 1976 on, we can analyze the top 10%. Complete details on the methodology and data sources are provided in the appendix.
Our top groups are defined relative to the total number of tax units had everyone been required to file a tax return. The unit to which the tax data relate is the married couple, or single adult, or single minor with income in his or her own right. Our reference total for tax units takes this fact into account. Consequently the total number of tax units is defined as the number of all adult males and females (aged 20 and over) less the number of married females. For example, in 2003, there are 8,201,000 adults in the Portuguese population, 5,581,000 tax units and 3,979,000 tax files. The top 1% represents the top 55,810 tax filers. The information is available for census years; intermediate years have been linearly interpolated.
We define income as gross income before all deductions and including all income items reported on personal tax returns: salaries and pensions, self-employment and unincorporated business net income, dividends, interest, other investment income and other smaller income items. Only a fraction of realized capital gains is included in the tax base since 1989, and it is easy to satisfy the conditions for capital gains to go untaxed. In particular, gains from public debt bonds are exempted, as well as gains from stocks if kept for more than one year. Capital gains from real estate are also untaxed if the proceeds are used to purchase real estate property again. No information is available about the distribution of reported capital gains. They are presumably very small. Our income definition is before personal income taxes and personal payroll taxes but after employers’ payroll taxes and corporate income taxes. A detailed description of the evolution of the income tax in Portugal between 1936 and 2003 concerning exemption
thresholds, family allowances, tax deductions and marginal tax rates is provided in Table J and Table K in the appendix.
Our main data consists of tables displaying the number of tax returns and the amounts reported (gross income, taxable income, tax paid) for a large number of income brackets. As the top tail of the income distribution is very well approximated by Pareto distributions, we use simple parametric interpolation methods to estimate the thresholds and average income levels for each fractile. The same method has been applied in Alvaredo and Saez, 2007 and in most of the studies gathered in Atkinson and Piketty, 2007. Details of the estimation technique and the adjustments made to the raw series are provided in the appendix, respectively.We then estimate shares of income by dividing the income amounts accruing to each fractile by our series of personal income, defined ideally as total personal income reported on income tax returns had everybody been required to file a tax return.16 The total income denominator, described in the appendix, is mainly based on National Accounts statistics; the fact that only a small fraction of tax units file a tax return (especially until 1988) implies that the income denominator cannot be approximated by using income tax statistics only.17
Table 1 gives thresholds and average incomes for a selection of fractiles in Portugal in 2003. The average income is estimated primarily from National Accounts and hence is independent of tax statistics and hence not biased downwards because of tax evasion or avoidance.
2.2. Wages
The estimates of top wage income shares are based on two types of sources: tax statistics, on the one side (the schedular tax on wages (until 1982) and
16
This methodology is based on the classical study of Kuznets, 1953 as well as on the studies
presented in Atkinson and Piketty, 2007.
17 The methodology using tax returns to compute the level of top incomes, and using national
accounts to compute the total income denominator is standard in historical studies of income inequality. However, it differs from Feenberg and Poterba, 1993, who use total income reported on tax returns as their denominator and the total adult population as the number of tax units.
the withholdings at the source on wage income for the modern income tax since 1989) and micro-data on administrative records on the other (Quadros de Pessoal, 1985-2004).
The tabulations from the schedular tax have essentially the same structure as the one described above for the income tax. They have been compiled by the Portuguese bureau of statistics between 1936 and 1982 and display the number of tax returns (individually based) and the tax collection for a large number of brackets. However, several changes in the tax code, modifications in the coverage of the tax and the way the statistics are presented imply that we can only provide homogeneous estimates for 1964-1982. On the other side, the tabulations based on withholdings on wages for the income tax cover the period 1989-2000. We also assume a Pareto distribution to estimate top shares. In this case, the top groups are defined relative to the total number of workers while the shares of top wages are defined relative to the total wage bill from national accounts, net of employer social security contributions.
We provide estimates of shares of top wages based on micro-data from administrative records (Quadros de Pessoal), which are available between 1985 and 2004 (1990 and 2001 missing). Every year, employers are required by law to provide information about the firm and their employees. Civil service and domestic work are excluded. State-owned companies are included. Agriculture workers are included, although in practice the level of coverage is very low. Top groups are defined in terms of the total number of workers present in the records and the top shares are defined relative to the aggregate wages and salaries in the database. More details are provided in the appendix. Table H describes the size of the database for several groups of workers. More details about data sources and structure are provided in the appendix.
3. Top Income Shares
Figure 1 displays the average personal income per adult and the average income per tax unit along with the consumer price index for the period 1936 to 2003. As Portugal stayed neutral during the Second World War, the impact of the
conflict in terms of per capita GDP was relatively small; after the end of the war and up to 1950 growth was positive but low. The gap to the European core began to be partially abridged, though part of the recovery was due more to the negative effects of the war in the rest of the countries rather than to the improvements in Portugal. Rapid growth started in the 1950s and lasted until the beginning of the 1970s.18 The slowing down of economic growth that followed is generally attributed to the aftermath of the revolution that ended the dictatorship in 1974 and to the oil shock. The country experienced a severe economic crisis in the first half of the 1980s but growth resumed again after Portugal’s accession to the European Union in 1986, starting a period in which GDP per capita grew faster than the EU average; however, since 1999 the economy started to slow down and in early 2002 entered a recession.
Figure 2 displays the top 0.01% and the top 0.1% income shares between 1936 and 2003. The break between 1982 and 1988 reflects the unavailability of tax data during the five years before the change from the old to the new income tax. A number of important conclusions become apparent from this figure. First, the highest income concentration occurred in the 1930s and early 1940s. The top 0.1% share was above 4.5% (twice as high as in the recent period) and the top 0.01% share was around 2% (three times as high as in recent years). This strongly suggests that income concentration in Portugal in the 1930s was substantially higher than it is today. This pattern, also found in the case of Spain and in many of the studies gathered in Atkinson and Piketty, 2007 should not be unexpected as Portugal displayed a low average income and a high concentration of wealth.19
Second, the old income tax statistics display a large decrease in top shares in the first half of the 1940s. Indeed, the top 0.1% share went down from 5.2% in 1940 to 3.1% in 1946. This coincides with the Second World War and with a sharp increase in the statutory top marginal rates, which moved from 8.5% in
18
For an analysis of the period and a decomposition of growth by sector of activity, see Lains, 2003a.
19Harsgor, 1976 argues that under the old regime, Portugal’s private sector was dominated by 40
great families. The industrial dynasties were allied by marriage with the large traditional landowning families of the nobility. The top ten families owned all the important commercial banks.
1945 to 30% in 1946. However, the income-weighted marginal rates augmented only from 5% to around 9%. If the drop in the top 0.1% income share was solely due to an increase in the tax evasion/avoidance following the increase in the (income-weighted) marginal tax rate, then the elasticity of high incomes with respect to one minus the marginal tax rate would have been exaggeratedly high.
Third, top income shares recovered partially after the end of the war, this improvement being concentrated in the top 0.1-0.01%. The share of the top 0.1% in 1950 was above the levels of 1945. However, such a recovery was almost non-existent for the top 0.01%: after 1946 top 0.01% shares never attained the values displayed before. Tax statistics providing the composition of reported top incomes show that taxpayers in 1946 (representing the top 0.3%) obtained about 37% of their income from returns on real estate and farm income, 7% from returns on financial assets, 26% from non-farm business income and about 30% from employment income (see Table I in the appendix). This suggests that a significant portion of the very rich in Portugal were actually passive landowners deriving income from rents and farm business. Such facts are not astonishing in the light of the agricultural-based nature of the Portuguese economy by the middle of the twentieth century, and stand in contrast with Spain, where top income earners at that time were much more likely to be owners of financial assets and non-farm businesses, as discussed Alvaredo and Saez, 2007.
Fourth, income concentration remained around 1.0-1.1% for the top 0.01% and around 3.5% for the top 0.1% from 1946 to 1960, suggesting that the high income growth started at the beginning of the 1950s did not produce important changes until the beginning of the following decade. Top 0.01% shares in 1962-1973 were again stable but lower than the levels observed in 1946-1961.20 We conclude that the mild liberalization policies adopted by the government during the third quarter of the XXth century, and which are usually associated to
20
In 1965 a survey of 306 heads (chief executives, presidents) of manufacturing and service enterprises in Portugal’s six most industrialized districts (Aveiro, Braga, Lisbon, Oporto, Santarem and Setúbal) was conducted. The survey included questions pertaining to the socioeconomic origins, career patterns, self-image and opinions of the industrial élite. With the rapid advance of the industry and the growth of cities, new channels of upward mobility seemed to have opened. Makler’s (1969) study reveals that the typical businessman was drawn from middle-class background. See also Makler, 1974, 1976.
the increase in growth rates, did not impact on the concentration of income to a great extent. By 1963 the composition of top incomes had not changed in a significant way compared to 1946 either. This reflects the slow changes in the economic structure of the country. The published statistics show that the participation of capital income lost some ground in favor of employment and business income (see Table I).21
Finally, a drastic jump downwards in top shares happened since 1974, although it seems from the evolution of the top 0.1% that the decreasing trend started by the end of the 1960s. This coincides with the final period of the dictatorship and should be attributed to the loss of the African colonies and to the leftward movement of the revolutionary government after 1974, when a process of nationalizations broke up the concentration of economic power in the hands of the financial-industrial groups. As discussed in previous sections, banks and insurance companies were nationalized, basic industries became the property of the state and officials began to call for a major program of large-scale land expropriation. Individuals who had compromised with the old regime were ejected from their posts in universities and government agencies. As described in Bermeo, 1987, faced with the real possibility of expropriation or loss of employment, large groups of the Portuguese upper classes simply left the country. Consequently, the transition from dictatorship to democracy was associated with a significant drop in top shares.
Top incomes in the last three decades
The number of tax files augmented considerably since the mid 1970s; therefore we can analyze the top 10% of the distribution between 1976 and 2003.
Figure 3 displays top income shares for three groups within the top decile: the bottom half of the top decile (top 10-5%), the next 4% (top 5-1%) and the top percentile. Three elements are worth noticing. Firstly, the decrease in income
21
It should be noted that the changes in the composition of income are affected by the group considered: as composition statistics are only available in aggregate, they describe the top 0.3% of tax units in 1946 and the top 1.2% of tax units in 1963.
concentration, started very moderately at the beginning of the 1970s and which accelerated in 1974, reversed at the beginning of the 1980s. Second, although we cannot rigorously establish what happened between 1983 and 1988, the level of income concentration measured with the new income tax statistics in 1989 was higher than in 1982. Indeed, top shares in the early 1990s are similar to the levels of 1976-1977. This contrasts with the results, obtained from survey data, which point to a relative stable income distribution during the 1980s. Finally, the increase in top shares is higher the higher the fractile considered.
Figure 4 investigates the concentration pattern further by splitting the top 1% into three groups: the top 1-0.5%, the top 0.5-0.1% and the top 0.1%. Again, the higher the fractile, the higher the increase in the share from 1989 to 2003: the top 1-0.5% increases 25% from 2.5% to 3.2% while the top 0.1% increases 50% from 1.5% to 2.3%. This pattern was also found in the case of Spain. We have already shown in Alvaredo and Saez, 2007 that the increase in income concentration that took place in Spain since 1981 has been a phenomenon concentrated within the top 1% of the distribution and in particular within the top 0.1%; the top 10-5% share declined. However, in Portugal, all groups within the top decile display important increases.
The break in the series between 1982 and 1989 hide the effects of important changes in the tax structure. Between those years, the top statutory marginal rates came down from 70% (80% for single individuals) to 40%. In 1988 the schedular tax on wages (with a marginal rate of 22% on the highest salaries) was removed. Figure 5 displays such a drop. The income weighted marginal rate for the top 0.1% group dropped from around 62% in 1979 to 40% in 1989. The experience since 1989, when constant top marginal rates coexist with an increasing trend in top shares, suggest that the level of marginal tax rates at the top is not the primary determinant of the level of top reported incomes.
How does Portugal stand in relationship with other countries? Figure 6 and Figure 7 display the top 0.1% and top 0.01% income shares, respectively, in Portugal in comparison with a number of countries: Spain (Alvaredo and Saez, 2007), France (Piketty 2001 and Landais, 2007), the United States (Piketty and Saez, 2003), Switzerland (Dell, Piketty and Saez, 2007) and the United Kingdom (Atkinson, 2005). In the late 1930s, Portugal starts with a level of income concentration that is higher than Spain and similar to France and the United States. Nevertheless, income concentration in France and the United States falls more sharply than in Portugal during the Second World War. As a consequence, the level of concentration in Portugal between 1950 and 1975 remains high relative to the other the countries plot in the figures. Quite interestingly, between 1945 and the beginning of the 1960s the level of concentration in Portugal is comparable to that of Switzerland. Between 1960 and the first half of the 1970s, top income shares in Switzerland are higher, but the distance to Portugal narrows if we take into account the emigration flows analyzed in the next section. The large drop in top shares in the mid 1970s is noticeable not only in terms of the evolution of concentration in Portugal, but also from a comparative perspective. Nevertheless, it is clear from these figures that not all the drop should be attributed to the political turmoil or the economic policies of the revolutionary period: top shares in the UK and Switzerland also experienced important reductions in 1970-1975, even when the change in Portugal was definitely more radical. Finally, as in the case of Spain, the increase in income concentration in the last years is small compared to the upsurge observed in the United States and other Anglo-Saxon countries; Portugal’s experience is closer to those of continental Europe countries.
Emigration Flows and Sensitivity of the Results
Emigration has been one the main features of the Portuguese socio-economic situation in Portugal during the XXth. century. It has provided a safety valve for open and disguised unemployment. According to official estimates, 1.8 million individuals left the country between 1950 and 1975, which is a significant
number for a population that grew only from 8.5 million to 9.3 million between those dates.22 We would like to assess the effects of such large-scale migrations on our top shares estimates. For instance, one of the results presented in the previous section -that the top 0.01% share has been fairly stable between 1946 and 1961 and also stable between 1962 and 1970 at a slightly lower level- could be driven by the dynamics of migrations flows. Other things equal, adding up all emigrants each year to our population control provides an upper bound for top shares.23 Such a change increases our estimates in 1970 by 19% for the top 0.01% and by 21% for the top 0.1% (meaning that the share of the top 0.01% became 0.94% in place of 0.79%). The results are presented in Figure 8, where we plot the top 0.01% income share between 1946 and 1978 together with the counterfactual estimates.
4. Wage Concentration
Unfortunately, tax statistics do not allow for a dynamic analysis of income composition at the top as we did for Spain in Alvaredo and Saez, 2007 because the Portuguese tax tabulations do not provide information on the composition of top incomes. Notwithstanding this shortcoming, we can get more direct evidence on changes in inequality from wage income distribution statistics available on an annual homogeneous basis. It is important to keep in mind that those series capture only wage income concentration and hence are silent about changes in business and capital income concentration.
As we did for overall personal income, Figure 9 displays top wage income shares between 1964 and 2000 for three groups within the top decile: the bottom half of the top decile (top 10-5%), the next 4% (top 5-1%) and the top percentile, while Figure 10 splits the top percentile in three groups: the top 1-0.5%, the top
22 Valério, 2001.
23
Adding up all emigrants to the population control amounts to assuming that all of them can be considered as tax units, that they are alive throughout the period and that they would have had little income if stayed in Portugal. Therefore we need to go further down in the distribution to locate the top x%. Statistics show that migrants were mostly young males, as described in Conim, 1976. Assuming the same growth rate of tax units since 1950 for Portugal as in Spain or France gives very similar results.
0.5-0.1% and the top 0.1%. The information suggests that wage income concentration (top 1% and above) fell significantly during the last years of the authoritarian regime and the transition. Unlike the case of total income, the sharp decrease in top wages between 1970 and 1976 is clearly a phenomenon concentrated in the top 1% and especially in the top fractiles within the top 1%. Interestingly, despite important movements over the period, the level of concentration within the 1% by the end of the 1990s is comparable to the level of 1970 and slightly lower than the levels in 1964-1969. This suggests that the increase in overall income concentration over the last years has also been in Portugal extremely influenced by the evolution of top wages.
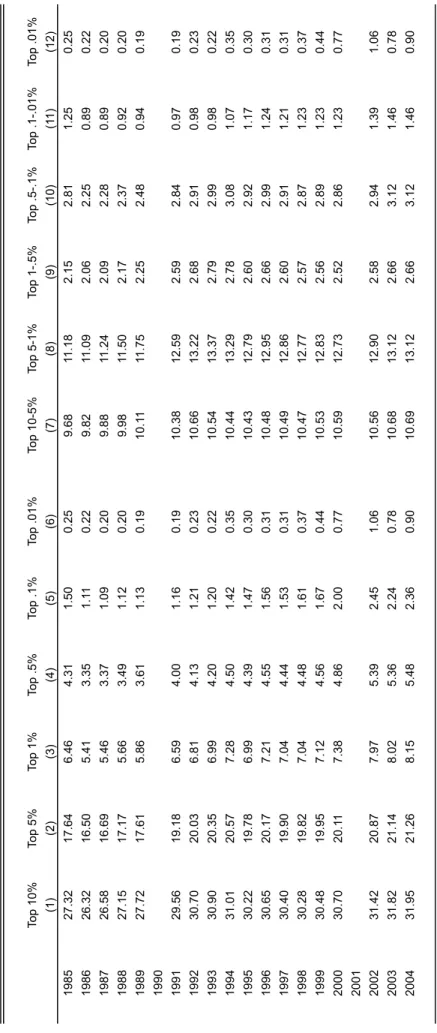
Figure 11 and Figure 12 describes the same shares but their results come form the micro-data on administrative records over 1985-2004. Two periods seem to be clearly identifiable: (i) until 1993-1994 the increase in earnings concentration is mostly condensed in the top 5-0.1%; the top 0.1% is stable or even decline between 1985 and 1986; (ii) since 1994-1995, the increase in concentration is mainly happening in the top 0.1%, which augments considerably from 1.4% in 1994 to 2.4 in 2004, that is, around 70%.24
These conclusions do not depend on the subset of workers included in the administrative records. Figure 13 compares the top 1-0.5%, the top 0.5-0.1% and the top 0.1% wage income shares from Quadros de Pessoal (already presented in Figure 12) with the series computed from income tax statistics (in which all workers filing a return are included, without distinction of sector of activity). Both set of series follow the same pattern, and the income tax statistics display even larger increases. Figure 14 compares shares within shares according to both sources.
Together with the estimates in Table F, the presented evidence suggest that the patterns are not only coincident with the findings of Cardoso, 1998 for the period 1983-1992 but also that they have been reinforced between 1992 and 2004: a relatively compressed bottom and a stretched top can be highlighted as the main characteristics of the Portuguese earnings distribution. The high degree of
24
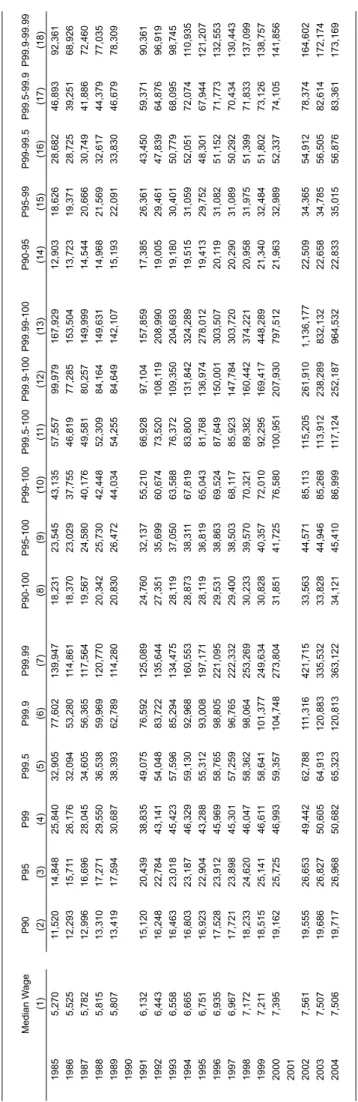
inequality prevailing in the country’s labor market is essentially due to the fact that high wages are very high relative to the rest of the distribution, and the gap has kept growing. Figure 15 plots the P90 and P10 fractile wage levels as a percentage of the median wage from 1985 to 2004 as another way of looking at the widening gap.
5 Conclusion
This paper has attempted to analyze income and earnings concentration in Portugal from a long-run perspective using the best available statistical evidence. Our results suggest that income concentration was much higher during the 1930s and early 1940s (at levels comparable to other countries such as France, Spain or the United States) than it is today. Top income shares estimated from reported incomes deteriorated during the Second World War, even if Portugal did not take active participation in the conflict. However, the magnitude of the drop was less important than in other European countries. The level of concentration between 1950 and 1970 remained relatively high compared to countries such as Spain, France, UK or the United States. The decrease in income concentration, started very moderately by the end of the 1960s and which accelerated after the revolution of 1974, began to be reversed at the beginning of the 1980s. During the last fifteen years the shares above the top 10% have augmented steadily. The increase has been higher, the higher the fractile considered
The evidence since 1989 suggests that the level of marginal tax rate at the top has not been the primary determinant of the level of top reported incomes. Marginal rates have stayed constant in a context of growing top shares.
The dynamics of top incomes have been partially driven by the behavior of top wages. Between 1985 and 1994 the increase in earnings concentration has been mostly condensed in the top 5-0.1%. Since then, the increase in concentration is happening mainly in the top 0.1%
APPENDIX
A. The Taxes on Income, Wages and Salaries in Portugal A.1. The ‘old’ income tax
In Portugal, income taxation was enforced for the first time in 1641 as a 10% flat rate on rents, capital incomes and business incomes (décima militar); in its origins it was a source to finance the restoration wars. During the XIX century, the system evolved towards the traditional scheme of independent schedular taxes: Contribução Predial, Contribução Industrial, Décima de Juros. With modifications, the schedule taxes survived until 1988.
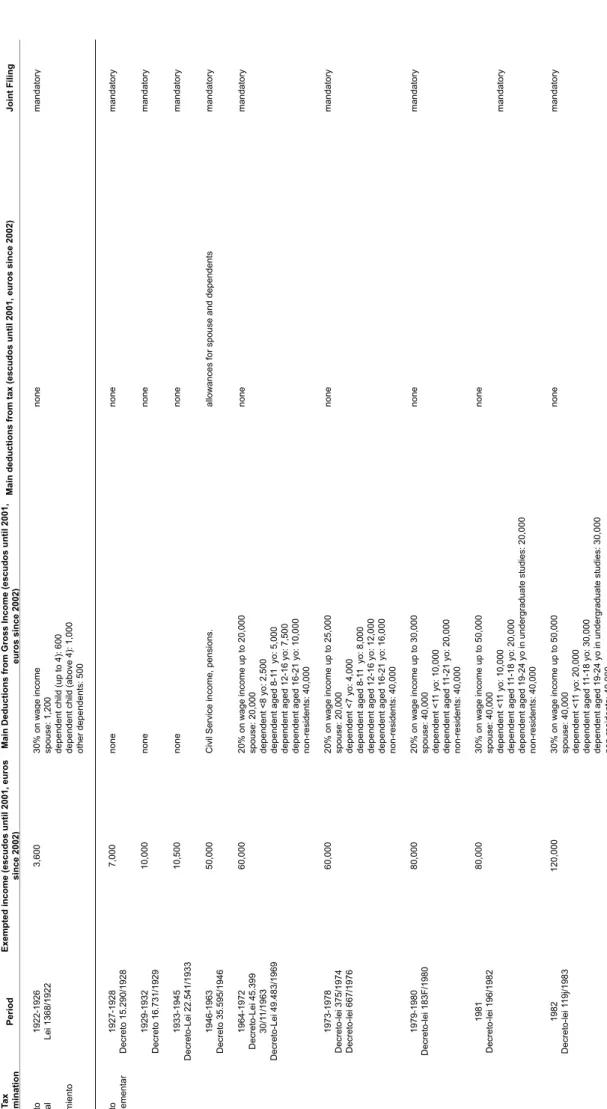
Table J and Table K summarize the main features of the evolution of the personal income tax in Portugal between 1922 and 2003. The first personal income tax (Imposto Pessoal do Rendimento) was enforced in 1922 (Law 1368/1922). It was defined as a tax levied on top incomes in addition to the traditional schedule taxes (at the time: Contrïbuçao Industrial on wages, business income and self-employment income, Contrïbuçao Predial on rents, Imposto sobre a Aplicação de Capitais on capital income); no provisions were made regarding capital gains. It was a truly independent personal overall income tax. However, several difficulties on its applicability, a high noncompliance rate and the turbulent macroeconomic environment of the First Republic forced its rapid substitution.
In 1928, the government replaced the Imposto Pessoal do Rendimento with a new income tax, the Imposto Complementar (Law 15290/1928 and Decree 16731/1929) affecting the taxable income defined for the schedule taxes (at the time: Contrïbuçao Industrial for business income, Imposto Profissional for wages and self-employment income, Contrïbuçao Predial for rents, Imposto sobre a Aplicação de Capitais for capital income). The Imposto Complementar, with two major reforms in 1946 and 1963, remained in existence until 1988.
Between 1950 and 1963 those individuals accumulating two or more civil servant positions, jobs in the private sector or independent professions were subject also to a supplementary tax (Adicionamento, Decree-Law 37771 of 2/28/1950). However, this tax affected a very small number of individuals: in 1951, for instance, only 537 individuals paid the Adicionamento, out of 25,362 who filed for the Imposto Complementar.
A.2. The ‘modern’ income tax
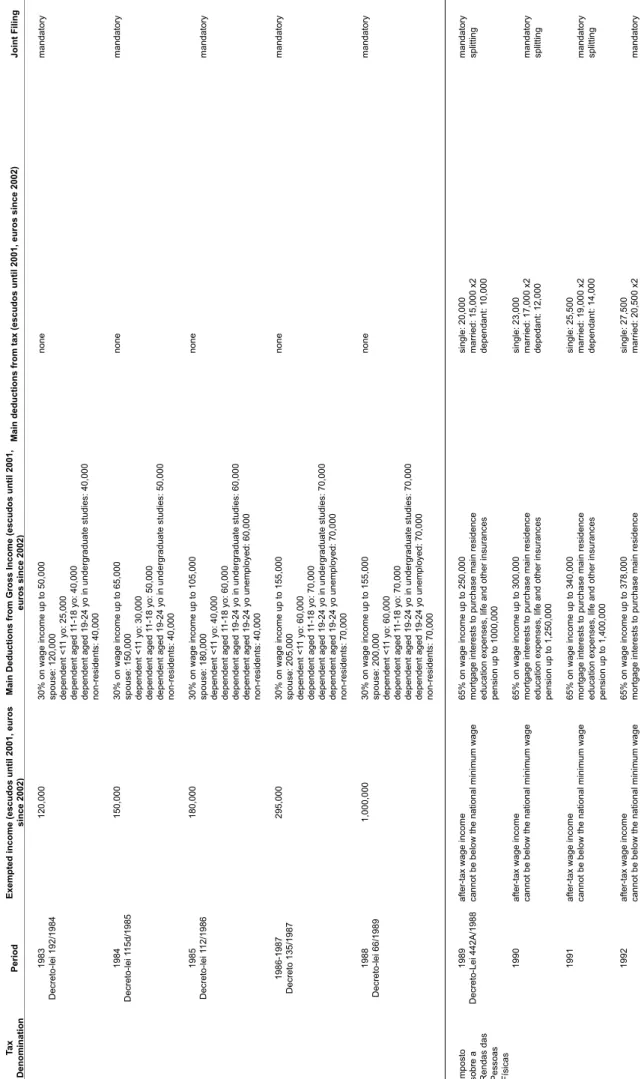
The modern personal income tax (Imposto sobre o Rendimento das Pessoas Singulares IRS) was established in 1989 (Decree-Law 442A/1988), when the Imposto Complementar and all the schedule taxes were abolished. Taxable income covers (i) wages and salaries (Categoria A), (ii) self-employment income (Categoria B), (iii) business income (Categoria C), (iv) farm income (Categoria D), (v) capital income (Categoria E), (vi) urban and rural real estate rents (Categoria F), (vii) capital gains
(Categoria G), (viii) pensions (Categoria H) and (ix) other smaller income items (Categoria I). Concerning the Categoria G, capital gains from public debt bonds are untaxed, as well as gains from stocks if kept for more than one year. Capital gains from real estate are also untaxed if the proceeds are used to purchase new real estate.
Between 1989 and 2003 the top marginal tax rate was stable at 40%, while the bottom rate declined from 16% in 1989-1990, to 15% in 1991-1998, 14% in 1999-2000 and finally 12% in 2001-2003. Contrary to the worldwide trend of reducing the number of brackets of the statutory tax scale, Portugal moved first from a 5-bracket to a 4-bracket scale between 1990 and 1991, but then went back to 5 brackets in 1999 and to a 6-bracket scale in 2002. Taxation is based on the family unit. To take the taxpayer’s family status into account, the use of an income-splitting system to ascertain taxable income is applied. In particular, income of married couples is divided by two in order to determine the marginal tax rate to be applied according to the statutory tax scales shown in TABLE J.
For a comprehensive description of the modern income tax in Portugal, see Direcçao-Geral dos Impostos, 1998a, 1998b, 2005.
A.3. Schedule Tax on Wages
In 1929 the government created the Imposto Profissional, a schedular tax on wages and salaries (including agriculture) and self-employed liberal professionals; civil servants were excluded (Decree 16731 of 4/14/1929 and Decree 19,359 of 2/19/1931).25 Initially there was a progressive tax scale with marginal tax rates from 2% to 8% affecting wage income, while self-employees were taxed with lump sums (variable across professions). Several reforms modified the scope of the tax, the exemption thresholds and the tax scales (Decree 19359 of 2/16/1931, Law 1952 of 3/10/1937, Decree-Law 33735 of 6/26/1944, Decree-Law 34353 of 12/30/1944). A detailed description of the Imposto Profissional during the first half of the XXth. century can be found in Mouteira Guerreiro, 1947. After the fiscal reform of 1962-1964 (Decree-Laws 44305 of 4/27/1962, 45400 of 11/30/1963, 45676 of 4/24/1964, 45977 of 10/19/1964), statutory top marginal tax rates were successively increased to 15% in 1964-1972, 20% in 1973-1975 and 22% in 1976-1988. The number of tax brackets also rose considerably. The tax was abolished in 1988 with the introduction of the modern income tax in 1989.
B. References on Data Sources for Portugal B.1. Income Tax Statistics
Available statistical information about the Imposto Pessoal do Rendimento appears in República Portuguesa, Ministério das Finanças, Direcção Geral de Estatística, Ia. Repartiçao, Estatística das Contribuïções e Impostos, Liquidaçaõ e Cobrança nas gerências de 1922-1923 a 1924-1925 and República Portuguesa, Ministério das
25
Finanças, Direcção Geral de Estatística, Ia. Repartiçao, Liquidaçaõ e Cobrança na Gerência de 1925-1926. However, these publications only display total tax collections with no data about the distribution of income or tax paid by brackets; consequently this information, if interesting from the historical point of view, has not been used for our estimations of top income shares.
Statistical information has been published regularly since 1936 with increasing degree of detail.
1936-1945: The published tables show the distribution of the number of taxpayers by ranges of tax collection together with the totals for gross income and tax paid. Instituto Nacional de Estatística, Anuário Estatístico das Contribuïções e Impostos 1936, 1937, 1938, 1939, 1940, 1941, 1942, 1943, 1944, 1945.
1946-1963: The published tabulations display the number of taxpayers and the gross assessed income organized by ranges of total before tax income, the number of taxpayers and the taxable income by ranges of taxable income, and, finally, the number of taxpayers and tax paid by ranges of tax paid. Instituto Nacional de Estatística, Anuário Estatístico das Contribuïções e Impostos, 1946, 1947, 1948, 1949, 1950, 1951, 1952, 1953, 1954, 1955, 1956, 1957, 1958, 1959, 1960, 1961, 1962, 1963.
1963-1982: The published statistics are organized by range of taxable income (gross income net of deductions), and they provide the distribution of the number of taxpayers and the taxable income by brackets. The data also provide information on total deductions. Instituto Nacional de Estatística, Anuário Estatístico das Contribuïções e Impostos, 1964, 1965, 1966 and Portugal, Instituto Nacional de Estatística, Estatísticas das Contribuições e Impostos, Continente e Ilhas Adjacentes, 1967, 1968, 1969, 1970, 1971, 1972, 1973, 1974, 1975, 1976, 1977, 1978, 1979, 1980, 1981, 1982.
1983-1988: Unfortunately, during the transition period from the Imposto Complementar to the new Imposto sobre o Rendimento das Pessoas Singolares, no usable tabulations by income or tax brackets are available. Only aggregated information about total assessed income, total taxable income and total tax collection appears in Instituto Nacional de Estatística, Estatísticas das Contribuições e Impostos, Continente e Ilhas Adjacentes, 1983-1988. Consequently our series have a gap in those years.
1989-2003: Finally, the fiscal reform of 1988 and the increasing managerial capabilities of the tax agency implied an improvement in the amount and quality of available information on individuals’ income. Since then, the published statistics, by brackets of gross income, display taxable income, gross income, tax paid and a thorough detail of deductions. No information is provided about the composition of income. Individual are classified in two groups: those having income from wages and pension only, on the one side, and those having income also from other sources. Portugal, Instituto Nacional de Estatística, Estatísticas das Receitas Fiscais, 1989-1992, 1993-1995, 1996, 1997, 1998, 1999, 2000.
Tabulations for 2001, 2002 and 2003 were provided by the tax agency of Portugal, based on internal reports.
B.2. Statistics on Wages and Salaries
The information on earnings is obtained from the tabulations of the schedular tax on wages and salaries, the Imposto Profissional (1936-1982), the income tax (1989-2000) and the micro-data from Quadros de Pessoal (1985-1989 (1990 missing), 1991-2000 (2001 missing) and 2002-2004).
The tabulations from the Imposto Profissional are organized by intervals of tax collections, and they display the number of taxed workers and the total tax paid by brackets. The published information covers 1936-1982; however we can only offer homogeneous estimates for the period 1964-1982. We used the tax code to recover the brackets of earnings from the brackets of tax paid, and the earnings by brackets from the tax collections by brackets.
Instituto Nacional de Estatística, Anuário Estatístico das Contribuïções e Impostos, 1936, 1937, 1938, 1939, 1940, 1941, 1942, 1943, 1944, 1945; Instituto Nacional de Estatística, Anuário Estatístico das Contribuïções e Impostos, 1946, 1947, 1948, 1949, 1950, 1951, 1952, 1953, 1954, 1955, 1956, 1957, 1958, 1959, 1960, 1961, 1962, 1963Instituto Nacional de Estatística, Anuário Estatístico das Contribuïções e Impostos, 1964, 1965, 1966. Portugal, Instituto Nacional de Estatística, Estatísticas das Contribuições e Impostos, Continente e Ilhas Adjacentes, 1967, 1968, 1969, 1970, 1971, 1972, 1973, 1974, 1975, 1976, 1977, 1978, 1979, 1980, 1981, 1982, 1983-1988.
For the period 1989-2000, the information on earnings comes from the tabulations of the income tax. The published statistics, based on withholdings at source and organized by ranges of gross earnings, display the number of workers and the gross wages. The information corresponds to the individual and not to the family as in the income tax statistics. Portugal, Instituto Nacional de Estatística, Estatísticas das Receitas Fiscais, 1989-1992, 1993-1995, 1996, 1997, 1998, 1999, 2000.
B.3. Administrative Records on Wages: Quadros de Pessoal
Every year, employers are required by law to provide information about the firm (location, economic activity, employment, sales, legal setting) and their employees (individual basic wages, overtime, bonuses, gender, level of education, skills, duration of work (full-time/part-time), date of latest promotion, tenure). The information corresponds to March for years 1985-1993, and October for years 1994-2004. Civil service and domestic work are excluded. State-owned companies are included. Agriculture workers are included, although in practice the level of coverage is very low. For manufacturing, a thorough evaluation of the coverage of Quadros de Pessoal can be made, since a census of manufacturing is available. As argued in Cardoso, 1998, comparison of the two sets reveals that the Quadros de Pessoal covers more workers than the census itself, despite the fact that the census includes very small productive units that are not a part of the population covered by the Quadros de Pessoal (mainly firms with no wage earners). The Direcçao-Geral
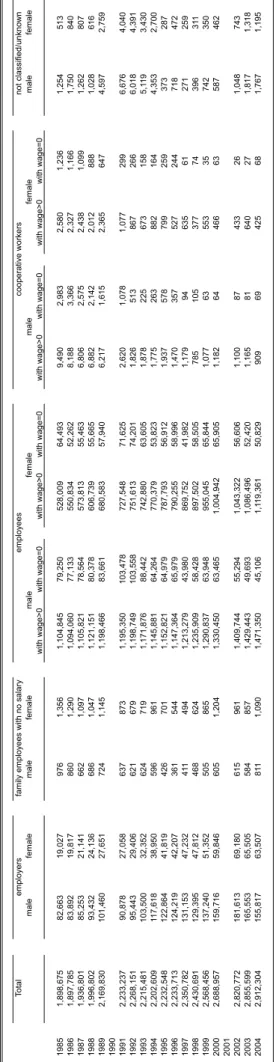
de Estudos, Estatística e Planeamento (DGEEP) publishes regularly a report with the main results, Estatísticas em Síntese (available on line). The data were first collected in 1982 but micro-data starts in 1985. All results based on Quadros de Pessoal were computed from the micro-data for 1985-1989 (1990 missing), 1991-2000 (2001 missing) and 2002-2004. Table H describes the size of the database and classifies individuals according the following categories: employers, family employees without salaries, employees, cooperative workers and unknown/not classified individuals.
C. Income and Earnings Denominators C.1. Total Income Denominator
The National Accounts income series between 1953 and 1995 was obtained from Banco de Portugal, Séries Longas para a Economia Portuguesa. Pós II Guerra Mundial. Vol I and Vol II. For the years following 1996, the information comes from Instituto Nacional de Estatística (2003) Contas Nacionais Base 1995 and Instituto Nacional de Estatística (2006) Contas Nacionais Anuais Definitivas Base 2000. For 1936-1952 the previously described series were extended backwards using the information from Batista, Martins, Pinheiro and Reis, 1997.
For the period 1989-2003, total income is defined as wages and salaries from National Accounts net of effective social security contributions, plus 50% of social transfers, plus 66% of unincorporated business income plus all non-business, non labor income reported on tax returns. This methodology generates an income denominator that fluctuates around 60% of Portuguese GDP, which is slightly lower than the ratio found for Spain (see Alvaredo and Saez, 2007) and similar to that used for France (see Piketty, 2001). For the period 1936-1983, we use as denominator 60% of the Portuguese GDP from the sources listed above.
The total denominator series expressed in 2000 Euros is reported in Table A, Column 5. The average income per adult is reported in Column 6 while the average income per tax unit is displayed in Column 7. Column 8 shows the CPI index (base 100 in year 2000).
C.2. Total Wage Denominator
Total wages are defined as wages and salaries from national accounts net of effective social contributions paid by employers. As in the income denominator case, the information between 1953 and 1995 has been taken from Banco de Portugal, Séries Longas para a Economia Portuguesa. Pós II Guerra Mundial. Vol I and Vol II (series Remunerações do Trabalho no Território, Ordenados e Salários and Contribuções Sociais Efectivas dos Empregadores). For the years following 1996, the information comes from Portugal, Instituto Nacional de Estatística (2003) Contas Nacionais Anuais Definitivas Base 1995 and Portugal, Instituto Nacional de Estatística (2005) Contas Nacionais Anuais Definitivas Base
2000. For 1936-1952 we assume that the growth rate of total wages equals the nominal GDP growth rate.
C.3. Prices
The price index is based on the following sources: (a) for the period 1936-1945: Instituto Nacional de Estatística, Anuário Estatístico, 1936, 1937, 1938, 1939, 1940, 1941, 1942, 1943, 1944, 1945, Indices de Preços de Retalho, base 1914=100; (b) for the period 1946-1951, Instituto Nacional de Estatística (1985) Portugal 50 anos 1935-1985; (c) for the years following 1951, Consumer Price Index from Instituto Nacional de Estatística, Anuário Estatístico, 1952-1975 and Instituto Nacional de Estatística, Divisão de Estatísticas da Distribuçao e Serviçios, Indicadores da Actividade Económica: Indices de Precios do Consumidor, several years.
C.4. Total Number of Individuals and Tax Units
As we mentioned before, joint filing for married couples has always been mandatory in Portugal. Thus, the unit to which the income tax data relate is the married couple, or single adult, or single minor with income in his or her own right. Our reference total for tax units takes this fact into account. Consequently the total number of tax units is defined as the total number of adult males and females (aged 20 years old and over) less the number of married females. Information is obtained from the national census: Recenseamento Geral da População e da Habitação, 1930, 1940, 1950, 1960, 1970, 1981, 1991, 2001. Intermediate years have been linearly interpolated. The information is also available in Instituto Nacional de Estatística, Anuário Estatístico de Portugal, several years, and Instituto Nacional de Estatística (1985), Portugal 50 anos, 1935-1985 and Valério, 2001.
C.5. Total Number of Employees
The number of employees comes from (a) Banco de Portugal, Séries Longas para a Economia Portuguesa. Pós II Guerra Mundial. Vol I and Vol II (1953-1995), (b) Portugal, Instituto Nacional de Estatística (2003) Contas Nacionais Anuais Definitivas Base 1995 and Portugal, Instituto Nacional de Estatística (2005) Contas Nacionais Anuais Definitivas Base 2000 (1996-2004); (c) the national census of 1930, 1940 and 1950. Missing years have been linearly interpolated. The number of civil servants was obtained from (a) the national census of 1930, 1940 and 1950 (1936-1952); (b) Banco de Portugal, Séries Longas para a Economia Portuguesa. Pós II Guerra Mundial Vol I and Vol II (1953-1967) and (c) International Labor Organization Database (2000-2002).
The number of emigrants from Portugal was obtained from Valério (2001) Estatísticas Históricas Portuguesas, Lisboa: Instituto Nacional de Estatística, which builds on the following sources:
Baganha, M. (1990). Portuguese Emigration to the United States 1820-1930, New York: Garland Publishing Inc.
Baganha, M. (1991). Uma Imagem Desfocada – A Emigração Portuguesa e as Fontes sobre a Emigração, Análise Social, 26(112-113).
Baganha, M. (1993). Principais Características e Tendências da Emigração Portuguesa, in APS, Estructuras Sociais e Desenvolvimento, Lisboa: Fragmentos.
Baganha, M. (1994). As Correntes Emigratórias Portuguesas no Século XX e o seu Impacto na Economia Nacional, Análise Social, 29(128).
Pereira, M. (1993). Liberdade e Contenção na Emigração Portuguesa 1850-1930, in M. Silva, Emigração/Imigração, Lisboa: Fragmentos.
D. Estimating Top Shares D.1. Basic Pareto Interpolation
The general interpolation technique is based on the well known empirical regularity that the top tail of the income distribution is very closely approximated by a Pareto distribution. A Pareto distribution has a cumulative distribution function of the form F(y)=1-(k/y)a where k and a are constants, and a is the Pareto parameter of the distribution. Such a distribution has the key property that the average income above a given threshold y is always exactly proportional to y. The coefficient of proportionality is equal to b=a/(a-1).
The first step consists then in estimating the income thresholds corresponding to each of the percentiles P90, P95, P99, …, P99.99, that define our top income groups. For each percentile p, we look first for the published income bracket [s,t] containing the percentile p. We estimate then the parameters a and k of the Pareto distribution by solving the two equations: k=s p(1/a) and k=t q(1/a) where p is the fraction of tax returns above s and q the fraction of tax returns above t.26 Note that the Pareto parameters k and a may vary from bracket to bracket. Once the density distribution on [s,t] is estimated, it is straightforward to estimate the income threshold, say yp, corresponding to percentile p.
For the top bracket this method cannot be applied and we therefore assume that the top bracket is Pareto distributed with parameters a and k equal to those of the bracket just below the top estimated by the method described previously.
The second step consists of estimating the amounts of income reported above income threshold yp. We estimate the amount reported between income yp and t (the upper bound of the published bracket [s,t] containing yp) using the
26
This is the standard method of Pareto interpolation used by Kuznets (1953) and Feenberg and Poterba (1993).
estimated Pareto density with parameters a and k. We then add to that amount the amounts in all the published brackets above t.
Once the total amount above yp is obtained, we obtain directly the mean income above percentile p by dividing the amount by the number of individuals above percentile p. Finally, the share of income accruing to individuals above percentile p is obtained by dividing the total amount above yp by our income denominator series. Average incomes and income shares for intermediate fractiles (P90-95, P95-99, etc.) are obtained by subtraction.
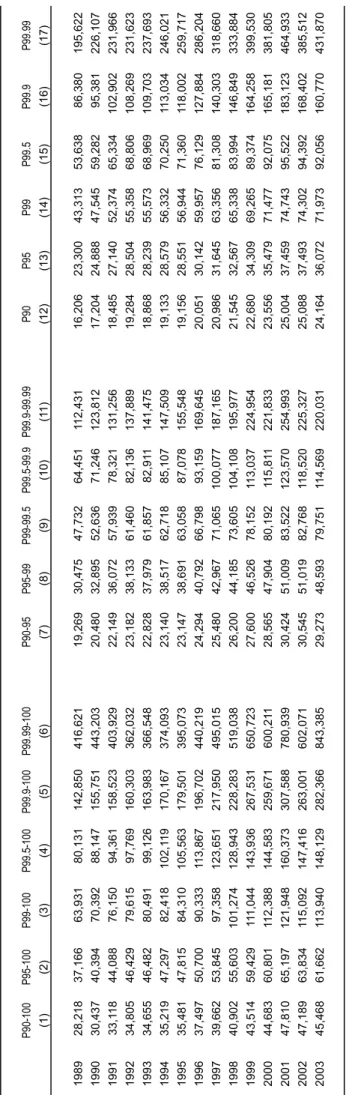
Results are presented in Table B (top income shares between 1936 and 2003), Table C (top fractiles income levels between 1989 and 2003), Table E.1 (top wage income shares between 1964 and 2000) and Table E.2 (fractiles of earnings between 1964 and 2000).
D.2. Adjustments to Raw Pareto Interpolations
1936-1945: The statistics are organized by ranges of tax paid. We estimate the ranges of income and the total income in those ranges by applying the statutory tax scale and the taxable thresholds given in Table J and in Table K. Total assessed income is reported in aggregate in the statistics. Consequently we can check that our estimation of assessed income by brackets is accurate.
1964-1982: The statistics are organized by range of taxable income and they provide information on taxable income. Total income equals taxable income plus family deductions (which were introduced in 1964) plus other deductions. The evolution of family deductions is described in Table K. We add back those deductions to our income estimates in order to estimate shares based on income before those deductions. As family deductions are reported only in aggregate, we impute the family deductions to each bracket by assuming that on average each tax filer is entitled to the same amount of deductions. The information on non-family based deduction is also reported in aggregate. We imputed these deductions proportionally to the reported taxable income according to the general rules of the tax code.
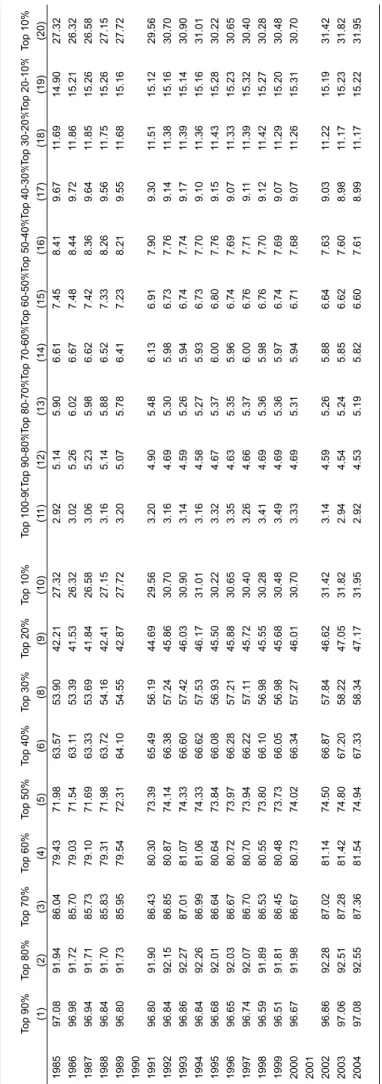
D.3 Estimating Top Shares from Administrative Records on Earnings We also computed shares of top wages using micro-data from Quadros de Pessoal between 1985 and 2004 (1990 and 2001 missing). The number of individual observations ranges from 1,898,675 in 1985 to 2,912,304 in 2004. However, not all of them refer to workers. Individuals are classified as employers, family employees with no salary, employees and cooperative workers. In our estimations we only consider individuals with non zero wages in the last two groups. Shares of top wages are presented in Table F, where we also provide estimations for the left part of the distribution. Original amounts corresponds to the monthly level. Table G show income levels of selected fractiles, where we annualize the amounts by up-scaling monthly earnings by a factor of 14 (employees generally receive 14 months’ pay for 11 months’ work; the extra three months’ pay is for a Christmas bonus, a vacation subsidy and a period of annual leave).
D.4. Estimating Marginal Tax Rates
Average marginal tax rates (income weighted) used in Figure 5 have been computed as follows. We consider each of the income thresholds P99, P999, etc. estimated from the interpolation methods described in this Appendix. We subtract from the raw income the average level of deductions and average level of allowances (for example, for the income threshold P99, we identify the bracket in the tax tabulations to which this level of income belongs and subtract the average deductions and allowances in that bracket). This gives the net taxable income. Tax liability is obtained by applying the tax schedules in Table J (from which the marginal tax rate for any taxable income can be obtained) to the taxable income.
We estimate the income-weighted marginal tax rate for the top 0.1% as: [Share P99.9-99.99 x MTR 99.95 + Share 99.99-100 x (MTR 99.99+MTR99.999)/2]/
[Share P99.9-99.99+Share P99.99-100]
where Share P99.9-99.99 denotes the income share of group P99.9-99.99 and MTR 99.95 denotes the income-weighted marginal tax rate at percentile 99.995.