HAL Id: tel-01177457
https://tel.archives-ouvertes.fr/tel-01177457v3
Submitted on 6 May 2015HAL is a multi-disciplinary open access
archive for the deposit and dissemination of sci-entific research documents, whether they are pub-lished or not. The documents may come from teaching and research institutions in France or abroad, or from public or private research centers.
L’archive ouverte pluridisciplinaire HAL, est destinée au dépôt et à la diffusion de documents scientifiques de niveau recherche, publiés ou non, émanant des établissements d’enseignement et de recherche français ou étrangers, des laboratoires publics ou privés.
Visual Observation of Human Emotions
Varun Jain
To cite this version:
Varun Jain. Visual Observation of Human Emotions. Computer Vision and Pattern Recognition [cs.CV]. Université Grenoble Alpes, 2015. English. �NNT : 2015GREAM006�. �tel-01177457v3�
THÈSE
Pour obtenir le grade de
DOCTEUR DE L’UNIVERSITÉ DE GRENOBLE
Spécialité : InformatiqueArrêté ministériel : 19 octobre 2011
Présentée par
Varun JAIN
Thèse dirigée par James L. Crowley et codirigée par Augustin LUX
préparée au sein du Laboratoire d’Informatique de Grenoble à l’INRIA Grenoble Rhône-Alpes
dans l'École Doctorale de Mathématiques, Sciences et Technologies de l’Information, Informatique
Visual Observation of Human
Emotions
Thèse soutenue publiquement le 30 mars 2015, devant le jury composé de :
Mme. Elisabeth ANDRÉ
Professeur, Universität Augsburg, Rapporteur Mme. Laurence DEVILLERS
Professeur, Université Paris-Sorbonne, Rapporteur M. Mohamed CHETOUANI
Professeur, Université Pierre et Marie Curie, Examinateur Mme. Sylvie PESTY
Professeur, Université Pierre Mendès-France, Président M. James L. CROWLEY
Professeur, Institut Polytechnique de Grenoble, Directeur de thèse M. Augustin LUX
Professeur, Institut Polytechnique de Grenoble, Co-Directeur de thèse
Université Joseph Fourier / Université Pierre Mendès France / Université Stendhal / Université de Savoie / Grenoble INP
A B S T R A C T
In this thesis we focus on the development of methods and techniques to infer affect from visual information. We focus on facial expression analy-sis since the face is one of the least occluded parts of the body and facial expressions are one of the most visible manifestations of affect. We ex-plore the different psychological theories on affect and emotion, different ways to represent and classify emotions and the relationship between fa-cial expressions and underlying emotions.
We present the use of multiscale Gaussian derivatives as an image de-scriptor for head pose estimation, smile detection before using it for affect sensing. Principal Component Analysis is used for dimensionality reduc-tion while Support Vector Machines are used for classificareduc-tion and regres-sion. We are able to employ the same, simple and effective architecture for head pose estimation, smile detection and affect sensing. We also demon-strate that not only do multiscale Gaussian derivatives perform better than the popular Gabor Filters but are also computationally less expensive to compute.
While performing these experiments we discovered that multiscale Gaus-sian derivatives do not provide an appropriately discriminative image de-scription when the face is only partly illuminated. We overcome this prob-lem by combining Gaussian derivatives with Local Binary Pattern (LBP) histograms. This combination helps us achieve state-of-the-art results for smile detection on the benchmark GENKI database which contains im-ages of people in the "wild" collected from the internet. We use the same description method for face recognition on the CMU-PIE database and the challenging extended YaleB database and our results compare well with the state-of-the-art. In the case of face recognition we use metric learning for classification, adopting the Minkowski distance as the similarity mea-sure. We find that L1 and L2 norms are not always the optimum distance metrics and the optimum is often an Lpnorm where p is not an integer.
Lastly we develop a multi-modal system for depression estimation with audio and video information as input. We use Local Binary Patterns -Three Orthogonal Planes (LBP-TOP) features to capture intra-facial move-ments in the videos and dense trajectories for macro movemove-ments such as the movement of the head and shoulders. These video features along with Low Level Descriptor (LLD) audio features are encoded using Fisher Vec-tors and finally a Support Vector Machine is used for regression. We dis-cover that the LBP-TOP features encoded with Fisher Vectors alone are enough to outperform the baseline method on the Audio Visual Emotion
Challenge (AVEC) 2014 database. We thereby present an effective tech-nique for depression estimation which can be easily extended for other slowly varying aspects of emotions such as mood.
Keywords: Affect Sensing, Facial Image Analysis, Automated Facial Expression Analysis.
R É S U M E
Cette thèse a pour sujet le développement de méthodes et de techniques permettant d’inférer l’état affectif d’une personne à partir d’informations visuelles. Plus précisement, nous nous intéressons à l’analyse d’expressions du visage, puisque le visage est la partie la mieux visible du corps, et que l’expression du visage est la manifestation la plus évidente de l’affect. Nous étudions différentes théories psychologiques concernant affect et émotions, et différentes facons de représenter et de classifier les émotions d’une part et la relation entre expression du visage et émotion sousjacente d’autre part.
Nous présentons les dérivées Gaussiennes multi-échelle en tant que de-scripteur dÃmages pour l’estimation de la pose de la tête, pour la dé-tection de sourire, puis aussi pour la mesure de l’affect. Nous utilisons l’analyse en composantes principales pour la réduction de la dimensional-ité, et les machines à support de vecteur pour la classification et la regres-sion. Nous appliquons cette même architecture, simple et efficace, aux différents problèmes que sont l’estimation de la pose de tête, la détection de sourire, et la mesure d’affect. Nous montrons que non seulement les dérivées Gaussiennes multi-échelle ont une performance supérieure aux populaires filtres de Gabor, mais qu’elles sont également moins coûteuses en calculs.
Lors de nos expérimentations nous avons constaté que dans le cas d’un éclairage partiel du visage les dérivées Gaussiennes multi-échelle ne four-nissent pas une description d’image suffisamment discriminante. Pour ré-soudre ce problème nous combinons des dérivées Gaussiennes avec des histogrammes locaux de type LBP (Local Binary Pattern). Avec cette com-binaison nous obtenons des résultats à la hauteur de l’état de l’art pour la détection de sourire dans le base d’images GENKI qui comporte des im-ages de personnes trouvées "dans la nature" sur internet, et avec la difficile "extended YaleB database". Pour la classification dans la reconnaissance de visage nous utilisons un apprentissage métrique avec comme mesure de similarité une distance de Minkowski. Nous obtenons le résultat que les normes L1 and L2ne fournissent pas toujours la distance optimale; cet optimum est souvent obtenu avec une norme Lpoù P n’est pas entier.
Finalement, nous développons un système multi-modal pour la détec-tion de dépressions nerveuses, avec en entrée des informadétec-tions audio et vidéo. Pour la détection de mouvements intra-faciaux dans les données vidéo nous utilisons de descripteurs de type LBP-TOP (Local Binary Pat-terns -Three Orthogonal Planes), alors que nous utilisons des trajectoires
denses pour les mouvements plus globaux, par exemple de la tête ou des épaules. Nous avons trouvé que les descripteurs LBP-TOP encodés avec des vecteurs de Fisher suffisent pour dépasser la performance de la méthode de reférence dans la compétition "Audio Visual Emotion Chal-lenge (AVEC) 2014". Nous disposons donc d’une technique effective pour l’evaluation de l’état dépressif, technique qui peut aisement être éten-due à d’autres formes d’émotions qui varient lentement, comme l’humeur (mood an Anglais).
Mots-clés: Perception de l’état affectif, Analyse d’image du visage, Re-connaissance d’expression du visage.
P U B L I C AT I O N S
Related Publications
[1] V. Jain, J.L. Crowley. Smile Detection Using Multi-scale Gaussian Derivatives. 12th WSEAS International Conference on Signal Processing, Robotics and Automation, 2013.
[2] V. Jain, J.L. Crowley. Head Pose Estimation Using Multi-scale Gaussian Derivatives. Scandinavian Conference On Image Analysis 2013.
[3] V. Jain, J.L. Crowley, A. Lux. Facial Expression Analysis And The PAD Space. 11th Pattern Recognition and Image Analysis, 2013.
[4] V. Jain, J.L. Crowley, A. Lux. Local Binary Patterns Calculated Over Gaussian Derivative Images. International Conference on Pattern Recognition, 2014.
[5] V. Jain, J.L. Crowley, A.K. Dey, A. Lux. Depression Estimation Us-ing Audiovisual Features and Fisher Vector EncodUs-ing. 4th Audio Visual Emotion Challenge Workshop, 2014.
A C K N O W L E D G M E N T S
First and foremost, I would like to thank my supervisors Prof. Crowley and Prof. Lux for holding my hand through this long and rather ardu-ous journey. Apart from the inspiration and support they provided in the course of this research, they also provided me with generous resources for conducting this research. I am also grateful to the members of the jury: Prof. André, Prof. Devillers, Prof. Pesty and Prof. Chetouani for tak-ing time out from their busy schedules and participattak-ing in the defense of this thesis.
I take this opportunity to thank the wonderful people I met at Carnegie Mellon University, where I was fortunate enough to spend six months as a visiting researcher. I had the chance to collaborate with some of the smartest people I have ever met including Prof. Dey, Nikola, Julian, Jin-Hyuk and Chandrayee.
I should also thank all the people in PRIMA for the cordial atmosphere in the team. I especially appreciate all the help and company provided by Catherine, Etienne, Claudine, Doms, Remi, Sergi and Thierry. It was a pleasure to be in the company of such warm and talented people. There was never a dearth of ideas for research and never a problem that they could not solve.
Finally, I must thank the people without which none of this would have been possible, my mother, little brother Nishant, my dad, grandparents, my friends from Dehradun and the little witty bear from Finland.
Varun Jain
C O N T E N T S
1 I N T R O D U C T I O N 1
1.1 Problem addressed in the thesis 1 1.2 Approach adopted 2
1.3 Methodology adopted 3 1.4 Insights 4
1.5 Thesis Summary 6 2 H U M A N E M O T I O N S 11
2.1 Feedback Theories on Emotion 11
2.2 Basic Emotions vs. dimensional theories of affect 12 2.2.1 Basic Emotions 13
2.2.2 Dimensional Theories of Emotions 14 2.2.3 Plutchik’s theory 15
2.3 Facial Expressions and the Facial Action Coding System 17 2.4 Mood 18
2.5 Depression 20 2.6 Conclusion 21
3 S TAT I C I M A G E A N A LY S I S F O R S E N S I N G A F F E C T 23 3.1 Image description methods for still images 23
3.1.1 Steerable filter methods 23 3.1.2 Local Binary Patterns 26 3.2 Machine Learning methods 28
3.2.1 Dimensionality reduction and Principal Component Analysis 28
3.2.2 Kernel Methods and the Support Vector Machine 29 3.2.3 K-Nearest Neighbors method 30
3.3 Experiments 31
3.3.1 Head Pose Estimation 31 3.3.2 Smile Detection 36 3.3.3 Affect Sensing 44 3.3.4 Face Recognition 52 3.4 Conclusion and summary 55
4 V I D E O A N A LY S I S F O R S E N S I N G A F F E C T 57 4.1 Methods for video description 57
4.1.1 Local Binary Patterns-Three Orthogonal Planes 57 4.1.2 Dense Trajectories 58
4.1.3 Space Time Interest Points 60 4.2 Encoding Techniques 60
4.2.1 Bag of Visual Words 61 4.2.2 Sparse Coding 62
xiv C O N T E N T S
4.2.3 Fisher Vector Encoding 63 4.3 Experiments 63
4.3.1 Facial Expression Recognition 63
4.3.2 Audio Visual Emotion Challenge 2014 Depression sub-challenge 66
4.4 Conclusion 72 5 C O N C L U S I O N 75
5.1 Lessons learned 77
5.2 Impact of the present work 78 5.3 Future scope of this work 79
L I S T O F F I G U R E S
Figure 1 General architecture adopted 2 Figure 2 Circumplex model of emotions 14 Figure 3 Plutchik’s wheel of emotions 16 Figure 4 Plutchik’s cone of emotions 16
Figure 5 Shift in emotional response due to mood 19 Figure 6 Computing LBP response from a pixel’s local
neigh-bourhood. 27
Figure 7 LBP Histogram computation 27
Figure 8 SVM classifying linearly separable data 29 Figure 9 SVM with data mapped to a higher dimensional
space using kernel 30
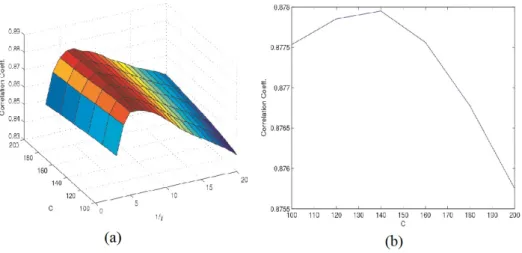
Figure 10 A small sequence from the Pointing04 dataset. 32 Figure 11 How the Pointing04 database was collected 32 Figure 12 (a) Graph of Correlation Coeff. vs. C-parameter and 1/γ for pan and (b) Graph of Correlation Co-eff. vs. C-parameter at 1/γ = 11 for pan 33 Figure 13 (a) Graph of Correlation Coeff. vs. C-parameter
and 1/γ for tilt and (b) Graph of Correlation Co-eff. vs. C-parameter at 1/γ = 6 for tilt 33 Figure 14 Schematic of our approach. 35
Figure 15 (a) Pan=-15, Tilt=-15 and (b) Pan=0, Tilt=0 were predicted using our approach 36
Figure 16 Examples of (top two rows) real-life smile faces and (bottom two rows) nonsmile faces, from the GENKI-4K database. 37
Figure 17 Imagette divided into cells of 4 X 4 pixels 38 Figure 18 (a) Graph of classification accuracy vs. C-parameter
and 1/γ and (b) Graph of accuracy vs. C-parameter at 1/γ = 81 38
Figure 19 ROC curve for our smile detector 39
Figure 20 Smile intensity using probability estimates 40 Figure 21 Schematic of our approach 40
Figure 22 Examples from the GENKI-4K database illustrat-ing the illumination problems 40
Figure 23 Creating the features: a) original image, b) Gaus-sian derivative images, and c) concatenation of re-sulting histograms after applying LBP. 41
Figure 24 Accuracy(%) of different descriptors over the GENKI-4K database 42
Figure 25 BER of different descriptors over the GENKI-4K database 43
Figure 26 Proportion of images with different pose 43 Figure 27 Accuracy with different poses 44
Figure 28 Example Images from the FEED dataset 46 Figure 29 Example Images from the CK database 47 Figure 30 Basic emotions in the affect space 47
Figure 31 (a) Graph of classification accuracy vs. C-parameter and 1/γ for pleasure and (b) Graph of accuracy vs. C-parameter at 1/γ = 190 for pleasure 48 Figure 32 (a) Graph of classification accuracy vs. C-parameter
and 1/γ for arousal and (b) Graph of accuracy vs. C-parameter at 1/γ = 280 for arousal 49 Figure 33 Schematic of our approach 49
Figure 34 ROC of the classifier for Pleasure 49 Figure 35 ROC of the classifier for Arousal 50 Figure 36 Comparison of results 50
Figure 37 Results on the FEED database 51
Figure 38 Sample images from the CMU-PIE database show-ing the different lightshow-ing conditions 53
Figure 39 Recognition rate with different reference images 53 Figure 40 Sample images from the extended YaleB database
showing the different lighting conditions 54 Figure 41 LBP-TOP histogram computation 58
Figure 42 LBP-TOP computation for facial images 58 Figure 43 LBP-TOP histogram concatenation for facial
im-ages 59
Figure 44 Dense Trajectory computation 60 Figure 45 K-means and codebook generation 61
Figure 46 LBP-TOP computed over Gaussian derivative im-ages 65
Figure 47 System Architecture 70
List of Tables xvii
Figure 48 Root Mean Square Error (RMSE) vs. number of clusters 71
L I S T O F TA B L E S
Table 1 Basic Emotions in the PAD space 15 Table 2 AU’s associated with basic emotions 18
Table 3 Our MEA as compared with the state-of-the-art 34 Table 4 Our accuracy over discrete poses as compared with
the state-of-the-art 34
Table 5 Confusion Matrix for Pan, true values are in the first column, predicted values in the first row 34 Table 6 Confusion Matrix for Tilt, true values are in the
first column, predicted values in the first row 35 Table 7 Comparison of prediction time with and without
using PCA 35
Table 8 Our accuracy using Multi-scale Gaussian Deriva-tives (MGD) compared with the accuracy obtained using Gabor Energy Filters (GEF) 39
Table 9 Comparison of prediction time with and without using PCA 39
Table 10 Confusion matrix for 2 class classification 42 Table 11 Labels for the 6 basic emotions 48
Table 12 Comparison of time required for calculating the two types of features 51
Table 13 Comparison of prediction time with and without using PCA 51
Table 14 Comparison of prediction time 51
Table 15 Maximum and average accuracy attained by dif-ferent methods 54
Table 16 Accuracy(%) over the 4 subsets using different meth-ods 55
Table 17 Accuracy(%) over the 4 subsets using Gaussian derivatives, LBP and their proposed combination 55 Table 18 Our accuracy compared to the accuracy obtained
using conventional LBP-TOP features 66 Table 19 Errors for different combinations of descriptors on
xviii List of Tables
Table 20 Mean Absolute Error (MAE) and Root Mean Square Error (RMSE) for different encoding techniques 71 Table 21 Errors for different sizes of time slice 71
1
I N T R O D U C T I O N
The transition of computing environments from being computer-centered to being human-centered requires a major transformation in how humans interact with computers. The human-centered computing paradigm entails that the interaction between humans and computers should be natural and similar to human social interaction. Effective human social interactions pivots on the successful interpretation of a variety of nonverbal commu-nicative cues such as facial expressions, body language, gestures, postures among other things. The ability to correctly perceive and interpret these nonverbal cues is often associated with emotional intelligence. In the fu-ture the "naturalness" and ease of human-machine interaction will depend on how well machines would be able to observe and interpret these pre-viously mentioned nonverbal cues. A context-aware system which could adapt to its user’s needs by inferring the affective state of a person would make human-machine interaction more convenient for the user, reduce the cognitive load and make the interaction more intuitive.
A logical step towards the development of an efficient, naturalistic and context-aware human-machine interaction system would be to build tech-nologies to automate the inference of the affective state of a person [13]. 1.1 P R O B L E M A D D R E S S E D I N T H E T H E S I S
In this thesis we investigate the use of computer vision and machine learn-ing techniques for inferrlearn-ing the affective state of a person. An affective state is psycho-physiological construct i.e. it has both psychological and physiological components to it and is a result of a humans’ interaction with stimuli. The affective state is manifested in a variety of physiologi-cal signals: facial expressions, vophysiologi-cal prosody, heart rate variability, blood volume pulse, galvanic skin response among others.
Facial expressions and gestures play a vital role in social interaction. The face is one of the most visible and least occluded parts of the body. For effective human-computer interaction it is important that computers be equipped with the ability to recognize facial expressions and possi-bly infer the underlying affective state. Therefore our aim has been to develop techniques for the extraction of visual information from images and videos and for the inference of the affective state using this visual information.
2 I N T R O D U C T I O N
1.2 A P P R O A C H A D O P T E D
We adopt a global appearance-based approach for capturing visual in-formation from the facial region. Alternative approaches for facial im-age analysis include facial keypoint tracking methods [67,66] and facial model fitting techniques such as Active Appearance Models (AAM) [18] and Active Shape Models (ASM) [17]. A major advantage that appear-ance based approaches have over model fitting based approaches is that they are computationally less expensive. Keypoint detectors and trackers on the other hand are prone to detection failures and initialization prob-lems. Architectures employing global image appearance techniques can easily be adapted for versatile applications as we demonstrate in this the-sis. An architecture developed for a task such as a head pose estimation can easily adapted for another task such as smile detection keeping the general structure intact.
Figure 1: General architecture adopted
A simplified architecture for an appearance based system for facial im-age analysis is shown in figure 1. The input is in the form of an image or a video. In the next step the face is located, this is commonly done using the Viola-Jones face detector [111]. Additionally, facial landmarks such as the eyes and the nose are located. The region of interest contain-ing the face is then normalized followed by descriptor calculation over the normalized image. Image features are often concatenated to produce a feature vector which may be reduced in dimensions using feature selec-tion techniques or dimensionality reducselec-tion techniques such as principal component analysis (PCA) [55]. PCA is a statistical technique for project-ing possibly correlated data to a new coordinate system such that the first coordinate accounts for the highest variance, the second coordinate has the second highest variance and so on.
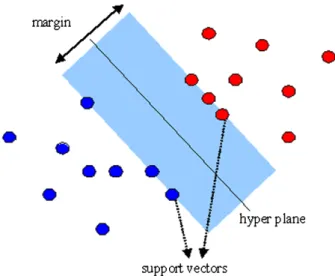
The final step involves the use of a discrimination or regression method to produce the predicted label or values. Support Vector Machine (SVM) [109, 19] is a popular maximum margin classifier that handles the prob-lem of linearly non-separable classes by projecting the data into a higher dimensional space using the kernel trick which entails the implicit projec-tion of inner products onto a higher dimensional space. The radial basis kernel is the most widely used kernel in the machine learning community.
1.3 M E T H O D O L O G Y A D O P T E D 3
1.3 M E T H O D O L O G Y A D O P T E D
In our experiments we use the OpenCV implementation of the Viola-Jones face detector for locating the face in images and videos but we do not use any form of facial landmark detection and the normalization step only consists of transforming the facial region into an image of fixed size using translation and scaling.
Gaussian derivatives have long been used for a wide variety of appli-cations such as object recognition [124, 94], age estimation [44], image tracking [106,120]. We explore the use of multiscale Gaussian derivatives [20,69] for scale invariant image description in our experiments on head pose estimation, smile detection and affect sensing. Multiscale Gaussian derivatives have been shown to efficiently describe image neighborhood appearance and techniques such as the half-octave Gaussian pyramid [22] provide a cost effective way to compute the derivatives.
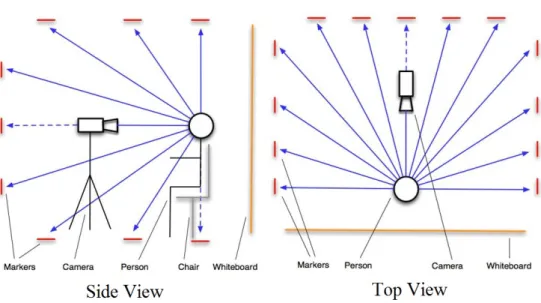
We test our approach for head pose estimation [48] on the Pointing04 [39] and CMU-PIE [102] databases. The Pointing04 database contains images of 15 subjects in 93 different head poses with images having been col-lected by asking the subjects to look at markers placed in a room. Using PCA for dimensionality reduction and SVMs for classification we com-pare our results to the state-of-the-art. The SVM classifier is replaced by a SVM regressor and the approach is tested for continuous poses.
For smile detection we test our approach [50] on the GENKI-4K [118] database containing 4000 images of people collected from the web. Nearly half the images contain a smiling person while the rest contain in a person with any other expression except for smile. As with our experiments on head pose estimation, we use PCA for dimensionality reduction and SVM for classification. The classifier trained on the GENKI data is also used for smile intensity estimation on image sequences from the Cohn-Kanade database [59].
The Cohn-Kanade and FEED [113] databases contain image sequences of subjects displaying Ekman’s six basic emotions. The Cohn-Kanade database contains posed data while the FEED database contains sponta-neous expressions. Instead of trying to recognize the six basic emotions, we map the six basic emotions to a 2D affect space and relabel the data. Using the exact same architecture as the one used for smile detection, we compare our results with results produced using Gabor Filters [49].
We also formulate a new descriptor using a combination of Gaussian derivatives and Local Binary Patterns (LBP) [81, 82]. Local Binary Pat-tern features are powerful yet simple to compute descriptors for image texture analysis. They have been used in a rich variety of applications such as face and gender recognition [123,79,98], human action recogni-tion [60], lip reading [129] and moving-object detection [42,43]. In our
4 I N T R O D U C T I O N
experiments on smile detection and face recognition we calculate Gaus-sian derivatives of five orders : Ix, Iy, Ixx, Iyy and Ixyand then calculate
Local Binary Patterns over the derivative images.
We re-perform our experiments on smile detection using the new de-scriptor and also investigate the effect of head-pose in smile detection [51]. Apart from accuracy we use the balanced error rate (BER) metric to compare our results with other methods such as Gabor filters and LBP features calculated over Gabor derivative images.
Using the same combination of Gaussian derivatives and LBP features, we conduct experiments for face recognition. We test our approach on the CMU-PIE and the YaleB [37] extended database. Both these databases contain facial images under a variety of lighting conditions and poses. Employing very simple 1-nearest neighbor method for assigning identity to test images we compare our results with the state-of-the-art which in-cludes descriptors which are explicitly developed for face recognition and handle illumination explicitly.
We combine Local Binary Patterns-Three Orthogonal Planes (LBP-TOP) features [128] with Gaussian derivatives by computing LBP-TOP features over Gaussian derivative image sequences. We use the same five deriva-tives that we use in our experiments on smile detection and face recogni-tion. The new descriptor is tested on the image sequences from the Cohn-Kanade dataset. The dimensionality of the feature vectors is very high in comparison to the number of observations, therefore a linear SVM is used for classification. The recognition accuracy is compared with the accuracy obtained using standard LBP-TOP features.
We use dense trajectory features developed by [116] for capturing macro level movements in the videos of the Audio Visual Emotion Challenge (AVEC) 2014 database while LBP-TOP features are used to capture the dynamic texture of the facial region [52]. Since the videos are of different durations and for the Depression Sub-challenge a complete video has one Beck-II inventory score [9] for depression, the descriptor information has to be encoded to a feature vector of set size. We perform feature encoding over the visual features extracted using dense trajectories and LBP-TOP features and the precomputed audio LLD features using Fisher Vectors [92]. The depression severity is estimated using a linear Support Vector Machine regressor.
1.4 I N S I G H T S
Head pose estimation
We find that even though the Pointing04 database contains discrete head poses, if the SVM classifiers are replaced by SVM regressors, we attain
1.4 I N S I G H T S 5
high correlation between the predicted values and the ground truth. These findings indicate that continuous head pose estimation can be performed even when the training data contains purely discrete head poses.
Smile detection
Support Vector Machines produce a probability estimate of the prediction made. The SVM classifier trained on the GENKI-4K smile database is cross-tested on the image sequences of "happiness" in the Cohn-Kanade database [59] and it is found that the probability estimates represent smile intensity.
Gaussian derivatives and Illumination
It has been discovered that images in the GENKI-4K database with ex-treme lighting conditions are often misclassified. The combination of LBP features and Gaussian derivatives reduces this problem leading to a higher accuracy over the database. The use of Gaussian derivatives with LBP fea-tures also provides more invariance to pose as compared to standard LBP features.
Minkowski Distance
In the experiments on face recognition we observe that varying the dis-tance metric in 1-nearest neighbor classification improves the accuracy i.e. instead of using a fixed metric such as L1 or L2, if a generalized
met-ric Lp is used with p chosen through cross validation, we can achieve
higher accuracy.
LBP-TOP features calculated over Gaussian derivatives
Using a combination of Gaussian derivatives and LBP-TOP features we obtain a slightly better accuracy at expression recognition than the ac-curacy with standard LBP-TOP features, however the feature vector pro-duced by our method is five times the size of the feature vector obtained using LBP-TOP features. The trade-off for a marginal increase in accu-racy is longer prediction time and higher cost of feature computation. Early fusion of features in depression estimation
In our experiments on the AVEC 2014 database, we use an early fusion scheme for combining features and it is found that LBP-TOP features
6 I N T R O D U C T I O N
contribute most to depression estimation. The predicted values using just LBP-TOP features outperform the baseline. If the challenge database had more observations, late fusion might have been feasible which could have changed the contribution of the three descriptors, LBP-TOP, dense trajec-tories and audio LLD features, to depression estimation.
1.5 T H E S I S S U M M A R Y
Chapter 2
Chapter2presents theories on emotion and emotion classification along with a discussion on mood and depression. The first theories on emo-tion presented in this chapter fall under the category of phenomena based theories. These theories focus on the physiological side to emotions and posit that emotional experience is secondary to physiological changes pro-duced when an organism is presented with stimuli. James-Lange’s feed-back theory[53,63] and theories in opposition to his theory are presented. This initial discussion provides a glimpse of the evolution of human un-derstanding of emotions.
The concepts following the discussion on early theories of emotion in chapter 2 are more relevant to the domain of affective computing and have been put to use in later chapters. Paul Ekman, inspired by Darwin’s belief that some emotions may be more primitive and basic than others, conducted a series of studies in the 1970’s which led him to postulate that six emotions [29, 28] : happiness, sadness, disgust, fear, anger and surprise are not only basic and primary but are also expressed universally across different cultures with the same facial display rules.
A large section of psychologists working on emotions do not agree with the concept of some emotions being more basic or primitive than oth-ers. They argue that all emotions are produced by the same neurological system and processes and therefore all emotions are on a level playing field. Russell and Mehrabian presented a circumplex model of emotions [90] where most human emotions can be represented in a 2D space with one dimension representing the positivity and negativity of the emotion while the other dimension stands for how activated or sleepy the person is. There is not enough consensus on the third dimension but there are emotions which need a third dimension to differentiate themselves from other emotions [91].
Plutchik’s model of emotions [87], although failed to find favor with the psychological community, draws a parallel between colors and emotions. His "wheel" of emotions contains eight basic emotions which mix with each other to produce emotional compounds. The cone model proposed by him has a vertical axis that stands for intensity of emotion; the hue
1.5 T H E S I S S U M M A R Y 7
axis in the HSV (hue-saturation-value) color space has an analogous in his model in the form of a similarity/dissimilarity axis i.e. emotions similar to each other are adjacent while the emotions which are the most dissimilar are placed diametrically opposite.
Chapter2 also contains a section on mood. Mood is an affective state like emotion but is more longer lasting and has a less intense emotional experience than emotions. Mood can influence emotional response and Picard [86] has hypothesized a model to link emotions with mood and temperament. A persistent bad mood can be a sign of depression.
Depression is a serious mental illness and depression intensity is often measured using the Beck-II [9] self-report inventory. The Beck-II inven-tory is the most popular scale adopted by psychologists to quantify depres-sion severity. However self-reports may not be the best way to appraise depression severity.
Chapter 3
Chapter3presents our experiments on static image data for sensing affect. We develop an architecture that is applicable for head pose estimation, smile detection and affect sensing using multiscale Gaussian derivatives for image description, principal component analysis for dimensionality reduction and Support Vector Machines for classification or regression. Our results on head pose estimation are better than the state-of-the-art results reported for global appearance based methods.
Experiments on smile detection are performed on the GENKI-4K database containing images collected from the "wild" unlike other smile databases which contain images collected in controlled environments. The SVM classifier trained on Gaussian derivative features calculated on the GENKI database is shown to perform better than the SVM classifier trained on Ga-bor features. Our smile detector is tested on the image sequences in the Cohn-Kanade database and it is found that the probability estimates pro-duced by the SVM classifier reflect smile intensity. It is observed that our smile detector fails to detect smile correctly when the face is partially illu-minated. Leveraging the illumination-invariant property of Local Binary Patterns, we develop a novel descriptor which is constructed by comput-ing LBP features over Gaussian derivative images.
In case of smile detection with the new descriptor we achieve better results than the ones obtained using LBP features and Gaussian derivative features alone. Additionally we compare our results with Gabor features and LBP features computed over Gabor features. Our method performs better than all the other techniques. It is also noted that our descriptor is the most invariant to head pose.
8 I N T R O D U C T I O N
Cohn-Kanade and FEED [113] databases contain image sequences of subjects experiencing or pretending to experience the six basic Ekman emotions. Mapping these emotions to the 2D affect space, we relabel the databases with affect labels. We employ the same architecture that we developed for head pose estimation and smile detection and compare our results to the results obtained using the technique presented in [23]. Not only do we obtain a higher accuracy but our descriptor takes less time to compute and our feature vector is smaller in size as well.
In the final experiment of chapter 3, the descriptor developed by com-bining Gaussian derivatives and LBP features is employed for face recog-nition. Simple 1-nearest neighbor classification with Minkowski distance as the distance metric is used for assigning identity to test images. We outperform the state-of-the-art on the CMU-PIE database and the per-formance on the YaleB database is at par with the state of the art. It is worthwhile to note that the state-of-the-art includes descriptors developed exclusively for face recognition and handle illumination explicitly while our method, using a very simple classification technique, performs bet-ter than other methods which employ much more complex discrimination techniques.
Chapter 4
Chapter 4 contains two set of experiments on affect sensing in videos. The first set of experiments is motivated by our success with the combina-tion of Gaussian derivatives and LBP features. In chapter4, we propose a novel descriptor created by computing LBP-TOP features over image sequences composed of Gaussian derivative images. It can be considered as an extension of our descriptor from chapter 3to the temporal domain for capturing dynamic texture. The descriptor is tested on the image se-quences in the Cohn-Kanade database. We obtain marginally better re-sults than the ones obtained using the conventional LBP-TOP descriptor but because we use image sequences of Gaussian derivative images of five different orders instead of the original image sequence, our concatenated histogram’s size is five times the size of the histogram generated using standard LBP-TOP features.
The second set of experiments in chapter 4 involve the development of a new technique for depression intensity estimation. The AVEC 2014 database [107] contains videos of different durations of subjects experi-encing symptoms of depression and the ground truth for the Depression Sub-challenge (DSC) consists of Beck-II inventory scores which repre-sent the severity of depression. We capture video features using two de-scriptors: LBP-TOP features to capture micro-movements such as intra-facial movements and the dynamic texture of the intra-facial region and dense
1.5 T H E S I S S U M M A R Y 9
trajectories for capturing macro movements such as head movements. These video features along with the precomputed audio Low level descriptor (LLD) features are encoded using fisher vectors. The encoding is nec-essary since videos can be of different durations and whole videos are associated with a unique score. The encoded features are passed to a Sup-port Vector Regressor to obtain the predicted depression intensity. This technique developed for estimating depression intensity should also be applicable for other slowly varying affective states.
Chapter 5
Chapter5 is the final chapter of the thesis. The chapter contains a brief summary of chapters2-4 followed by a section highlighting the lessons learned from our experiments. A section is dedicated to the presentation of the probable contributions of the present work to the domain of affective computing. The chapter ends with some ideas on how the current work could be extended.
2
H U M A N E M O T I O N S
This chapter summarizes different conceptions associated with emotions. A large part of the discussion is dedicated to the different theories and concepts of emotion representation.
Early psychologists studying emotions concentrated on understanding the processes behind emotion elicitation. Focusing on the physiological aspect of emotions, these psychologists believed that the emotional expe-rience occurs after the physiological reaction to external stimulus. Such theories of emotion fall under the category of phenomena based theories [103]. A brief discussion on these theories is provided in section2.1.
Models of emotion that are more relevant to affective computing and human-computer interaction described in section 2.2 can be broadly di-vided in two categories: one conception suggests that some emotions are more fundamental as compared to others and this primary set of emotions is common throughout cultures and races. The other category of theories posit that emotions can be represented in a continuous dimensional space. A major point of disagreement between the two conceptions is that pro-ponents of basic (primary) emotions believe that different emotions arise from separate neural systems while the advocates of dimensional theories are of the opinion that a common and interconnected neurophysiological system is responsible for all affective states. The most popular taxonomy for describing human facial movements according to their appearance is discussed in section2.3.
In sections2.4and2.5we describe mood as an emotional phenomenon distinct from emotions and plays the role of a background process in emo-tion elicitaemo-tion. Apart from the descripemo-tion of depression secemo-tion2.5 also provides a brief description of the BDI-II inventory which is the most commonly used scale for quantifying depression in humans.
2.1 F E E D B A C K T H E O R I E S O N E M O T I O N
The first feedback theory on emotion was proposed by the American philosopher and psychologist William James [53] and Carl Lange [63] a Danish physician, almost at the same time in the 19th century. The James-Lange theory posits that emotion is secondary to physiological responses which in turn are caused by a stimulus. In other words the theory postu-lates that bodily changes are the primary feelings and are not the result but a necessary precursor to felt emotions. The theory was challenged by
12 H U M A N E M O T I O N S
Walter Cannon and he proposed an alternative theory known to us as the Cannon-Bard theory [12].
The Cannon-Bard theory is based on Cannon’s understanding of tha-lamic processes. Cannon and Bard conducted studies on animal physiol-ogy. Through these experiments they theorized the role of the brain in the synthesis of physiological responses and emotions. According to their theory, a stimulus causes impulses to travel to the cortex which in turn ac-tivates the thalamic processes. Once the thalamic processes are activated they are ready to discharge. When this discharge occurs the physiological response and the emotional experience occur simultaneously but indepen-dently. This point in Cannon-Bard’s theory is in direct opposition with the James-Lange theory which states that physiological responses occur before the emotional experience.
A new form of feedback theory titled "Facial Feedback Hypotheses" was proposed by McIntosh in 1996 [74] presenting a new relation between the face and emotions. McIntosh raises four questions in his discussion on the hypotheses:
1. Do Facial Actions Correspond to Emotions? 2. Does Facial Movement Modulate Emotions? 3. Can Facial Action Initiate Emotions?
4. Are Facial Actions Necessary for Emotions?
McIntosh’s theory is at odds with the James-Lang theory. He hypothe-sized that facial expressions and not visceral changes could be a possible factor in emotion elicitation.
At the moment the scientific community does not agree on whether bod-ily feedback is sufficient or even necessary in the elicitation processes of emotions. This lack of consensus on feedback theories and their insuffi-cient explanation of emotion elicitation prompts us to investigate alternate theories to conceptualize emotions.
2.2 B A S I C E M O T I O N S V S. D I M E N S I O N A L T H E O R I E S O F A F
-F E C T
There are two viewpoints on the classification of emotions. The first is that emotions are discrete and fundamentally different constructs while the second viewpoint asserts that emotions can be represented using continu-ous dimensional models. Lang [11] has shown that self-reports of emotion across subjects are more reliable with respect to dimensions than with re-spect to discrete emotion categories. There are also ways to map basic emotions to multi-dimensional affect spaces as we will discuss later.
2.2 B A S I C E M O T I O N S V S. D I M E N S I O N A L T H E O R I E S O F A F F E C T 13
Among the proponents of the discrete emotion theory, there are two distinguishable beliefs underlying the assumption that emotions can be divided into categories of primary (basic) and secondary emotions [84]. From the psychological perspective basic emotions are held to be the ba-sic building blocks of secondary emotions while from the biological view-point there is a belief that there could be neurophysiological and anatom-ical substrates corresponding to the basic emotions.
Picard [86] believes that the representation of emotions as discrete cat-egories or as continuous dimensions is a matter of choice much like light which can be described using wave and particle theories, the choice of theory depends on what is being tried to explained. Similarly colors can be described in terms of their component RGB values or by their names, the choice depends on the application.
2.2.1 Basic Emotions
Charles Darwin in his book "The Expressions of the Emotions in Man and Animals" first postulated the theory that emotions are universal. Darwin believed that emotion had an evolutionary history that could be traced across cultures and species. A number of researchers since then, promi-nently Ekman and Friesen [29], through their studies found that certain emotions are expressed via the same facial actions across cultures. Ek-man’s research challenged the popular belief that emotions expressed by the face are cultural specific and governed by behavioral-learning pro-cesses.
Although there are several definitions for basic emotions, the most widely used definition is the one by Ekman [28] who supports the view that not only are the six emotions: joy, sadness, anger, disgust, fear and surprise universal but also basic. Basic or fundamental emotions are defined as bio-logically primitive, measurable, physiobio-logically distinct and "irreducible constituents of other emotions" [84] as opposed to secondary emotions which can be reduced to a sum of basic emotions. In [54] the authors sug-gest that a large number of words in the English vocabulary describing emotions can be based on one or more of the five basic emotions: fear, anger, sadness, happiness and disgust.
From the affective computing perspective, the debate on the existence of basic and secondary emotions is not as important as the question whether we are better of representing emotions as discrete categories or otherwise?
14 H U M A N E M O T I O N S
2.2.2 Dimensional Theories of Emotions
Several theories exist for defining emotions in a continuous space. Most theorists agree on three dimensions out of which two dimensions are agreed to be "arousal" (excited vs. sleepy) and "valence" (positive vs. negative). Wundt [88] believed that the third dimension should represent strain vs. relaxation while Schlosberg [95] believes that it should be atten-tion vs. rejecatten-tion.
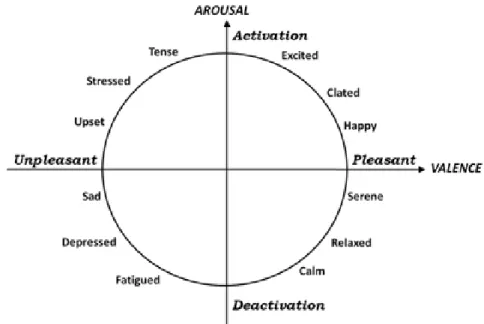
The most commonly used continuous model for emotions used in the affective computing community is the circumplex model [90] introduced by Russell. This model represents emotions in a two-dimensional circu-lar space with two dimensions: arousal and valence. The vertical axis is arousal while the horizontal axis is valence. The center of the circle repre-sents a neutral valence and a medium level of arousal.
Figure 2: Circumplex model of emotions
The problem with the circumplex model arises when one is asked to examine the difference between "anger" and "fear" in the 2D circumplex space since both the emotion words would be represented by high unpleas-antness and high levels of arousal. A third dimension is required to dis-criminate between these two emotions which the authors in [91] call dom-inance. With the use of this third dimension: dominance, anger and fear become distinguishable because anger ranks high in dominance whereas fear is submissive placing it at the other end of the dominant-submissive spectrum.
In the same paper [91] the authors present a table of emotion words along with their corresponding co-ordinates in the 3D PAD (Pleasure, Arousal and Dominance) space. In this table of emotion words, one can find the six basic emotions and their corresponding values in the 3D space.
2.2 B A S I C E M O T I O N S V S. D I M E N S I O N A L T H E O R I E S O F A F F E C T 15
However using these co-ordinates is not very easy since they are only mean values of a distribution pattern and have a high standard deviation associated with them essentially making each emotional word a multi-variate Gaussian distribution in the PAD space. Also, the authors of [91] have noted that the dimension of dominance has a high correlation with the other two dimensions, raising the question: "Could we find a third dimension that is more orthogonal to the other dimensions?".
In this thesis we only used the polarity of each of the six basic emotions in the circumplex space to re-label the data, which was labeled for basic emotions, with pleasure-arousal labels. For example, the emotional word "Happy" has a mean pleasure value of 0.81 and a mean arousal value of 0.51, we re-label the data, which previously had the happy, with the new labels P = +, A = + and similarly for sadness with the new labels P = −, A = −.
Term Pleasure Arousal Dominance Mean SD Mean SD Mean SD Happiness 0.81 0.21 0.51 0.26 0.46 0.38 Sadness -0.63 0.23 -0.27 0.34 -0.33 0.22 Surprise 0.40 0.30 0.67 0.27 -0.13 0.38 Fear -0.64 0.20 0.60 0.32 -0.43 0.30 Anger -0.51 0.20 0.59 0.33 0.25 0.39 Disgust -0.60 0.20 0.35 0.41 0.11 0.34
Table 1: Basic Emotions in the PAD space
2.2.3 Plutchik’s theory
Plutchik [87] devised a wheel of emotions with eight basic bipolar emo-tions in the form of dimensions: joy versus sadness; anger versus fear; trust versus disgust; and surprise versus anticipation. Additionally, he compared his concept of emotions with the three dimensional Hue-Saturation-Value (HSV) color space. Plutchik’s HSV-space like cone shaped model has the vertical axis representing intensity while the similarity/dissimi-larity between the emotions is represented by the angle. His model does not have a well defined analogue to the saturation dimension in the color space.
16 H U M A N E M O T I O N S
Figure 3: Plutchik’s wheel of emotions
Plutchik postulated that just like colors, emotions can have different intensities and emotions can mix with one another to form new emotions. In the exploded model (figure4), Plutchik placed the eight basic emotions on the basis of bipolarity and similarity. Two adjacent basic emotions can combine to produce a "dyad" which is analogous to the mixing of primary colors.
Figure 4: Plutchik’s cone of emotions
Plutchik’s model has not found much favor with the affective comput-ing community. He introduced the idea of basic dimensions, however these dimensions do not correlate with any of the fundamental emotions. Most dimensional theories of affect though, have bipolar dimensions just like the ones proposed by Plutchik.
2.3 F A C I A L E X P R E S S I O N S A N D T H E F A C I A L A C T I O N C O D I N G S Y S T E M 17
2.3 F A C I A L E X P R E S S I O N S A N D T H E F A C I A L A C T I O N C O D -I N G S Y S T E M
Picard [86] defines sentic modulation to be the physical means by which an emotional state is typically expressed. Facial expressions are one of the most easily controllable of the sentic modulations. Since the face is one of the most visible and least occluded parts of the body, we allot a lot of importance to facial expressions when we communicate. For a machine to be able to communicate like humans, machines would have to be endowed with the ability to recognize facial expressions even though facial expressions may not always represent the underlying emotion that generated it.
It has been shown that automated facial expression recognition is more accurate and robust on videos as compared to still images, this could be because images cannot capture the dynamics of facial motion as compared to videos. Psychological studies have also suggested that facial motion is essential to facial expression recognition since facial expressions are dynamic processes. Bassili in [7] has shown that humans are better at recognizing facial expressions from videos in comparison to images.
Most researchers in the field of automated facial expression analysis have treated emotions as discrete and subscribe to Ekman’s theory of six basic emotions and their link to facial expressions. Ekman and his col-leagues developed the Facial Action Coding System (FACS) [29] as a tax-onomy of human facial movements by their appearance on the face. FACS is a convenient system to deconstruct almost any anatomically possible fa-cial expression into component muscle movements which are referred to as Action Units (AU’s). An AU can be defined as the relaxation or con-traction of one or more muscles. The FACS manual [30] enumerates 46 Action Units, their location on the face, their appearance corresponding to their intensity and Ekman’s interpretation on their possible meaning. Apart from the AU’s the manual also lists Action Descriptors which are, like AU’s based on muscle movements, but their muscular basis has not been as precisely defined as for the AU’s. The relation between the six basic emotions and the AU’s is presented in the table 2 as proposed by Ekman.
18 H U M A N E M O T I O N S
Emotion Action Units Happiness 6+12 Sadness 1+4+15 Surprise 1+2+5+26 Fear 1+2+4+5+7+20+26 Anger 4+5+7+23 Disgust 9+15+16
Table 2: AU’s associated with basic emotions
A wide variety of image and video databases available today are coded for the presence of AU’s and the six primary emotions. Most of these databases are collected in controlled lab conditions. In most of these databases the facial expressions have been enacted by people without feeling the un-derlying emotion linked to those expressions. Some recent databases such as the SEMAINE database [76] contain spontaneous expressions and it is hard to put these expressions in any of the discrete categories. Not only are these expressions representative of "non-pure" emotions but it is of-ten difficult to assign an emotion word to them strengthening the case for dimensional theories of affect being used for representing emotions asso-ciated with facial expressions. In this thesis we do not claim to recognize affect rather we attempt to infer affect by observing sentic modulations in the form of facial expressions.
2.4 M O O D
Mood is an emotional state which often lasts longer than emotions and has a more diffuse emotional experience. Picard in [86] states that mood can be considered as a process that is always running in the background. The concept of mood differs from emotions in the sense that it is lower in intensity and changes more slowly with time. Mood differs from other psychological aspects such as temperament and disposition in that mood is more transient in nature just as emotions are more transient in nature as compared to mood.
Certain dispositions and temperaments do however influence mood. Peo-ple with a cheerful disposition are more likely to have a good mood at a given instant as compared to someone who, say, for example, has an anxious disposition. Similarly mood can bias people towards certain emo-tions. A bad mood could make it easier for negative-valenced emotions to be activated and vice-versa. The circumplex model of emotions with the two dimensions of pleasure and arousal can be used for an effective de-scription of mood. We often think of mood as being positive, negative or
2.4 M O O D 19
neutral but it can have more nuances for example a good peaceful mood would be low in arousal as compared to a good mood associated with something exciting. A bad mood due to anger would have a high level of arousal; a bad mood due to immense sadness marked by depression would have low arousal.
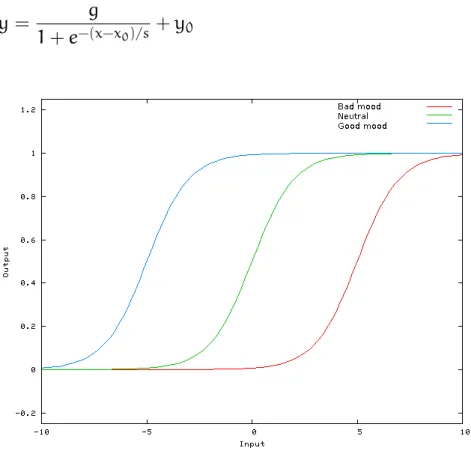
Picard presents an abstract and simplified function for emotion response and the role mood plays in it:
y = g
1 + e−(x−x0)/s
+ y0 (1)
Figure 5: Shift in emotional response due to mood
In this "sigmoidal" like function, x is the input, which may represent multiple possible stimuli, internal or external to the human being. The output y is the emotional response. The parameter s controls the gradient of the curve which is directly tied to the personality of the individual. The parameter g refers to the gain of the sigmoid, this parameter controls the increase or decrease in the amplitude of the sigmoid. This parameter could be related to the activation levels of a person, a person with a higher level of activation might be likely to experience a greater magnitude of emotion. The parameter x0 is the offset i.e. it shifts the response to the left or right. This parameter is used to represent mood. If the function is used to represent the emotional response to a positive stimuli, a good mood will allow small inputs to trigger a response effectively shifting the sigmoid to the left. Finally the parameter y0shifts the sigmoidal curve up
20 H U M A N E M O T I O N S
This representation for emotional response is able to take into account influences such as mood, temperament and cognitive expectation and the phenomenon of activation and saturation of emotional responses. It shows how mood acts as a threshold for activation of an emotional response. For example bad mood with a high degree of arousal could reduce the value of x0 such that even a slightly negative event could activate a response.
Similarly a good mood could lead to a higher value of x0 which wouldn’t allow trivial negative events to create any response.
2.5 D E P R E S S I O N
Depression is a serious mental disorder involving persistent bad mood, low self-satisfaction and lack of interest in normal pleasurable activities. Currently depression is diagnosed by a patient’s self report or through a mental status examination (MSE). A MSE entails the observation of a pa-tient’s state of mind by a psychologist to assess aspects such as attitude, mood, affect and speech. An automated system to detect depression can help both the doctors and patients with diagnosis and treatment monitor-ing. Such a system will also help to overcome the problem of subjective bias associated with self-reports and MSE.
The Beck Depression Inventory (BDI, BDI-1A, BDI-II), designed by Aaron T. Beck [9], is one of the most widely used self-report question-naires for measuring the severity of depression. It is a 21-item self-administered rating inventory that measures characteristic attitudes and symptoms of depression. Each item is a list of four statements arranged in increasing severity about a particular symptom of depression. Items are rated on a 4 point scale and the final score is obtained by adding up the ratings for all 21 items. Higher the score, higher the severity of depression.
The current version of the questionnaire, BDI-II, is designed for in-dividuals aged 13 and over, and contains all major content dimensions of depression including sadness, suicidal ideation, experiences of crying, concentration difficulties, changes in appetite or weight, anhedonia, pes-simism, self-dislike, self-criticalness, feelings of punishment, belief of be-ing a failure, agitation, feelbe-ing of guilt, indecisiveness, lack of energy, change in sleep patters, irritability, feeling of worthlessness, fatigue and change in sex drive.
The BDI-II scales and its predecessors have been translated into a large number of languages and have been extensively used in research and prac-tice. BDI test is perhaps the most used psychological test to date.
In chapter 4 we present a multi-modal system for depression estimation using audiovisual features. The approach is tested on the Audio Visual Emotion Challenge Dataset which contains videos of people with varying levels of depression.The ground truth is in the form of BDI-II scores.
2.6 C O N C L U S I O N 21
2.6 C O N C L U S I O N
Feedback theories described in this chapter posit that emotions are a prod-uct of physiological response to external stimuli. These theories are not further followed in this thesis but they do provide a glimpse into how our understanding of emotions has evolved over time.
Plutchik’s theory in section2.2.3describes how basic emotions are anal-ogous to basic colors and just like colors, basic emotions combine to form more complex emotions. Although the theory has not found much favour among the scientific community, most dimensional theories of affect use bipolar dimensions of affect just as in Plutchik’s theory of emotion.
In section 3.3.3of chapter3, we describe our experiments on inferring affect and its representation in a two-dimensional space using visual in-formation from images. Ekman’s theory of basic emotions and their fa-cial representations using Action Units is widely used by the affective computing community and we describe our experiments for recognizing these basic emotions using visual information from videos in section4.3.1 of chapter 4. Section 4.3.2 of chapter 4 contains description of our ex-periments on depression assessment using audiovisual information from videos.
Questions on automated facial expression recognition faced by the af-fective computing community:
1. Some people are more expressive than others, would it be possible for future automated facial expression analysis systems to adapt to indi-viduals according to their temperament?
2. Could a system be developed that would be able to recognize the underlying emotion when the facial expressions belie them and would such a system be able to tell the genuine expressions apart from the forced ones.
For the first question, current machine learning techniques allow for a high degree of generalization. It is possible that this property could allow affect recognition systems to adapt to new subjects.
If facial expressions are the only input to an affect recognition system, correct recognition would not be possible if the facial expressions do not correctly represent the underlying emotions. Even a system with multiple sentic modulations as inputs might not be able to recognize the affective state correctly because a computer can only have limited access to the human mind and body. It could perform better than people especially if the computer has access to biosignals such as heart rate and electromyo-graphic signals but it would never have access to all the information that the human who experiences those emotions has.
3
S TAT I C I M A G E A N A LY S I S F O R S E N S I N G A F F E C T
This chapter presents the techniques developed for head pose estimation, smile detection, affect sensing and face recognition on static images.
Firstly we describe the image description methods used in section 3.1. The machine learning and statistical techniques used are described in sec-tion3.2, while section 3.3is dedicated to experiments using the methods and techniques described in the preceding two sections. We end this chap-ter with the summary and insights in section3.4.
3.1 I M A G E D E S C R I P T I O N M E T H O D S F O R S T I L L I M A G E S
We have used two major categories of descriptors for our experiments on static images: steerable filters and local binary patterns. There are advan-tages associated with each of the description techniques.
3.1.1 Steerable filter methods
The term steerable filters is used to describe a class of filters in which a filter of arbitrary orientation is synthesized as a linear combination of a set of "basis filters" [35]. The process by which the oriented filter is synthesized at any given angle is known as steering.
For our experiments we used two types of steerable filters: Multi-scale Gaussian Derivatives and Gabor Filters. We have compared the perfor-mance of these two descriptors for smile detection and head pose estima-tion. Apart from accuracy we have looked at the calculation and predic-tion times for these descriptors when a Support Vector Machine is used for classification or regression.
3.1.1.1 Multi-scale Gaussian Derivatives
Gaussian derivatives can efficiently describe the neighborhood appear-ance of an image for recognition and matching[61]. This can be done by calculating several orders of Gaussian derivatives normalized in scale and orientation at every pixel. The basic Gaussian function is defined as:
G(x, y; σ) = 1 σ√2πe
−x2+y2
2σ2 (2)
Here σ is the variance or scale and defines the spatial support. The basic Gaussian function in equation 2 measures the intensity of the
24 S TAT I C I M A G E A N A LY S I S F O R S E N S I N G A F F E C T
hood and does not contribute to the identification of the neighborhood and can be omitted. The first order derivatives are of the form:
Gx(x, y; σ) = ∂G(x, y; σ) ∂x = − x σ2G(x, y; σ) (3) Gy(x, y; σ) = ∂G(x, y; σ) ∂y = − y σ2G(x, y; σ) (4)
First order derivatives give information about the gradient (intensity and direction). The second order derivatives are given by:
Gxx(x, y; σ) = ∂ 2G(x, y; σ) ∂x2 = ( x2 σ4 − 1 σ2)G(x, y; σ) (5) Gyy(x, y; σ) = ∂2G(x, y; σ) ∂y2 = ( y2 σ4 − 1 σ2)G(x, y; σ) (6) Gxy(x, y; σ) = ∂2G(x, y; σ) ∂x∂y = xy σ4G(x, y; σ) (7)
Second order derivatives provide us with information about image fea-tures such as bars, blobs and corners. Higher order derivatives are only useful if the second order derivatives are strong and they are also sensi-tive to high spatial-frequency noise such as sampling noise.
The inverse-tangent of the ratio of first order derivatives at any image point can be used to determine the direction of maximum gradient.
θmax =arctan(
Gy(x, y, σ)
Gx(x, y, σ)) (8) It has been shown that Gaussian derivatives are steerable [35] i.e. the filter response can be calculated at any arbitrary orientation and by using appro-priate trigonometric ratios the Gaussian derivatives can be rotated in the desired direction.
Gθ = Gxcos(θ) + Gysin(θ) (9)
Normalizing Gaussian derivatives in scale is not a trivial task. Several methods have come up in the past addressing this problem. It was shown by Crowley in [20] that Gaussian derivatives be calculated across scales to obtain scale invariant features and then Lowe in [69] adopted Crow-ley’s method to define the intrinsic scale at a point (x, y) as the value of
3.1 I M A G E D E S C R I P T I O N M E T H O D S F O R S T I L L I M A G E S 25
the scale parameter at which the Laplacian provides a local maximum. The computational cost of directly searching the scale axis for this char-acteristic scale can be relatively expensive. A cost-effective method for computing Multi-scale Gaussian derivatives is the Half Octave Gaussian Pyramid described in detail in [22] and an integer coefficient version of the same can constructed using repeated convolutions of the binomial ker-nel (1, 2, 1) [21]. The algorithm involves repeated convolutions with a Gaussian kernel in a cascaded configuration. An essential feature of this pyramid is it’s invariance to impulse response provided by keeping the sampling rate equal to the Gaussian support at each level of the pyramid.
A key feature of this algorithm is that for different levels of the pyramid the difference of adjacent image pixels in the row and column directions are equivalent to convolution with Gaussian derivatives.
The pyramid is very easy to access, derivative values can be determined for every image position by using bilinear interpolation and derivatives between scale values can be computed using quadratic interpolation be-tween adjacent levels of the pyramid.
The following sets of equations explain how different order of deriva-tives can be calculated using difference of adjacent image pixels in the row and column directions:
∂p(x, y, k) ∂x = p∗ Gx(x, y; 2 kσ 0)≈ p(x + 1, y, k) − p(x − 1, y, k) (10) ∂p(x, y, k) ∂y = p∗ Gy(x, y; 2 kσ 0)≈ p(x, y + 1, k) − p(x, y − 1, k) (11) ∂2p(x, y, k) ∂x2 = p∗ Gxx(x, y; 2 kσ 0) ≈ p(x + 1, y, k) − 2p(x, y, k) + p(x − 1, y, k) (12) ∂2p(x, y, k) ∂y2 = p∗ Gyy(x, y; 2 kσ 0) ≈ p(x, y + 1, k) − 2p(x, y, k) + p(x, y − 1, k) (13) ∂2p(x, y, k) ∂x∂y = p∗ Gxy(x, y; 2 kσ 0) ≈ p(x + 1, y + 1, k) − p(x + 1, y − 1, k) − p(x − 1, y + 1, k) + p(x − 1, y − 1, k) (14) In the above equations at the kth level of the pyramid the support is
defined by σk = 2kσ0 and the image at the same level is defined by p(x, y, k).
26 S TAT I C I M A G E A N A LY S I S F O R S E N S I N G A F F E C T
3.1.1.2 Gabor Filters
Gabor filters are a category of bandpass filters which can be used for fea-ture extraction and image description. The Gabor(x, y) function can be interpreted as a Gaussian filter modulated by an oriented complex sinu-soid:
Gabor(x, y) = s(x, y)G(x, y) (15) where s(x, y) is a complex sinusoid, known as the carrier, and G(x, y) is a 2-D Gaussian function [77], known as the Gaussian envelope. The complex sinusoid shifts the Gaussian envelope in the frequency domain resulting in a band-pass filter. Such filters are used for image processing to enhance image structures at specific orientations and scales.
The Gabor(x, y) function is characterized by three parameters: a) the σ and b) the orientation θ of the Gaussian kernel G(x, y) and c) the fre-quency f of the complex sinusoid s(x, y). The σ sets the resolution of the filter, the θ the orientation of the filter and f the length of the edges that will be captured. The size of σ, so consequently the size of G(x, y), depend on the size of f.
The response of the real and imaginary components can be combined with the L2-norm to give a Gabor Energy filters (GEF). Such filters
re-spond to an edge or a corner with the local maxima centerd exactly at the edge or the corner. While Gabor wavelets and Gabor Energy functions are now widely known to be effective for facial image analysis, their im-plementation cost has proven to be a barrier for real time applications on mobile computing platforms. Also, the belief that Gabor filters are a con-venient way to compute localised spacial frequency filters has gradually transformed into an widely repeated claim that the Gabor function is the exact function computed in the mammalian visual cortex [26], leading the community to ignore other less expensive mechanisms for computing localised band-pass spatial frequency filters.
3.1.2 Local Binary Patterns
Local binary patterns (LBP) operator is a simple yet powerful descriptor for texture analysis [81]. It requires limited computational power and is ideal for real-time applications. Its robustness to monotonic gray-scale changes make it suitable for applications such as facial image analysis where variations in illumination can have major effects on appearance.
Many variations over the original LBP operator have been proposed. One extension allows LBP operator to use neighborhoods of different sizes [82]. Another modification introduced in [82] is the Uniform LBP
3.1 I M A G E D E S C R I P T I O N M E T H O D S F O R S T I L L I M A G E S 27
which which can be used to reduce the length of the feature vector by using a smaller number of bins and is also invariant to rotation.
A general algorithm for computing LBP features over a facial image is as follows:
Step 1: Divide the image into blocks of pixels.
Step 2: For each pixel in a block, compare the pixel value to each of its neighbors, the neighborhood size is controllable. The comparison is performed either clockwise or counter-clockwise.
Step 3: If the pixel value of the neighbor is greater than the value of the center pixel a "1" is generated otherwise a "0" is generated. For a 3 X 3 neighborhood, an eight bit pattern will be generated, this pattern can be converted to a decimal value for convenience.
Step 4: A histogram is calculated for the block which contains the fre-quency of occurrence of the patterns generated for each pixel. This his-togram may or may not be normalized.
Step 5: Histograms for all the blocks in the image are concatenated to obtain the final descriptor for the image.
Figure 6: Computing LBP response from a pixel’s local neighbourhood.