HAL Id: tel-02137482
https://tel.archives-ouvertes.fr/tel-02137482
Submitted on 23 May 2019HAL is a multi-disciplinary open access archive for the deposit and dissemination of sci-entific research documents, whether they are pub-lished or not. The documents may come from teaching and research institutions in France or abroad, or from public or private research centers.
L’archive ouverte pluridisciplinaire HAL, est destinée au dépôt et à la diffusion de documents scientifiques de niveau recherche, publiés ou non, émanant des établissements d’enseignement et de recherche français ou étrangers, des laboratoires publics ou privés.
Open heavy-flavour measurements via muons in
proton-proton and nucleus-nucleus collisions with the
ALICE detector at the CERN-LHC
Zuman Zhang
To cite this version:
Zuman Zhang. Open heavy-flavour measurements via muons in proton-proton and nucleus-nucleus collisions with the ALICE detector at the CERN-LHC. Accelerator Physics [physics.acc-ph]. Central China Normal University, 2018. English. �NNT : 2018CLFAC077�. �tel-02137482�
CENTRAL CHINA NORMAL UNIVERSITY UNIVERSITÉ CLERMONT AUVERGNE
P H D T H E S I S
présentée pour obtenir le grade de
DOCTOR OF UNIVERSITY
Spécialité : Physique des Particules
Par
Zuman Zhang
Open heavy-flavour measurements
via muons in proton-proton and
nucleus-nucleus collisions with the
ALICE detector at the
CERN-LHC
defended on November 22, 2018
Jury :
Examinateurs: A. Baldisseri - DSM/IRFU, CEA, Saclay A. Grelli - University of Utrecht, Utrecht Y. Ma - SINAP, Shanghai
Z. Yin - CCNU, Wuhan X. Li - CIAE, Beijing
Directeurs de thèse: N. Bastid - LPC, Clermont-Ferrand P. Crochet - LPC, Clermont-Ferrand D. Zhou - CCNU, Wuhan
分类号
密级
U D C
编号
博 士 学 位 论 文
LHC/ALICE 实验向前区重味强子衰变
半单轻子物理的研究
学 位 申 请 人 姓 名:
张 祖 满
申 请 学 位 学 生 类 别:
全日制博士
申 请 学 位 学 科 专 业:
粒子物理与原子核物理
指 导 教 师 姓 名:
周代翠
教授
张晓明
副教授
Philippe Crochet 研究员
Nicole Bastid 教授
博士学位论文
LHC/ALICE 实验向前区重味强子衰变
半单轻子物理的研究
论文作者:张祖满
指导教师:周代翠
教授
张晓明
副教授
菲利普•胡克 资深研究员
妮可•巴斯蒂 教授
学科专业:粒子物理与原子核物理
研究方向:高能重离子碰撞实验
华中师范大学物理科学与技术学院
2018 年 11 月
Dissertation
Open heavy-flavour measurements via muons
in proton-proton and nucleus-nucleus
collisions with the ALICE detector at the
CERN-LHC
By
Zuman Zhang
Supervisors: Pr. Daicui Zhou
Pr. Xiaoming Zhang
Dr. Philippe Crochet
Pr. Nicole Bastid
Specialty: Particle Physics and Nuclear Physics
Research Area: Heavy-Ion Collision Experiment
College of Physical Science and Technology
Central China Normal University
华中师范大学学位论文原创性声明和使用授权说明
原创性声明
本人郑重声明:所呈交的学位论文,是本人在导师指导下,独立进行研究工作
所取得的研究成果。除文中已经标明引用的内容外,本论文不包含任何其他个人或
集体已经发表或撰写过的研究成果。对本文的研究做出贡献的个人和集体,均已在
文中以明确方式标明。本声明的法律结果由本人承担。
作者签名:
日期:
年
月
日
学位论文版权使用授权书
学位论文作者完全了解华中师范大学有关保留、使用学位论文的规定,即:研
究生在校攻读学位期间论文工作的知识产权单位属华中师范大学。学校有权保留并
向国家有关部门或机构送交论文的复印件和电子版,允许学位论文被查阅和借阅;
学校可以公布学位论文的全部或部分内容,可以允许采用影印、缩印或其它复制手
段保存、汇编学位论文。(保密的学位论文在解密后遵守此规定)
保密论文注释:本学位论文属于保密,在
年解密后适用本授权书。
非保密论文注释:本学位论文不属于保密范围,适用本授权书。
作者签名:
导师签名:
日期:
年
月
日
日期:
年
月
日
本人已经认真阅读“CALIS 高校学位论文全文数据库发布章程”,同意将本人的
学位论文提交“CALIS 高校学位论文全文数据库”中全文发布,并可按“章程”中的
规定享受相关权益。同意论文提交后滞后:□半年;□一年;□二年发布。
作者签名:
导师签名:
日期:
年
月
日
日期:
年
月
日
摘 要
自然界中可见物质的结构探索,可追溯到英国物理学家约瑟夫·约翰·汤姆
逊(
Joseph John Thomson)1897 年通过测量阴极射线的荷质比发现电子。1932 年
詹姆斯·查德威克(
James Chadwick)在用α粒子轰击核的实验中发现了中子,之
后人们认识到原子核是由质子和中子构成的,从而形成所有物质都是由基本的结
构单元:质子 、中子、电子构成的统一的世界图像。
19 世纪初开始,现代的基本
粒子概念也逐渐形成,研究比基本结构单元更深层次的微观世界中物质的结构性
质,和在很高的能量下,这些物质相互作用的现象。人们利用粒子加速器,进行
粒子高能碰撞实验,从而生产和侦测这些基本粒子,研究基本粒子,以及它们之
间相互作用的原因和规律。
根据描述自然界中可见物质由那些基本粒子组成,以及基本粒子间相互作用
特性的标准模型(
SM),构成物质的基本粒子分为三代夸克,三代轻子和它们的
反粒子,且这些基本粒子间通过传递胶子、W
±和 Z
0玻色子及光子发生对应的强、
弱和电磁相互作用。一种解释基本粒子质量之源的粒子-希格斯玻色子,于 2012
年在欧洲核子研究中心(
CERN)的大型强子对撞机(LHC)实验中发现。夸克胶子
(部分子)间发生的强相互作用通过量子色动力学(
QCD)来描述,QCD 具有三个特
殊性质:渐近自由、手征对称性动力学破缺和色禁闭。由于色禁闭,夸克和胶子
被禁闭在强子中。格点量子色动力学(
LQCD)的理论计算预言在高温和/或高密条
件下,禁闭在普通强子内的部分子将发生退禁闭形成一种由处于渐近自由状态的
夸克和胶子组成的新物质相:夸克胶子等离子体(
QGP)。目前,QGP 被认为存在
于自然界中正在塌陷的中子星内部(高重子数密度)和宇宙大爆炸后数
μs 的初期
(极高温)。研究
QGP 不仅帮助理解多粒子体系的强相互用特性和使物理学的研
究疆域拓展至接近宇宙诞生初始,而且对考察宇宙的起源、物质的本性以及对验
证现有的粒子物理标准模型等都有重要意义。如何在现有实验条件下通过实验产
生
QGP 这种新物质相一直是科学家们思考的问题。
通过高能重离子碰撞,制造高温高密极端环境,是现有的探寻禁闭解除的
QGP,研究 QGP 特性的可行途径。被剥离带电的两入射原子核被加速到接近于光
速实现猛烈对撞,深度非弹性过程导致两核的巨大动能转化为热能沉积在碰撞中
心区,在一个有限空间范围内形成极端高温或高重子密度环境,诱导强子物质解
除夸克禁闭,形成夸克胶子等离子体这种新物质形态。随着时间的推移,夸克物
质体系的膨胀和冷却,
QGP 物质相又冻结为强子相,发射出末态可观测的粒子。
我们利用高能重离子探测器侦测到的粒子研究
QGP 特性。上世纪七十年代以来国
际上相继建造了一系列高能重离子加速器,包括欧洲核子研究中心(
CERN)的超
级质子同步加速器(
SPS)、美国布鲁海文国家实验室(BNL)的交变梯度加速器
(
AGS)和相对重离子对撞机(RHIC),在发现强作用 QGP 信号及其性质上取得
了很好的成果和进展:
1. SPS 能区, 奇异粒子产额明显增强,被解释为手征对称
性在退禁闭物质相中得到恢复,而使得奇异夸克在
QGP 物质中产生阈值的降低;
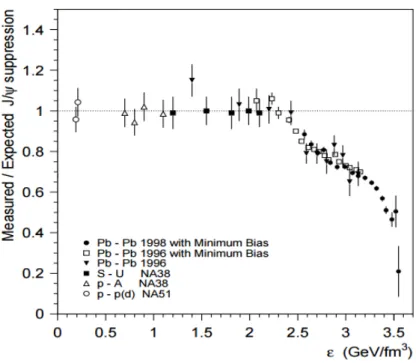
/ J粒子产额压低,被认为是粲夸克偶素(
cc)在 QGP 物质中 Debye 屏蔽势作用
下熔解而致。
2. RHIC 能区,不同种类带电强子椭圆流的组分夸克数目的标度特
性,揭示了部分子在
QGP 内的热化自由度;高横动量区域强子谱压低以及喷注强
子背向关联的减弱,反映了高能部分子在穿越
QGP 热密介质时发生强相互作用,
诱导部分子辐射能量损失所致。上述实验观测结果与相应理论描述一致,证明了
QGP 物质的存在。
为 了 系 统 的 深 入 地 研 究
QGP 物质性质,世界上最大的大型强子对撞机
(
LHC)于 2009 年在 CERN 正式运行。大型重离子碰撞实验(ALICE),作为
LHC 上四大实验(ALICE、ATLAS、CMS 和 LHCb)之一,专门致力于高能重离
子碰撞的夸克物质信号探测及其性质的研究。
ALICE 在 2010 年底首次获取质心能
量
2.76 TeV 铅-铅碰撞数据。 该能量相当于 RHIC 最高碰撞能量(金-金碰撞,
NN s200 GeV)的~14 倍,因此碰撞所形成的 QGP 物质相比于 RHIC 能区将持
续时间更长且体积更大,这为全面而深入地研究
QGP 物质的特性提供了更加优越
的条件。
在众多反映
QGP 性质的末态探针中,重夸(粲夸克和美夸克)十分重要。由
于重夸克质量大,重夸克主要产生于碰撞初期的硬散射过程,且重夸克具有更短
的形成时间和更硬的碎裂函数。因此,重夸克早于
QGP 物质形成,并穿越随后形
成的
QGP 物质体系,记录了 QGP 系统各演化阶段的信息;其运动学分布又能很
好的被其碎裂末态强子所反映。
核子-核子(
pp)碰撞中,对重夸克末态产物的测量蕴涵着丰富的物理,不仅
为核子
-核(pA)碰撞和重离子碰撞提供了归一化基准,同时,也是检测微扰量子
色动力学(
pQCD)的有利工具。在核-核(AA)碰撞中,重夸克穿越 QGP 体系时
与其内部部分子相互作用,而导致的能量损失体现了强相互作用的特性。根据
QCD 理论预言,胶子的辐射能量损失大于夸克。而较之轻夸克,重夸克的胶子辐
射会在与其夸克质量相关的锥角内压低,从而导致重夸克辐射能量损失比轻夸克
小,这一效应被称为死角效应。基于重夸克辐射能量损失的死角效应,重味强子
与其内部部分子相互作用的能量损失应该小于轻强子。随横动量分布的核修正因
子(
R
AA)是反映部分子能量损失的实验观测量,
R
AA定义为同一能量的核
-核(如
金
-金、铅-铅和氙-氙)碰撞中约化为一对核子碰撞产生的粒子产额与核子-核子
(如质子
-质子)碰撞中的粒子产额之比。若没有核效应,R
AA值为单位一;
R
AA值
小于单位一,可能是由部分子能量损失和其它核效应导致。在
p-A 碰撞中,R
pA是
了解各种冷核效应(核遮蔽、内禀横动量增宽以及胶子饱和等)的有力工具,特
别是在实验的向前快度区间,它能使对冷核效应的测量达到及小的
Bjorken-x 值区
间 (
2013 年,ALICE ,p-Pb 在质心系能量
sNN 5.02 TeV 的碰撞, 向前区
Bjorken-x ~ 10
-6,处于核遮蔽区间)。
本文的工作基于
ALICE 实验向前区
子谱仪采集的实验数据,通过重味夸克
半轻子衰变道研究
pp 碰撞和 A-A 碰撞中重味产额的物理性质。分析步骤包括重建
粒子径迹和反应事件,测量最小无偏碰撞的单举
子横动量谱,扣除
K/
、
J/
和
W/Z,
*衰变
背景贡献,计算
子重建效率,研究系统误差,得到
pp 碰撞和
A-A 碰撞中重味夸克半轻衰变道
子的产物,计算
A-A 碰撞中重夸克衰变
子的
产额的核修正因子
R
AA,比较模型预言,研究
AA 碰撞中的重夸克产生是否存在压
低行为,检验热核效应。
第一章对
QGP 相变,高能重离子碰撞的 QGP 测量结果做简要介绍,LHC 能
区实验相对于
SPS 和 RHIC 实验有更好的 QGP 测量结果。pp、pA 和 AA 碰撞中重
味产生也做了简要介绍,重夸克是十分重要的
QGP 性质的末态探针。第二章介绍
ALICE 探测器特别是向前区
子谱仪的结构、原理和性能。还简要的介绍
ALICE
探测器升级,并对
ALICE 实验数据获取以及在线和离线分析环境进行进行描述。
本文还介绍本工作对重夸克半轻
子道测量所开发的数据分析和校正的软件和分析
代码框架。
第三、四、五、六章着重讨论数据分析方法、内容和物理结果。第三章,重
点讨论质心能量
s 5.02 TeV、2.76 TeV 和 5.44 TeV pp 碰撞中的重夸克衰变
子
和
sNN 5.44 TeV 氙 - 氙 ( Xe-Xe ) 碰 撞 中 的 R
AA测 量 计 算 提 供 基 准
(
reference)。我们还比较了实验测量与理论模型预言,结果显示,在误差范围
内,我们的测量结果很好的符合了次领头阶的
pQCD 计算的预言,这一结果是首
次在新能区
s 5.02 TeV 下对 pQCD 理论预言的重夸克产生截面的检验。
在第四章,我们讨论质心能量
sNN 5.02 TeV(2015 年数据)和
sNN 2.76
TeV(2011 年数据)Pb-Pb 碰撞实验中重夸克衰变
子的
R
AA的实验分析方法。第
五 章 展 示 和 讨 论 第 四 章 的 物 理 结 果 。 其 数 据 样 本 较 之 前 发 表 的 质 心 能 量
NN s2.76 TeV(2010 年数据)Pb-Pb 碰撞结果有更高的统计量。本分析选择了
高横动量阈值的触发样本,因此本分析工作能测到更宽更高横动量(
pT)区间的
R
AA。 结 果 显 示 ,
2015 年数据 的结果比 2010 年数据 的结果有更 高的精度 ;
NN s5.02 TeV 和 2.76 TeV Pb-Pb 碰撞中重夸克衰变
子的
R
AA值小于单位一,
且两者的结果在误差范围内相同;质心能量
sNN 5.02 TeV(2013 年数据)表明
冷核效应对核修正因子的影响较小(
R
pA~ 1),因此 Pb-Pb 碰撞实验结果证实,在
核
-核对心碰撞中观测到的重夸克衰变 子谱在高
pT区间的明显压低现象,主要由
热核效应导致;在向前区重味强子衰变
子与中心快度区重味强子衰变电子的结果
在不确定度范围内一致;实验测量与理论模型预言在误差范围内保持一致。
第六章介绍
sNN 5.44 TeV Xe-Xe 碰撞实验中重夸克衰变
子的
R
AA的实验
分析方法、误差,其分析方法和
Pb-Pb 碰撞中的分析方法一致。对这一章的结果
也做了讨论,在向前区,相对于
sNN 5.02 TeV 10-20%中心度的 Pb-Pb 碰撞,
NN s5.02 TeV 0-10%中心度的 Xe-Xe 碰撞有相似的带电粒子平均多重数,且两
者的
R
AA结果在误差范围内相同。此外,与
Pb-Pb 结果相比,Xe-Xe 碰撞系统中
R
AA的测量还可以首次在实验结果中测试能量损失的路径长度依赖性。
本文第七章对前六章的介绍和讨论以及结果进行了总结,并对进一步的相关
研究内容提出了展望。
关键词:夸克胶子等离子体(
QGP);大型强子对撞机(LHC);大型重离子碰
撞实验(
ALICE);质子-质子(pp)和核-核(AA)碰撞;冷核效应和热核效
应;重味夸克产生的单举
子谱;核修正因子(R
AA)
Abstract
In nature, the interaction of particles and microscopic structure of matter have historically been concerned by human being. The Standard Model (SM) widely accepted by the theory of particle physics, describes that the fundamental particles are three generation of quarks, three generation of leptons and their anti-particles. The bosons, including photons (γ), gluons (g), W±, Z0, are the force carriers of the
electromagnetic, strong and weak interactions. In 2012 the ATLAS (A Toroidal LHC ApparatuS) and CMS (Compact Muon Solenoid) experiments at the LHC (Large Hadron Collider) observed the Higgs boson, which explains the origin of mass.
According to Quantum ChromoDynamics (QCD) calculations on the lattice, a state of strongly-interacting matter at high energy density and temperature where quarks and gluons are deconfined, the Quark-Gluon Plasma (QGP), is produced. This state of matter would have existed in the core of neutron stars at high baryonic densities and few microseconds after the Big Bang where extremely high tempera-tures were reached. High-energy heavy-ion collisions provide a unique opportunity for the QGP formation and for characterizing its properties. Since the 1970’s, sever-al facilities have been built to produce and study of the QGP by means of heavy-ion collisions at various energies. The results from different experiments improved our understanding of the QGP. The LHC started operated in 2009 and delivered until 2013 (run-1) pp (√s = 0.9-8 TeV), p-Pb (√sNN = 5.02 TeV) and Pb-Pb (
√ sNN =
2.76 TeV) collisions. By delivering Pb-Pb collisions at √sNN = 5.02 TeV with a
significantly higher luminosity compared to the run-1, the LHC run-2 (2015-2018) provides new conditions for the study of the QGP. During the run-2, the LHC deliv-ered also pp (√s = 5.03, 13 TeV) and p-Pb (√sNN = 5.02 and 8.16 TeV) collisions.
Finally, a short Xe-Xe run at √sNN = 5.44 TeV was performed to investigate the
system-size dependence of various observables.
ALICE is the experiment designed and optimized for the study of heavy-ion collisions at the LHC. ALICE also takes part in the pp program which provides the mandatory reference for p-Pb, Xe-Xe and Pb-Pb collisions, and allows to us to test perturbative QCD-based calculations.
Amongst the most important probes of the properties of the QGP, heavy quarks (charm and beauty) are of particular interest since they are predominantly produced in initial hard scattering processes and experience the full evolution of the hot and dense QCD medium. During their propagation through the medium, they lose energy via radiative and collisional processes. Quarks are expected to lose less energy than gluons due to the colour-charge dependence of the strong interactions, and due to the dead-cone effect the heavy-quark energy loss is reduced compared to that of light quarks. Further processes such as collisional energy loss, fragmentation, recombination and coalescence can also modified the particle yields. . These in-medium effects can be quantified using the nuclear modification factor RAA which compares the pT-differential particle yields in nucleus-nucleus collisions and binary-scaled pp collisions.
This thesis presents measurements of the production of open heavy flavours at forward rapidity (2.5 < y < 4) via the semi-muonic channel in pp collisions at a centre-of-mass energy√s = 5.02 TeV, Pb-Pb collisions at a nucleon-nucleon centre-of-mass energy√sNN = 2.76 and 5.02 TeV, and in Xe-Xe collisions at
√
sNN = 5.44
TeV with the ALICE (A Large Ion Collider Experiment) detector at the CERN Large Hadron Collider (LHC). The document is organized as follows. The first chapter consists in a general introduction on heavy-ion collisions and QCD phase transitions, and summarizes the motivations for the study of open heavy flavours in pp, p-A and A-A collisions. Chapter 2 gives an overview of the ALICE experiment with a particular emphasis on the description of the forward muon spectrometer. The online and offline systems are also presented. The analysis framework and in particular the software developed for the study of open heavy flavours are present-ed. The ALICE upgrade project is also discusspresent-ed. Chapter 3 is dedicated to the measurement of the production of muons from heavy-flavour hadron decays in pp collisions at √s = 5.02 TeV. The analysis strategy is detailed. The experimental results are obtained in wide transverse momentum interval, 2 < pT < 20 GeV/c, and
with an improved precision compared to the published run-1 measurements. They are compared with perturbative QCD (pQCD)-based calculations. That concern-s the pT- and y-differential production cross sections and ratios between different
centre-of-mass energies and rapidities. The needed pp references at √s = 2.76 and 5.44 TeV are also presented. Chapter 4 consists of a detailed description of the anal-ysis strategy implemented for the measurements of the production of muons from heavy-flavour hadron decays in Pb-Pb collisions at √sNN = 5.02 TeV. The
proce-dure to perform same measurements at√sNN= 2.76 TeV is also discussed. Chapter
5 presents the Pb-Pb results at √sNN = 5.02 TeV (production cross sections and
nuclear modification factor as function of pTand collision centrality). They are
com-pared with same measurements performed at √sNN = 2.76 TeV. Comparisons with
results obtained in a different kinematic region by ALICE and other experiments are also shown. Finally, comparisons with model predictions are discussed. Chapter 6 addresses the measurement of heavy-flavour hadron decay muons in Xe-Xe collisions at √sNN = 5.44 TeV. The analysis strategy is described and the results (RAA) are
compared with the ones obtained in Pb-Pb collisions at√sNN= 5.02 TeV and with
model calculations. Finally, a summary and outlooks are given in Chapter 7. Keywords: Quark-Gluon Plasma (QGP); A Large Ion Collider Experiment (ALICE); Large Hadron Collider (LHC); proton-proton (pp) and nucleus-nucleus (A-A) collisions; Cold and hot nuclear matter effects; Open heavy-flavour production via single muons; Nuclear modification factor (RAA)
Contents
1 Introduction 1
1.1 Standard Model and Quantum ChromoDynamics . . . 1
1.2 Quark-Gluon Plasma and relativistic heavy-ion collisions . . . 6
1.2.1 QCD phase diagram and Lattice QCD results . . . 6
1.2.2 Ultra-relativistic heavy-ion collisions . . . 8
1.3 Probing the QGP in heavy-ion collisions . . . 11
1.3.1 Selected highlights from the CERN-SPS heavy-ion program . 11 1.3.2 Selected highlights from the RHIC experiments . . . 14
1.3.3 LHC: detailed QGP properties . . . 19
1.4 Heavy flavours as probes of the QGP . . . 24
1.4.1 Heavy-flavour hadron production in nucleon-nucleon collisions 24 1.4.2 Binary scaling of heavy-flavour production in AB collisions . 28 1.4.3 Heavy-flavour production in pA collisions: cold nuclear effects 29 1.4.4 Heavy-flavour production in AA collisions: hot nuclear effects 32 1.4.5 Selected heavy-flavour physics results at the LHC . . . 35
1.4.6 Thesis objective: study of open heavy flavours via the semi-muonic decay channel . . . 39
2 The ALICE Experiment at the LHC 45 2.1 The Large Hadron Collider (LHC) . . . 45
2.1.1 The LHC experiments . . . 46
2.2 ALICE detector overview . . . 47
2.2.1 Detector Layout . . . 47
2.2.2 Global detectors . . . 50
2.2.3 Central barrel detectors . . . 53
2.2.4 Forward muon spectrometer . . . 56
2.2.5 ALICE detector upgrade project . . . 60
2.2.6 ALICE data taking periods during LHC Run-1 and Run-2 . . 62
2.3 The ALICE online system . . . 62
2.3.1 Trigger system . . . 62
2.3.2 Data acquisition system . . . 63
2.3.3 Reconstruction . . . 64
2.4 The ALICE offline framework . . . 64
2.4.1 Software Platform . . . 64
2.4.2 Event simulation and reconstruction . . . 65
2.4.3 Analysis framework. . . 66
3 Measurements of the production of muons from open heavy-flavour hadron decays in pp collisions 69
3.1 Measurements in pp collisions at√s = 5.02 TeV. . . 70
3.1.1 Data samples and muon selections . . . 70
3.1.2 Normalization procedure . . . 73
3.1.3 Acceptance times efficiency correction . . . 78
3.1.4 Estimation of the muon background contributions. . . 80
3.1.5 Systematic uncertainty sources . . . 97
3.1.6 Results and model comparisons . . . 102
3.1.7 Conclusion . . . 110
3.2 pp reference at √s = 5.44 TeV: energy scaling method . . . 111
3.2.1 Energy scaling factor . . . 111
3.3 pp reference at √s = 2.76 TeV: pT extrapolation . . . 115
4 Analysis strategy for the open heavy-flavour hadron decay muon measurement in Pb-Pb collisions at √sNN= 5.02 and 2.76 TeV 117 4.1 Data samples and muon selection . . . 117
4.1.1 Data samples at 5.02 and 2.76 TeV . . . 117
4.1.2 Event and track selections at √sNN = 5.02 TeV . . . 119
4.1.3 Event and track selections at √sNN = 2.76 TeV . . . 121
4.2 Normalization procedure . . . 123
4.2.1 Normalization at√sNN = 5.02 TeV. . . 123
4.2.2 Normalization at√sNN = 2.76 TeV. . . 128
4.3 Acceptance × efficiency correction . . . 131
4.3.1 Acceptance × efficiency correction at √sNN = 5.02 TeV . . . 132
4.3.2 Acceptance × efficiency correction at √sNN = 2.76 TeV . . . 135
4.4 Estimation the muon-background contributions . . . 136
4.4.1 Estimation of the background contribution of muons from light-hadron decays . . . 137
4.4.2 Estimation of the background contribution of W,Z/γ∗ decay muons . . . 145
4.4.3 Estimation of the J/ψ decay muon contribution . . . 149
4.5 Estimation of the systematic uncertainty sources . . . 149
4.5.1 Systematic uncertainty on detector response at √sNN = 5.02 and 2.76 TeV . . . 149
4.5.2 Centrality-dependent systematic uncertainty at√sNN = 5.02 and 2.76 TeV . . . 152
4.5.3 Systematic uncertainty on muon background subtraction at √ sNN = 5.02 and 2.76 TeV . . . 152
4.5.4 Systematic uncertainty on the pp reference . . . 152
4.5.5 Systematic uncertainty on normalization . . . 152
5 Open heavy-flavour hadron decay muon measurement results in Pb–Pb collisions at √sNN = 5.02 and 2.76 TeV 157
5.1 Open heavy-flavour hadron decay muon measurement results in Pb–
Pb collisions at√sNN = 5.02 TeV . . . 157
5.1.1 Normalized pT-differential yields of muons from heavy-flavour hadron decays. . . 157
5.1.2 The pT-differential RAA of muons from heavy-flavour hadron decays . . . 158
5.1.3 Comparison with RpPb results in p-Pb collisions at 5.02 TeV. 159 5.1.4 The pT-integrated RAA of muons from heavy-flavour hadron decays . . . 160
5.2 Results in Pb–Pb collisions at √sNN = 2.76 TeV . . . 161
5.3 Comparison of results at√sNN = 5.02 and 2.76 TeV in Pb-Pb collisions163 5.4 Comparison with other experiment results . . . 165
5.4.1 Comparison with heavy-flavour hadron decay electron RAA results in Pb-Pb collisions at 5.02 TeV with ALICE . . . 165
5.4.2 Comparison with heavy-flavour hadron decay muon RAA mea-surement in Pb-Pb collisions at 2.76 TeV with ATLAS . . . . 166
5.5 Comparison with model calculations . . . 166
5.6 Conclusion. . . 169
6 Production of muons from open heavy-flavour hadron decays in Xe-Xe collisions at √sNN=5.44 TeV 174 6.1 Data sample and muon selection . . . 174
6.2 Analysis procedure . . . 176
6.2.1 Normalization to equivalent number of Minimum-Bias events 176 6.2.2 Acceptance × efficiency correction . . . 179
6.2.3 Estimation the muon-background contributions . . . 181
6.2.4 Estimation of systematic uncertainties . . . 185
6.3 Results and discussion . . . 189
7 Summary and Outlooks 196
Bibliography 200
Publication list 217
Presentation list 218
List of Figures
1.1 The SM of elementary particles, with the three generations of matter, gauge bosons in the fourth column, and the Higgs boson in the fifth column. Figure taken from Ref. [3] . . . 2
1.2 Summary of interactions between particles (left), and example of strong, weak and electromagnetic interactions from middle to right. Figure taken from Ref. [3]. . . 2
1.3 Summary of Higgs-boson mass measurements from the analyses of ATLAS and CMS collaborations. The systematic (narrower, magenta-shaded bands), statistical (wider, yellow-shaded bands), and total (black error bars) uncertainties are indicated. The (red) verti-cal line and corresponding (gray) shaded column indicate the central value and the total uncertainty of the combined measurement, re-spectively. Figure taken from Ref. [6]. . . 3
1.4 Summary of measurements of αs as a function of the energy scale Q. The respective degree of perturbation QCD theory used in the extraction of αs is indicated in brackets (NLO: next-to-leading
or-der; NNLO: next-to-next-to leading oror-der; NNLO: NNLO matched with resummed next-to-leading logs; NNNLO: next-to-NNLO). Fig-ure taken from Ref. [8].. . . 5
1.5 Phase diagram of QCD matter in the representation temperature T versus baryon chemical potential µ. Figure taken from Ref. [16].. . . 6
1.6 The pressure, energy density and entropy density of QCD matter as a function of temperature from lattice QCD calculations. Figure taken from Ref. [18].. . . 7
1.7 The evolution of the universe. Figure taken from Ref. [21]. . . 7
1.8 Schematic view of two colliding nuclei in the geometrical participant-spectator model. The distance in the transverse plane of the collisions between the centers of the two Lorentz contracted nuclei is the impact parameter (b). Figure taken from Ref. [24]. . . 8
1.9 Top: schematic representation of the various stages in a ultra-relativistic nuclear collision. Bottom: space-time evolution of a heavy-ion collision. Figure taken from Ref. [27,28]. . . 9
1.10 The initial energy density measured by SPS experiments as a func-tion of the collision centrality determined by means of the number of participants. Figure taken from Ref. [33]. . . 11
1.11 Hadron multiplicities in Pb-Pb collisions at 158 AGeV measured at SPS vs. prediction of the Statistical Hadronization Model. Figure taken from Ref. [34]. . . 12
1.12 The measured J/Ψ yield to the expected yield in various collision systems mentioned in the figure. Figure taken from Ref. [33]. . . 13
1.13 The chemical freeze-out temperature as a function of µB for different energies, as obtained from fits to data from RHIC, SPS, AGS, and SIS. The curves correspond to the freeze-out conditions (a constant energy density over particle density) <E>/<N> = 1 GeV and 1.1 GeV [42]. Figure taken from Ref. [43]. . . 14
1.14 Geometry of the collision in a two-dimensional (left panel) and three-dimensional plane (right panel). Figures taken from Ref. [23,25]. . . 15
1.15 Measurements of elliptic flow (v2) for identified hadrons plotted as v2
divided by the number of constituent quarks nq in the hadron as a function of pT/nq (left) and KET/nq (right), with KET = mT-m0. Figure taken from Ref. [44]. . . 16
1.16 Compilation of the ratio of shear viscosity to entropy density for vari-ous substances: atomic He, molecular N2and H2O (upper 3 symbols),
QGP (upward triangles above Tc), pion gas (downward triangles be-low Tc) and empirical estimates from heavy-ion data. Figure taken
from Ref. [45].. . . 16
1.17 Nuclear modification factor RAA for D (top left: 0-10%, top right:
40-80%) and π (bottom left: 0-10%, bottom right: 40-50%) mesons in Au-Au collisions at√sNN = 200 GeV by the PHENIX and STAR
experiments at RHIC. Figure taken from Ref. [46]. . . 17
1.18 Di-hadron azimuthal correlations for pp, central d-Au and central Au-Au collisions from STAR (left panel), di-hadron correlations for different orientations of the trigger hadron relative to the Au-Au re-action plane from STAR (right panel). Figure taken from Ref. [47]. . 18
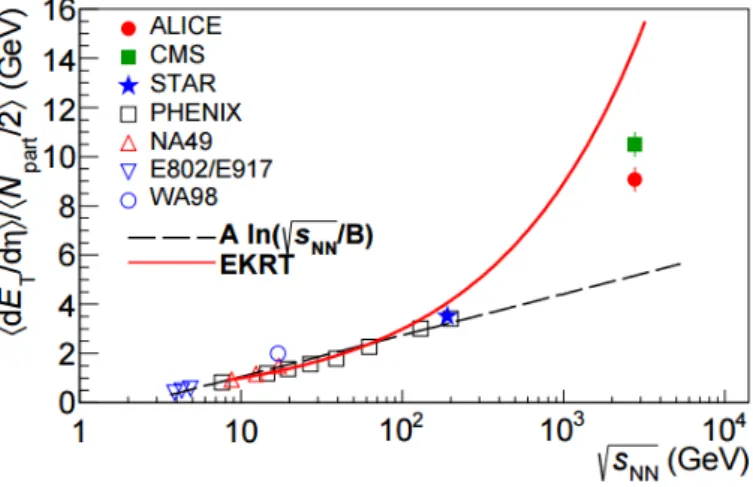
1.19 Transverse energy pseudorapidity density per participant pair for cen-tral AA collisions (0–7% cencen-trality for NA49 and 0–5% for all other experiments) at mid-rapidity as a function of the collision energy. Figure taken from Ref. [50]. . . 19
1.20 Direct photon pT spectrum for Pb-Pb collisions at√sNN= 2.76 TeV,
compared to NLO pQCD calculations. Figure taken from Ref. [52]. . 20
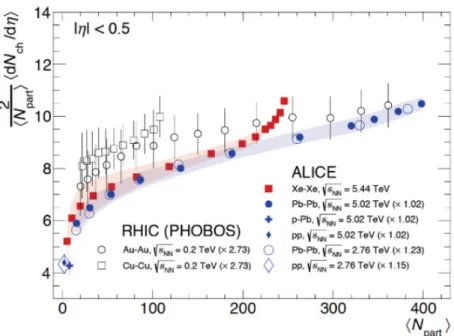
1.21 The mid-rapidity charged-particle multiplicity as a function of the number of participants measured in PHOBOS (RHIC) and ALICE experiments. Figure is taken from Ref. [56]. . . 21
1.22 Two-dimensional ∆η∆ϕ per-trigger-particle associated yield of charged hadrons for Pb-Pb collisions at √sNN = 2.76 TeV. Figure
taken from Ref. [53] (left). Integrated elliptic flow v2 as a function of
the collision energy [55,54]. Figure taken from Ref. [54] (right). . . . 22
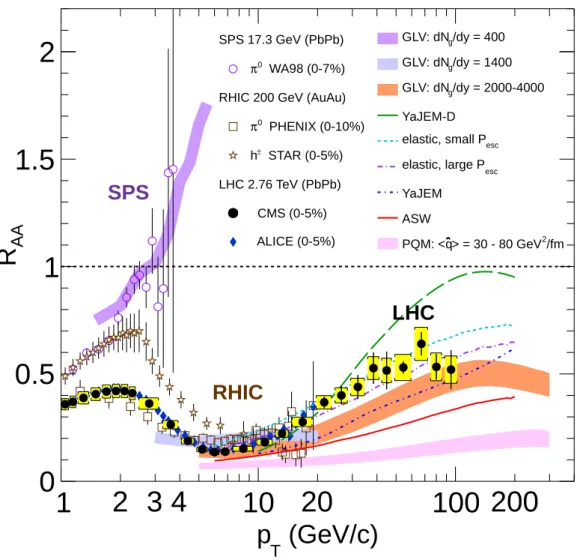
1.23 Nuclear modification factor RAA in central heavy-ion collisions at
three different√sNN, as a function of pT, for neutral pions (π0), and
charged particles [64,65], compared to several theoretical prediction-s [66, 67, 68, 69]. The error bars on the points are the statistical uncertainties, and the yellow boxes around the CMS points are the systematic uncertainties. The bands for several of the theoretical calculations represent their uncertainties. Figure taken from Ref. [64]. 23
1.24 Examples of factorization diagrams (left panel) and D+D− produc-tion in pp collisions via gg → cc (right panel). . . 24
1.25 Parton distribution function (PDF) via the Bjorken-x [31] in the pro-ton with Q2 = 5 GeV2 (CTEQ 4L PDF set used). Figure taken from Ref. [76]. . . 26
1.26 Schematic representation of the optical Glauber model geometry, with transverse (a) and longitudinal (b) views. Figure taken from Ref. [83]. 28
1.27 Left: ratios of nuclear parton distribution functions (nPDFs) fiA(x, Q2) with respect to the parton distribution functions (PDFs) of free nucleons fiN(x, Q2) as a function of Bjorken-x. Right: com-parison of the gluon shadowing parametrisations EKS98 [90], EP-S08 [91], nDS [92] at LO and EPS09 [93] at LO in a lead nucleus at Q2 = 1.69 GeV2. Figure taken from Ref. [93]. . . 30
1.28 Ratios of charged pions spectra in p-W collisions over that in p-Be collisions as a function pT. The results are normalized by the atomic number of the target nucleus. The curves are the parton model calcu-lation with kT broadening due to multiple parton scatterings. Figure
taken from Ref. [97]. . . 31
1.29 Left: diagram for collisional energy loss of a quark of energy E travers-ing a quark-gluon medium. Right: radiative energy loss of a quark of energy E traversing a quark-gluon medium. Figure taken from Ref. [98]. 32
1.30 Upper: comparison of the average radiative and elastic energy loss of light-quarks (left) and light- and heavy-quarks (right) passing through the medium produced in central Au-Au collisions at RHIC energies as obtained by the AMY [102] and DGLV [103] models. Bottom: fractional energy loss evaluated for collisional and radiative processes and for charm and beauty quarks, at T = 304 MeV, with Djordjevic model [104]. Figure taken from Ref. [98,105] . . . 34
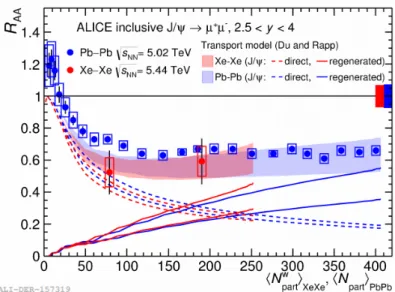
1.31 Inclusive J/Ψ RAA as a function of < Npart > at√sNN= 5.44 (5.02)
TeV in Xe-Xe and Pb-Pb collisions. Model calculations [106,107] are presented with dashed lines for direct J/Ψ and with straight lines for regenerated J/Ψ. The bands are the predictions for inclusive J/Ψ. Figure taken from Ref. [111]. . . 36
1.32 Υ RAA as a function of < Npart > in
√
sNN = 5.02 TeV Pb-Pb
collisions, compared to transport [108,109] and hydrodynamical [110] model calculations.. Figure taken from Ref. [111]. . . 36
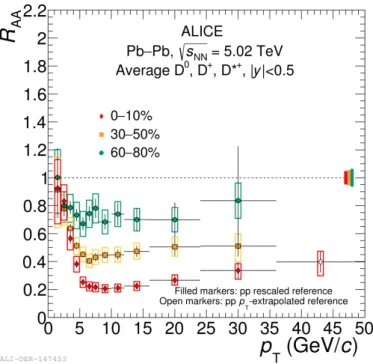
1.33 Non-strange D meson RAA (average of D0 , D+ and D∗+ RAA ) as a
function of pT in Pb-Pb collisions at√sNN= 5.02 TeV . Figure taken
1.34 Left: non-strange D-meson RAA (average of D0, D+ and D∗+ RAA)
[113] compared to the π [119] and charged-particles RAAas a function
of pTfor the 10 % most central Pb-Pb collisions at√sNN = 2.76 TeV.
Figure taken from Ref.[113]. Right: charged-particle (black squares), D mesons (green triangles) and non-prompt J/Ψ (blue circles) RAA
as function of centrality (< Npart >) for Pb-Pb collisions at √sNN=
2.76 TeV. Figure taken from Ref. [120,121]. . . 38
1.35 Upper: averaged non-strange D-meson v2 as a function of pT for Pb-Pb collisions at √sNN = 5.02 TeV and the centrality range 30–
50%. Bottom: averaged non-strange D meson RAA as a function of pT for Pb-Pb collisions at √sNN = 5.02 TeV and the centrality
range 0–10%. Both results are compared with theoretical models [124,125,126,127,128,129,130]. Figures taken from Ref. [122,123]. 40
1.36 Transverse momentum distribution of reconstructed tracks in the AL-ICE muon spectrometer after all selection cuts were applied. The dis-tributions were obtained from a PYTHIA simulation of pp collisions at √s = 7 TeV. Figure taken from Ref. [132]. . . 41
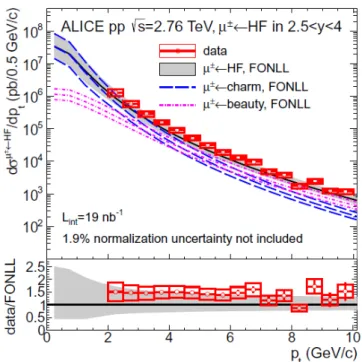
1.37 The pT-differential cross-section of muons from heavy-flavour decays, measured in pp collisions at √s = 2.76 TeV. Figure taken from Re-f. [133]. . . 41
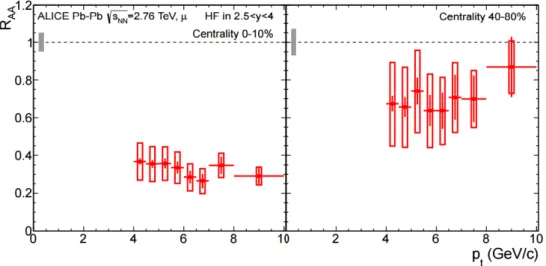
1.38 Nuclear modification factor as a function of transverse momentum for muons from heavy-flavour decay in the 0-10% central (left) and 40-80% peripheral (right) collisions. Figure taken from Ref. [133] . . 42
2.1 Left: a section of the LHC. Right: the LHC experiments and the preaccelerators. The path of the protons (and ions) begins at linear accelerators (marked p and Pb, respectively). They continue their way in the booster (the small unmarked circle), in the Proton Syn-chrotron (PS), in the Super Proton SynSyn-chrotron (SPS) and finally they get into the 27-km-long LHC tunnel. In the LHC there are 4 large experiments marked with yellow dots. Figures taken from Ref. [134]. . . 46
2.2 3-D view of the ALICE detector with its different sub-detectors in the LHC Run2. The insert shows the different sub-detectors surrounding the interaction point. The length of the ALICE detector is about 24 m. The two ZDC are located at more than 100 m from the interaction point. Figure taken from Ref. [151].. . . 48
2.3 Schematic representation of the forward detectors. The FMD rings (FMD1, FMD2 and FMD3) can be observed. The two V0 (A and C side) as well as the two T0 detectors are shown. Figure taken from Ref. [154]. . . 51
2.4 Distribution of the sum of amplitudes in the V0 scintillators in Pb-Pb collisions at 5.02 TeV. The distribution is fitted with the NBD-Glauber fit shown as a line. Figure taken from Ref. [157]. . . 52
2.5 Layout of ITS. Figure taken from Ref. [142] . . . 54
2.6 Layout of TPC. Figure taken from Ref. [143] . . . 54
2.7 Layout of the ALICE muon spectrometer. Figure taken from Ref. [158]. 57
2.8 The general layout of the upgraded ITS detector with respect to Fig. 2.5. Figure taken from Ref. [159]. . . 59
2.9 Layout of the MFT detector in ALICE (Left). Layout of the active area of the MFT detector (Right). Figures taken from Ref. [158]. . . 60
2.10 Expected transverse momentum distributions of single muons from charm (left) and beauty (right) decays with their respective statistical and systematic uncertainties. Figure taken from Ref. [158].. . . 61
2.11 ROOT framework and its application to high-energy physics experi-ments. Figure taken from Ref. [165]. . . 64
2.12 The AliRoot framework. Figure taken from Ref. [165]. . . 65
2.13 The event simulation and reconstruction chain. Figure taken from Ref. [165]. . . 66
2.14 The analysis framework. Figure taken from Ref. [165]. . . 67
2.15 The analysis framework of heavy-flavour decay muons. Figure taken from Ref. [166]. . . 68
3.1 Transverse momentum distributions of inclusive muons with different selection cuts at event and track level in pp collisions at √s = 5.02 TeV for MB (up, left), MSL (up, right) and MSH (bottom) triggered events. . . 71
3.2 Transverse momentum distributions of inclusive muons after all se-lection cuts are applied in pp collisions at √s = 5.02 TeV for MSL and MSH triggered events (left) and corresponding statistical uncer-tainties (right). . . 72
3.3 Left: transverse momentum distributions of inclusive muons after all selection cuts are applied in pp collisions at√s = 5.02 TeV for MSH triggered events. The distributions are shown for five sub-rapidity intervals mentioned in the figure. Right: corresponding statistical uncertainties. . . 72
3.4 L0b rates, run duration, number of interaction bunches and purity of minimum-bias trigger CINT7 as a function of run number. . . 74
3.5 Pile-up correction for CINT7 and COVTX minimum-bias triggers as a function of run number. . . 75
3.6 Normalization factors for MSL (upper) and MSH (bottom) triggers as function of run number. Green (black) symbols refer to offline (online) methods. . . 77
3.7 MSL (upper) and MSH (bottom) cross sections as function of run number. Green (back) symbols refer to offline (online) methods. . . . 78
3.8 Predicted FONLL pT and y distributions (back) for pp collisions at √
3.9 A × ε as a function of reconstructed (left) and generated (right) pT
from a simulation using as input a parameterization of pT and y
distributions from FONLL. . . 80
3.10 A × ε as a function of pTand rapidity for MSL (left) and MSH (right) data samples. . . 80
3.11 A × ε as a function of pT in various y intervals mentioned on the
figures for MSL and MSH triggers. Upper (lower) plots show the A × ε as a function of reconstructed (generated) pT. . . 81
3.12 Ratio of the pT distributions with MSL and MSH triggers after
nor-malization to the equivalent number of minimum-bias events and after applying the A × ε correction for the full rapidity range (left) and in various sub-rapidity intervals (right). . . 81
3.13 Mid-rapidity pp reference at √s = 5.02 TeV for charged pions and kaons [173]. . . 82
3.14 Mid-rapidity extrapolated charged π and K pT distributions.. . . 83
3.15 Systematic uncertainties of the extrapolated mid-rapidity charged π and K distributions. . . 84
3.16 Rapidity distribution charged π and K with pT > 2 GeV/c from
PYTHIA (left) and PHOJET (right) and corresponding polynomial fit. 84
3.17 Ratio of the charged π and K rapidity distributions for pT> 2 GeV/c from PYTHIA (left) and PHOJET (right) to that obtained with the polynomial function. . . 85
3.18 Rescaled ratio of the generated pTdistribution of charged π (left) and charged K (right) in different intervals relative to that within |y| < 0.8 from PYTHIA 8 simulations with various colour reconnection options. 85
3.19 Double ratio of the ratio of the generated pT distributio in a given rapidity interval to that in |y| < 0.8 for CR = 0 to the same ratio for CR =1 for charged π (left) and K (right). . . 86
3.20 Relative production probability as a function of (zv) in 2.5 < y < 4
for charged decay π and K, and several pTcuts mentioned in the figure. 87
3.21 Relative production probability as a function of (zv) in 2.5 < y < 4 for
muons from charged π and K with PHOJET (left) and comparisons between PYTHIA and PHOJET (right). . . 87
3.22 Parameterization of the relative production probability as a function of zv in 2.5 < y < 4 for charged π (left) and charged K (right) with
pT > 2 GeV/c. . . 88
3.23 Comparison of the pTdistribution of muons from pion (left) and kaon (right) decays using a sharp cut on zv and the parameterization for
the description of the absorber effect in the fast simulations. . . 88
3.24 Comparison of the pTdistribution of muons from charged π (left) and charged K (right) obtained using the absorber effect parameterization and the polynomial function of the rapidity extrapolation. . . 89
3.25 Comparison of the pTdistribution of muons from charged π (left) and charged K (right) obtained using the absorber effect parameterization and the two strategies for the rapidity extrapolation. . . 89
3.26 Comparison of the pTdistribution of muons from charged π (left) and
K (right) using the new strategy for both absorber description and rapidity extrapolation and different model parameters. . . 90
3.27 Estimated distributions of muons from charged pion and kaon decays (left) and associated systematic uncertainties (right) in 2.5 < y < 4.. 90
3.28 Estimated distributions of muons from charged pion and kaon decays and measured inclusive muon distributions (top), and associated frac-tion of muons from charged pion and kaon decays relative to inclusive muons (bottom) in 2.5 < y < 4. . . 91
3.29 Estimated distributions of muons from charged pion and kaon decays and measured inclusive muon distributions, and associated fraction of muons from charged pion and kaon decays relative to inclusive muons for the rapidity intervals 2.5 < y < 2.8 (top, left), 3.1 < y < 3.4 (top, right) and 3.7 < y < 4 (bottom). . . 92
3.30 pT (top, left) and y (top, right) distributions of W± and Z/γ∗ decay
muons in the 4π acceptance and corresponding pT distribution in 2.5 < y < 4. . . 93
3.31 Fraction of muons from W and Z/γ∗ decays as a function of pT with respect to muons from heavy-flavour hadron decays from FONLL (left) and with respect to inclusive muons (right) in 2.5 < y < 4. . . 93
3.32 Fraction of muons from W/Z/γ∗ decays as a function of pT with respect to inclusive muons in three sub-rapidity intervals mentioned on the figures. . . 94
3.33 pT-differential µ−/µ+ratio before (left) and after (right) the subtrac-tion of muons from W and Z/γ∗ decays in 2.5 < y < 4. . . 95
3.34 pT- and y-differential production cross sections of J/ψ. The pT and y distributions are measured by ALICE in 2.5 < y < 4 and pT <
12 GeV/c. Polynomial or Gaussian fits are used for the rapidity extrapolation. . . 96
3.35 pT distribution of muons from J/ψ decays (up, left) and
correspond-ing systematic uncertainty (up, right), and fraction with respect to inclusive muons (bottom). . . 96
3.36 Fraction of muons from J/ψ decays with respect to inclusive muons as a function of pT in various rapidity bins: 3.4 < y < 3.7 (upper, left), 3.1 < y < 3.4 (upper, right), 2.5 < y < 2.8 (bottom). . . 97
3.37 Estimated background fraction with respect to inclusive muons as a function of pT for the interval 2.5 < y < 4 in pp collisions at √s = 5.02 TeV. Statistical uncertainties (vertical bars) and systematic uncertainties (boxes) are shown. . . 98
3.38 Corrected pT-differential µ+/µ− ratio to the same ratio with σshift = 0 for MSL (left) and MSH (right) events.. . . 100
3.39 Ratio of the corrected pT-differential µ+/µ− ratio with various σshift values. . . 101
3.40 Ratio of the corrected pT-differential distribution of muons from heavy-flavour hadron decays with σshift = 0 to that with σshift = 1,2
for MSL and MSH triggered events in left and right panel, respectively.101
3.41 Ratio of the corrected pT-differential distribution of muons from
hevay-flavour hadron decays with σshift = 0 to that with σshift = 1,2 for MSH-triggered events in various rapidity intervals. . . 102
3.42 Systematic uncertainty sources as a function of pT in the full range range (2.5 < y < 4). . . 103
3.43 The production cross sections of muons from charm and beauty de-cays from FONLL predictions in 2.5 < y < 4, in pp collisions at √
s = 5.03 TeV. . . 103
3.44 The rescaled ratios of production cross sections with respect to the central values for µ ← charm (left) and µ ← bottom (right) from FONLL predictions in 2.5 < y < 4, in pp collisions at√s = 5.03 TeV. 104
3.45 pT-differential cross sections of muons from heavy-flavour hadron
de-cays in 2.5 < y < 4 compared with FONLL calculations. . . 106
3.46 Comparison of the pT-differential cross sections of muons from
heavy-flavour hadron decays measured with the 2015 pp sample and using both pp data at √s = 7 TeV and FONLL predictions. . . 107
3.47 Systematic uncertainty on the pT-differential cross section of muons from heavy-flavour hadron decays using both pp data at√s = 7 TeV and FONLL predictions. . . 107
3.48 Production cross section of muons from heavy-flavour hadron decays as a function of rapidity for the pT intervals 2 < pT < 7 GeV/c
(left) and 7 < pT < 20 GeV/c (right), and comparisons with FONLL calculations. The plots in the bottom part of the figures show the data/FONLL ratio. . . 108
3.49 Production cross section of muons from heavy-flavour hadron decays as a function of pT for five rapidity intervals within 2.5 < y < 4 and comparisons with FONLL calculations. . . 109
3.50 Data/FONLL ratios as a function of pT for the five rapidity intervals within 2.5 < y < 4. . . 110
3.51 Ratio of the pT-differential production cross section of muons from heavy-flavour hadron decays at forward rapidity in pp collisions at√s = 7 TeV to that at √s = 5.02 TeV. Statistical uncertainties (bars) and systematic uncertainties (boxes) are shown. The uncertainties on luminosity at the two centre-of mass energies are not included. The ratio is compared with FONLL predictions. . . 111
3.52 Ratio of the pT-differential production cross section of muons from heavy-flavour hadron decays in pp collisions at √s = 5.02 TeV in 3.7 < y < 4 to that in 2.5 < y < 2.8. Statistical uncertainties (bars) and systematic uncertainties (boxes) are shown. The uncertainties on luminosity at the two centre-of mass energies are not included. The ratio is compared with FONLL predictions. . . 112
3.53 Left: FONLL scaling factor from 5.02 TeV to 5.44 TeV for the mea-surement of the pT-differential cross section of muons from
heavy-flavour hadron decays with different combinations of quark masses indicated on the figure; Right: corresponding relative systematic un-certainty. . . 113
3.54 Left: FONLL scaling factor from 5.02 TeV to 5.44 TeV for the mea-surement of pT-differential cross section of muons from heavy-flavour
hadron decays with different combinations of QCD scales as indicated on the figure; Right: corresponding relative systematic uncertainty. . 113
3.55 Left: FONLL scaling factor from 5.02 TeV to 5.44 TeV for the mea-surement of the pT-differential cross section of muons from heavy-flavour hadron decays with different combinations of QCD scales (red boxes) and quark masses (blue boxes). The yellow band is the total systematic uncertainty. Right: corresponding relative systematic un-certainty. . . 114
3.56 Left: pT-differential cross section of muons from heavy-flavour hadron
decays in pp collisions at √s = 5.02 TeV and 5.44 TeV from FON-LL. Right: pT-differential cross section of muons from heavy-flavour
hadron decays in pp collisions at√s = 5.44 TeV. . . 114
3.57 pp reference at 2.76 TeV in the forward rapidity region. . . 115
4.1 Upper: centrality distribution of MB, MSL and MSH triggers in Pb– Pb collisions at √sNN = 5.02 TeV. Bottom: ratio between 0–10%
and 0–90% centrality classes in MB collisions as a function of the run number, starting from last run of the LHC15o period. . . 119
4.2 Transverse momentum distributions of inclusive muons with different selection cuts at event and track level in Pb–Pb collisions at √sNN
= 5.02 TeV (centrality class: 0–90%) for MSL (left) and MSH (right) triggers. . . 119
4.3 Inclusive muon pT distribution after selection cuts (upper panels)
and statistical uncertainty in each pT bin (lower panels), in Pb-Pb
collisions at √sNN = 5.02 TeV (left plots: 0–10% centrality class,
right plots: 60–90% centrality class). . . 121
4.4 Transverse momentum distributions of inclusive muons with different selection cuts at event and track level in Pb–Pb collisions at√sNN =
4.5 Inclusive muon pT distribution after selection cuts in various central-ity classes in Pb–Pb collisions at √sNN = 2.76 TeV. (left: 0-10%,
right: 60-80%) . . . 122
4.6 Normalization factor as a function of run number (starting from last run of the LHC15o period), to obtain the equivalent number of MB events in Pb–Pb collisions in Pb–Pb collisions at √sNN = 5.02 TeV
for MSL (upper panel) and MSH (lower panel) triggers. . . 124
4.7 Purity of accepted MB, MSL, MSH trigger events that pass the of-fline event selection versus run number (starting from the last run in LHC15o period) in Pb–Pb collisions at√sNN = 5.02 TeV. . . 125
4.8 Ricorr ratio of events in the 60–70% centrality class to that in the 0– 70% centrality class versus run number (starting from the last run in LHC15o period) in Pb-Pb collisions at √sNN = 5.02 TeV. . . 126
4.9 Number of events for MB. semi-central and central triggers in Pb–Pb collisions at √sNN = 2.76 TeV . . . 128
4.10 Run by run uncorrected normalization factor for MSL from MB (top), central (middle) and semi-central (bottom) triggers in Pb–Pb colli-sions at √sNN = 2.76 TeV.. . . 130
4.11 Run by run uncorrected normalization factor for MSH from MB (top), central (middle) and semi-central (bottom) triggers in Pb–Pb colli-sions at √sNN = 2.76 TeV.. . . 131
4.12 Acceptance × efficiency as a function of run number for the low pT
trigger cut in Pb–Pb collisions at√sNN = 5.02 TeV. . . 132
4.13 Left: acceptance × efficiency as a function of pT in the 0–10%
cen-trality class for MSL and MSH triggers in Pb–Pb collisions at√sNN
= 5.02 TeV. Right: pT-integrated (2 < pT < 20 GeV/c) acceptance × efficiency as a function of centrality for MSL trigger in Pb–Pb collisions at √sNN = 5.02 TeV. . . 133
4.14 Ratio of A × ε in a given centrality class to that in the 60–90% cen-trality class as a function of a minimum pTfor MSL trigger in Pb–Pb
collisions at √sNN = 5.02 TeV. . . 134
4.15 A × ε as a function of reconstructed (left) and generated (right) pTin Pb–Pb collisions at√sNN = 5.02 TeV. The simulation uses as input
a parameterization of pT and y distributions from FONLL calculations.135
4.16 Ratio of the pT distributions between MSL and MSH triggers after normalization to the equivalent number of minimum-bias events and after applying the A×ε correction for the 0–90% centrality class (left) and, in various centrality classes (right) in Pb–Pb collisions at√sNN
4.17 Left: Acceptance × efficency with MSL and MSH (left) as a function of pT in Pb–Pb collisions at
√
sNN = 2.76 TeV. Right: ratio of the
pT distributions between MSL and MSH triggers after normalization
to the equivalent number of MB events and after applying the accep-tance × efficiency correction in Pb-Pb collisions at√sNN= 2.76 TeV.
. . . 136
4.18 Charged pions measured at mid-rapidity (left) and charged kaons measured at mid-rapidity (right) in Pb–Pb collisions at√sNN = 5.02
TeV with ALICE. Figure taken from Ref. [204] . . . 137
4.19 pT extrapolation of charged π (left) and charged K (right) measured at mid-rapidity in Pb–Pb collisions at√sNN = 5.02 TeV with ALICE. 138
4.20 Rapidity distribution charged π and K with pT > 3 GeV/c from
PYTHIA (upper, left) and PHOJET (upper, right) and correspond-ing polynomial fit in Pb–Pb collisions at√sNN= 5.02 TeV. PYTHIA8
simulation of the double ratio of the ratio of the generated pT
dis-tribution in a given rapidity interval to that in |y| < 0.8 for colour reconnection option (CR) = 0 to the same ratio for CR =1 for charged π (bottom, left) and K (bottom, right) in pp collisions at √s = 5.02 TeV. . . 139
4.21 Comparison of the pTdistribution of muons from charged π (left) and charged K (right) decays obtained using the absorber effect parame-terization and the polynomial function of the rapidity extrapolation in central(0-10%) Pb–Pb collisions at √sNN = 5.02 TeV. . . 140
4.22 Comparison of the pT distribution of muons from charged π (left) and charged K (right) decays obtained using the absorber effect pa-rameterization and the two strategies (QCD and MPI setting) for the pT-dependent rapidity extrapolation in central (0-10%) Pb–Pb collisions at √sNN = 5.02 TeV. . . 140
4.23 Comparison of the pTdistribution of muons from charged π (left) and
K (right) decays using the new strategy for both absorber description and rapidity extrapolation and different model parameters in central (0-10%) Pb–Pb collisions at√sNN = 5.02 TeV. . . 141
4.24 Estimated fraction of muons from charged pion and kaon decays rela-tive to inclusive muons as a function of pTfor various centrality classes
in Pb-Pb collisions at√sNN= 5.02 TeV (upper). Estimated
distribu-tions of muons from charged pion and kaon decays (bottom left) and associated systematic uncertainties (bottom right) in 2.5 < y < 4 in central (0-10%) Pb–Pb collisions at √sNN = 5.02 TeV. . . 142
4.25 Charged pions (left) and charged kaon (right) measured at mid-rapidity with ALICE in Pb–Pb collisions at √sNN = 2.76 TeV [205].
4.26 Rapidity distribution of charged π (upper, left) and K (upper, right) with pT > 3 GeV/c from PYTHIA6 and corresponding polynomial
fit in pp collisions at √sNN = 2.76 TeV. Double ratio of the ratio
of the generated pT distribution in a given rapidity interval to that in |y| < 0.8 for CR = 0 to the same ratio for CR =1 for charged π (bottom, left) and K (bottom, right) in pp collisions at√sNN= 2.76
TeV with PYTHIA8 simulations. . . 143
4.27 Background fraction of charged π decay muons (upper, left) and K decay muons (upper, right) with respect to inclusive muons in cen-tal (0-10%) Pb-Pb collisions at √sNN = 2.76 TeV and systematic
corresponding systematic uncertainties (bottom). . . 144
4.28 Top: W-boson decay µ+ pTdistributions with CT10nlo and CTEQ6l
PDF sets with EKS98 nuclear modification (left) and with CT10nlo with EKS98 and EPS09NLO nuclear modification (right). Middle: W-boson decay µ− pT distributions. Bottom: Z/γ∗-boson decay
muon pT distribution. All plots are simulated in rapidity interval
2.5 < y < 4 for Pb–Pb collisions at√sNN = 5.02 TeV. . . 145
4.29 Yields and fractions of W,Z/γ∗decay muons with respect to inclusive muons as a function pT at forward rapidity (2.5 < y < 4) in Pb-Pb
collisions at √sNN = 5.02 TeV. . . 146
4.30 Top: systematic uncertainty on W+ (left) and W− (right) decay muons for Pb–Pb collisions at√sNN= 5.02 TeV. Bottom: Z/γ∗decay
muon systematic uncertainty for Pb–Pb collisions at√sNN= 5.02 TeV.147
4.31 µ−/µ+ ratio as a function of pT before (left) and after (right) the subtraction of muons from W and Z/γ∗ decays in central Pb–Pb collisions at √sNN = 5.02 TeV. . . 148
4.32 J/ψ pTdistributions measured at forward rapidity in Pb–Pb collision-s at √sNN = 5.02 TeV (upper left) extrapolated to higher pT using
a power-law function (bottom left), y distributions measured at for-ward rapidity pp collisions at√s = 5.02 TeV (bottom right), the J/ψ pT distributions measured at forward rapidity in Pb–Pb collisions at
√
sNN = 2.76 TeV (upper right). . . 148
4.33 Fraction of J/ψ decay muons with respect to inclusive muons as a function pT and corresponding systematic uncertainty in central
(0-10%) Pb-Pb collisions at√sNN = 5.02 TeV (top) and 2.76 TeV
(bot-tom). . . 150
4.34 Uncertainty on track resolution affecting the RAA of heavy-flavour
decay muons for 0-10% and 60-80% centrality classes in Pb-Pb colli-sions at √sNN = 5.02 TeV.. . . 151
4.35 Various systematic uncertainty sources affecting the RAA
measure-ment in the 0–10% centrality class which are combined (Uncertainty on track resolution (misalignment) is not considered) in Pb-Pb colli-sions at √sNN = 5.02 TeV.. . . 154
5.1 Normalized and corrected pT-differential yields of muons from heavy-flavour hadron decays in Pb–Pb collisions at√sNN = 5.02 TeV. The
distributions are shown in various centrality inervals mentioned in the figure. . . 158
5.2 RAAof muons from heavy-flavour hadron decays in various centrality
classes in the range 0–80% for Pb–Pb collisions at√sNN = 5.02 TeV.
Vertical bars are the statistical uncertainties. Open boxes represent the systematic uncertainties, except the systemactic uncertainty on normalization which is shown in full boxes at RAA = 1. . . 159
5.3 Nuclear modification factor of muons from heavy-flavour hadron de-cays as a function of pT for p-Pb collisions at √sNN = 5.02 TeV at
forward rapidity (2.03 < ycms < 3.53) compared to model
prediction-s [186,212,218]. Figure taken from Ref. [214].. . . 160
5.4 RAA as a function of hNparti for muons from heavy-flavour hadron
decays in Pb–Pb collisions at √sNN = 5.02 TeV. The distributions
are shown in various pT intervals mentioned in the figure. For each
centrality class, the set of points for the different pT intervals are displaced horizontally for better visibility. . . 161
5.5 RAAof muons from heavy-flavour hadron decays in various centrality
classes in the range 0–10% and 60-80% for Pb–Pb collisions at√sNN
= 2.76 TeV. . . 162
5.6 RAA as a function of hNparti for muons from heavy-flavour hadron
decays in Pb-Pb collisions at √sNN = 2.76 TeV. The distributions is
shown in 6 < pT < 12 GeV/c. . . 162
5.7 Comparison of the RAA of heavy-flavour decay muons based on the analysis of MSL(MSH) trigger events collected during the 2011 run, with the published heavy-flavour decay muon RAAbased on the
anal-ysis of minimum-bias trigger events that were collected during the 2010 run of Pb-Pb collisions at√sNN= 2.76 TeV.. . . 163
5.8 Comparison of the pT-differential RAA of muons from heavy-flavour hadron decays in Pb–Pb collisions at√sNN = 5.02 TeV with that
ob-tained at√sNN= 2.76 TeV for central collisions (top) and peripheral
collisions (bottom). . . 164
5.9 Upper: comparison of RAA of heavy-flavour decay muons at forward
rapidity and heavy-flavour decay electrons at mid-rapidity in Pb-Pb collisions at√sNN= 2.76 TeV. Bottom: comparison of RAAof
heavy-flavour decay muons at forward rapidity and heavy-heavy-flavour decay elec-trons at mid-rapidity in Pb-Pb collisions at √sNN= 5.02 TeV. . . 165
5.10 Nuclear modification factor of muons from heavy-flavour hadron de-cays as a function of pT for Pb-Pb collisions at √sNN = 2.76 TeV at
5.11 pT-differential of the RAAof muons from heavy-flavour hadron decays in 10% most centrality class at √sNN = 2.76 TeV and
√
sNN = 5.02
TeV compared with SCET (Vitev) model [218]. SCET predictions are shown without cold nuclear effect (upper panel) and with cold nuclear effect (bottom panel), separately.. . . 167
5.12 pT-differential RAAof heavy flavour decay muon compared with
PHS-D [219,220] (upper) and TAMU model [217] (middle), and with M-C@sHQ + EPOS2 model [221,222] (bottom) model predictions. Note that the pT-differential RAA of muons from heavy-flavour hadron
de-cays is measured in the 10% most centrality Pb-Pb collisions at√sNN
= 2.76 TeV and√sNN= 5.02 TeV. Model predictions are also shown
for µ←c and µ←b, separately . . . 171
5.13 pT-differential RAA of muons from heavy-flavour hadron decays in 0-10%, 20-40%, 60-80% centrality classes at√sNN = 5.02 TeV
com-pared with models. SCET model [218] predictions include cold nu-clear effects (upper panel). The upper curves of MC@sHQ + EPOS2 model [221,222] predictions include collisional energy loss processes while the lower curves include both collisional and radiative energy loss processes (bottom panel). . . 172
5.14 pT-differential RAA of muons from heavy-flavour hadron decays in 0-10%, 20-40%, 60-80% centrality classes at√sNN= 5.02 TeV compared
with MC@sHQ + EPOS2 model [221, 222]. The model predictions are presented for µ ←b,c and µ ←b and µ ←c. . . 173
6.1 Centrality distribution with MB, MSL triggers. . . 175
6.2 Transverse momentum distributions of inclusive muons with different selection cuts at event and track level in Xe-Xe collisions (centrality class: 0–90%) for MB (left) and MSL-triggered (right) events. . . 175
6.3 Inclusive muon pT distribution with MSL trigger after selection cuts in various centrality classes in Xe–Xe collisions. . . 176
6.4 Parameterization of pT and y distributions from FONLL predictions
used as inPuts of simulations for the estimation of A × ε. . . 179
6.5 A × ε as a function of reconstructed pT from a simulation using as
input a parameterization of pT and y distributions from FONLL. . . 180
6.6 Ratio of A × ε in a given centrality class to that in the 60–90% cen-trality class as a function of a minimum pT for MSL trigger. . . 180
6.7 Left: pT distributions of inclusive muons with MB and MSL triggers after normalization to the equivalent number of minimum-bias events and after applying the A × ε correction for the 0–90% centrality class. Right: ratio between the two distributiions. . . 182
6.8 Mid-rapidity pT distributions of charged pions and kaons measured in Xe-Xe collisions at√sNN = 5.44 TeV [232]. . . 183
6.9 Estimated pT-differential distributions of muons from charged pio-n apio-nd kaopio-n decays (left) apio-nd correspopio-ndipio-ng systematic upio-ncertaipio-nty sources (right) in central Xe–Xe collisions at√sNN = 5.44 TeV. . . . 184
6.10 Estimated fraction of muons from charged pion and kaon decays rel-ative to inclusive muons as a function of pT for various centrality
classes in Xe–Xe collisions at√sNN = 5.44 TeV. . . 185
6.11 Fraction of J/ψ decay muons with respect to inclusive muons as a function pT at forward rapidity in central Pb-Pb collisions at
√ sNN
= 5.02 TeV. . . 185
6.12 Various systematic uncertainty sources affecting the normalized pT -differential yields of muons from heavy-flavour hadron decays in the 0–10% centrality class added in quadrature to obtain the total sys-tematic uncertainty. . . 188
6.13 Normalized and corrected pT-differential yields of muons from heavy-flavour hadron decays in Xe–Xe collisions at √sNN = 5.44 TeV. The
distributions are shown in various centrality intervals mentioned in the figure. See the text for details. . . 188
6.14 RAAof muons from heavy-flavour hadron decays in various centrality
classes in the range 0–80% for Pb–Pb collisions at√sNN = 5.44 TeV.
Vertical bars are the statistical uncertainties. Open boxes represent the systematic uncertainties, except the systemactic uncertainty on normalization which is shown as full boxes at RAA = 1. . . 189
6.15 RAA as a function of hNparti for muons from heavy-flavour hadron decays in Xe–Xe collisions at√sNN = 5.44 TeV. The systematic
un-certainties which are fully correlated between bins (pp reference, nor-malization) are shown as full boxes. See the text for details. . . 190
6.16 Comparison of the pT-differential RAA of muons from heavy-flavour hadron decays in the 10% most central Xe–Xe collisions at √sNN =
5.44 TeV with that obtained in Pb–Pb collisions at√sNN= 5.02 TeV
for the centrality classes 0–10%, 10–20%. . . 191
6.17 Comparison of the pT-differential RAA of muons from heavy-flavour
hadron decays in the central and semi-central Xe–Xe collisions at √
sNN = 5.44 TeV with that obtained at mid-rapidity for
heavy-flavour hadron decay electrons. . . 191
6.18 Comparison of the pT-differential RAA of muons from heavy-flavour
hadron decays in Xe–Xe collisions at √sNN = 5.44 TeV with
predic-tions from PHSD model [219,220]. . . 192
6.19 The pT-differential RAA of muons from heavy-flavour hadron decays
in Xe-Xe (centrality:0-10%) collisions at 5.44 TeV in comparison with that in Pb-Pb (centrality:10-20%) collisons at 5.02 TeV. Comparisons with PHSD model are also shown. . . 192
6.20 Path-length sensitive suppression ratio RXePbL for the centrality class: 0-10% (top), 10-20% (bottom, left) and 20-40% (bottom, right). The dashed lines are for factor b = 0.5, 1, 2, and 3, respectively. see the text for details. . . 194

![Figure 1.30: Upper: comparison of the average radiative and elastic energy loss of light-quarks (left) and light- and heavy-quarks (right) passing through the medium produced in central Au-Au collisions at RHIC energies as obtained by the AMY [102]](https://thumb-eu.123doks.com/thumbv2/123doknet/14529335.723326/73.892.153.718.260.836/figure-comparison-average-radiative-produced-collisions-energies-obtained.webp)