RESEARCH OUTPUTS / RÉSULTATS DE RECHERCHE
Author(s) - Auteur(s) :
Publication date - Date de publication :
Permanent link - Permalien :
Rights / License - Licence de droit d’auteur :
Institutional Repository - Research Portal
Dépôt Institutionnel - Portail de la Recherche
researchportal.unamur.be
University of Namur
A mathematical framework to quantify the masking effect associated with the
confidence intervals of measures of disproportionality
Maignen, François; Hauben, Manfred; Dogné, Jean Michel
Published in:Therapeutic Advances in Drug Safety
DOI:
10.1177/2042098617704143 Publication date:
2017
Document Version
Publisher's PDF, also known as Version of record
Link to publication
Citation for pulished version (HARVARD):
Maignen, F, Hauben, M & Dogné, JM 2017, 'A mathematical framework to quantify the masking effect associated with the confidence intervals of measures of disproportionality', Therapeutic Advances in Drug
Safety, vol. 8, no. 7, pp. 231-244. https://doi.org/10.1177/2042098617704143
General rights
Copyright and moral rights for the publications made accessible in the public portal are retained by the authors and/or other copyright owners and it is a condition of accessing publications that users recognise and abide by the legal requirements associated with these rights. • Users may download and print one copy of any publication from the public portal for the purpose of private study or research. • You may not further distribute the material or use it for any profit-making activity or commercial gain
• You may freely distribute the URL identifying the publication in the public portal ? Take down policy
If you believe that this document breaches copyright please contact us providing details, and we will remove access to the work immediately and investigate your claim.
https://doi.org/10.1177/2042098617704143 https://doi.org/10.1177/2042098617704143 Ther Adv Drug Saf
2017, Vol. 8(7) 231 –244 DOI: 10.1177/ 2042098617704143 © The Author(s), 2017. Reprints and permissions: http://www.sagepub.co.uk/ journalsPermissions.nav
Therapeutic Advances in Drug Safety
Introduction
The quantitative methods based on dispropor-tionality analysis (DA) [the relative reporting ratio (RRR), proportional reporting ratio (PRR) and reporting odds ratio (ROR)] are widely used in signal detection. In particular, the lower bound of the confidence intervals of these measures of disproportionality is popular in signal detection activities as it makes a signal of disproportionate reporting (SDR) less likely when the statistics are based on a small number of reports – that is, it is
one approach to mitigate the false-positive
bur-den in DA.1–3 Recent studies have highlighted
the importance of the database for the perfor-mance of the methods used to perform the signal
detection.4
The masking (or cloaking or competition bias effect) of the quantitative methods of signal detec-tion is a collateral effect of the data-mining algo-rithms which are based on DA, which was first described by Evans in his seminal study published
A mathematical framework to quantify
the masking effect associated with the
confidence intervals of measures of
disproportionality
François Maignen, Manfred Hauben and Jean-Michel Dogné
Abstract
Background: The lower bound of the 95% confidence interval of measures of
disproportionality (Lower95CI) is widely used in signal detection. Masking is a statistical issue by which true signals of disproportionate reporting are hidden by the presence of other medicines. The primary objective of our study is to develop and validate a mathematical framework for assessing the masking effect of Lower95CI.
Methods: We have developed our new algorithm based on the masking ratio (MR) developed
for the measures of disproportionality. A MR for the Lower95CI (MRCI) is proposed. A simulation study to validate this algorithm was also conducted.
Results: We have established the existence of a very close mathematical relation between
MR and MRCI. For a given drug–event pair, the same product will be responsible for the highest masking effect with the measure of disproportionality and its Lower95CI. The extent of masking is likely to be very similar across the two methods. An important proportion of identical drug–event associations affected by the presence of an important masking effect is revealed by the unmasking exercise, whether the proportional reporting ratio (PRR) or its confidence interval are used.
Conclusion: The detection of the masking effect of Lower95CI can be automated. The real
benefits of this unmasking in terms of new true-positive signals (rate of true-positive/false-positive) or time gained by the revealing of signals using this method have not been fully assessed. These benefits should be demonstrated in the context of prospective studies.
Keywords: adverse drug reactions reporting systems, masking, pharmacovigilance,
postmarketing, product surveillance, signal, signal detection
Received: 3 October 2016; revised manuscript accepted: 18 March 2017.
Correspondence to:
François Maignen,
Office of Health Economics, Southside, 105 Victoria Street, London SW1E 6QT, UK
[email protected] Manfred Hauben,
Pfizer Inc. New York, NY, USA
New York University School of Medicine Jean-Michel Dogné, Department of Pharmacy-NTHC-NARILIS, FUNDP, University of Namur, Namur, Belgium Original Research
in 2001.5–13 The masking is an effect by which an
SDR5,14 for a given drug–event pair identified by
quantitative methods might be suppressed because of the presence of another product in the same spontaneous reporting system database character-ized by disproportionate reporting for the event of interest. To our knowledge, only two studies have estimated the extent and magnitude of the masking associated with the use of a disproportionality measure on two spontaneous reporting system
databases, both using a mathematical algorithm.7,8
The public health impact of the masking is cur-rently unknown, but some studies conducted on large databases have shown that rarely reported events, often of public health importance, were
mostly affected by the masking.7 In addition, an
increasing number of studies tend to show that removing masking products can reveal signals of
potential public health importance.7,8,10 For that
reason, recent PROTECT-IMI good signal detection practices have recommended the use of an unmasking algorithm if the masking effect is a
concern or is substantial.4 IMI-PROTECT was a
multinational research consortium composed of experts from academia, industry and health care. Its goal was the development of innovative tools to enhance the early detection and assessment of adverse drug reactions (ADRs). Its recommenda-tions concerning masking were not prescriptive, being more of the nature of points for organiza-tions to consider if contemplating implementa-tion of masking/unmasking exercises on a global level or at the level of individual drug–event pairs. The masking effect was originally associated with the (point pseudo-estimates of the) measures of disproportionality based on DA, such as the RRR, PRR and ROR, but not with their confidence
intervals.6,15 Recent attempts have been made to
develop an algorithm for the identification and quantification of the masking effect associated with the use of confidence intervals of measures
of disproportionality.11 These empirical studies
have suggested the existence of a link between the masking effects associated with the measures of disproportionality and their respective confidence interval without producing any formal algorithm to quantify this effect in spontaneous system reporting databases. The recent approaches used to assess the impact and effect of masking associ-ated with the use of the lower bound of the 95% confidence interval (Lower95CI) of the ROR on spontaneous reporting system databases mostly
rely on empirical knowledge.12
We have recently proposed an algorithm aimed at identifying the direction and magnitude of the
masking effect associated with these measures.9
This algorithm is based on the use of a simple intu-itive metric called the masking ratio (MR). The MR provides a direct way to assess the direction (there is a masking effect if MR > 1, a revealing effect if MR < 1) and the magnitude of the mask-ing effect (the value of the disproportionality will be multiplied by the value of the MR if the mask-ing product for which it has been computed is removed from the analysis). However, there is cur-rently no equivalent algorithm for the lower bound of the 95% confidence interval (Lower95CI). We have developed a new mathematical algo-rithm based on the framework developed for the measures of disproportionality – the MR, which has been extended to the masking associated with the Lower95CI. We are proposing a varia-ble called the MR for the lower bound of the 95% confidence interval (MRCI). This variable can be computed for all measures of dispropor-tionality (Lower95CI for either RRR, PRR or ROR). We have explored the relation between the masking mechanisms associated with the measures of disproportionality and their respec-tive confidence intervals. We discuss the conse-quences of this relation as well as the practical computational aspects associated with the implementation of this algorithm.
Materials and methods
Considering a product (A) for which a DA is conducted, and a given masking product (B) and an event (E) of interest, we have previously defined the MR is defined as the ratio of the measures of disproportionality for product A,
before (RRRA, PRRA or RORA) and after
(RRRA(withoutB), PRRA(withoutB) or RORA(withoutB))
the deletion of product B (Table 1):9
MR=MD
MD
A without B) A (with B) (
We have used the same rationale to devise a ratio that returns the exact value of the masking associ-ated with a masking product B when the lower bound of the 95% confidence interval is used as a quantitative measure of signal detection to com-pute SDRs for product A. The MRCI is a confi-dence interval-based disproportionality metric calculated from a revised contingency table that
isolates the masking product (Table 1). We sim-ply divide the value of the lower bound of the 95% confidence interval before and after the removal of masking product B (Table 1) to obtain the exact value of the MR associated with the use of the confidence interval. We therefore define the MRCI for the Lower95CI for any of the measures of disproportionality (RRR, PRR or ROR) as follows:
MRCI=Lower 95CI MD
Lower 95CI MD
A without B) A (with B) (
(1) A masking effect is present when MRCI is >1. The direction and magnitude of the masking is given directly by the value of MRCI. The compu-tation can be performed at the drug–event level
(Table 1) or at the report level (Table 2).5,9 We
have tested and validated our algorithm using a simulation of over 2,000,000 contingency tables and applied the different scenarios of allocation of
the reports containing both the product of inter-est (A) and the masking product (B). The range of values selected for the different cells of the con-tingency table and the percentage of reports in common between the product of interest, prod-uct A, and the masking prodprod-uct, B, are displayed in Table 3. The number of simulated reports sup-posed to contain both products A and B were allocated to product A. We have used the PRR for
our analyses of disproportionality.8,9,16 The exact
MR for the PRR was used to perform all the com-putations of the MR for the lower confidence limit (Table 4). For each combination of the sim-ulated values, we have calcsim-ulated the initial PRR
for the product A (PRRA) and the unmasked
PRRA(WithoutProductB) (after removal of the masking product B), the confidence interval for the PRR
before (Lower95CI PRRA) and after (Lower95CI
PRRA[after]) the removal of the masking product
as well as the corresponding MRs (MR for the
PRRA), observed MRCI (Equation 1) and
calcu-lated MRCI (Equation 3).
Table 1. Contingency table for the computation (at the drug–event level) of measures of disproportionality in the presence of a masking medicinal product. It includes two products: one for which the disproportionality analysis is performed (A) and a masking product (B). The nij correspond to the number of records involving the drug–event combinations present in the database.
Event (E) of interest Other events Total
Records containing Product A n11 n12 n1.
Records containing product B (masking) n21 n22 n2.
All other products in the database
(excluding both A and B) n31 n32 n3.
Total n.1 n.2 n..
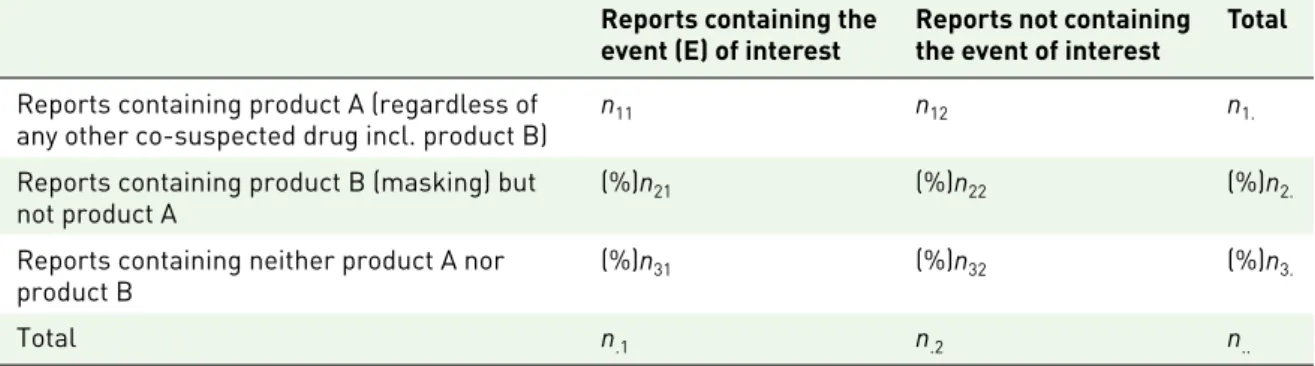
Table 2. Contingency table for the computation (at the report level) of measures of disproportionality in the presence of a masking medicinal product. It includes two products: one for which the disproportionality analysis is performed (A) and a masking product (B). It is important to highlight that depending on the method of computation (report or drug–event), the nij are not identical to those in Table 1. In Table 1, the nij correspond to the number of reports involving the drug–event combinations present in the database. The (%) sign before
n2i denotes the number of reports containing product B but not product A. The (%) sign before n3i denotes the number of reports containing neither product A nor product B.
Reports containing the
event (E) of interest Reports not containing the event of interest Total
Reports containing product A (regardless of
any other co-suspected drug incl. product B) n11 n12 n1.
Reports containing product B (masking) but
not product A (%)n21 (%)n22 (%)n2.
Reports containing neither product A nor
product B (%)n31 (%)n32 (%)n3.
We have used two sets of criteria to define SDRs, depending on whether we used the PRR or its lower interval limit: a number of three reports or above combined with either a threshold (>) of 2
for the PRR or 1 for Lower95CI.14 A masking
effect was defined by a value of MR or MRCI >1 affecting a record not originally involved in an SDR.
Results
Mathematical algorithm
Substituting in the formula of the 95% confidence interval of the measures of disproportionality for
product A given by:3,17,18
95 025 975 % exp( [ . ] ), exp( [ . ] ) CI of MD MD z se MD z se A A A = × × × × α α⩽⩽
Table 3. Simulation aimed at assessing the effect of the respective allocation of reports containing both A and B to the products A and B, respectively. The nij represent the number of reports in the database. ROUND is the expression representing the rounding of the number to the nearest integer (natural number).
Event (E) of interest Other events Total
Product A n11
1; 3; 5; 10; 50; 100; 1000; 10,000 n5; 10; 50; 100; 500; 1000; 5000; 10,0001. – n11= n12 n1. Reports containing both A and B ROUND[%min(n11, n21)]
% = 0, 10%, 25%, 50%, 75% and 100% ROUND[%min(n% = 0, 10%, 25%, 50%, 75% and 100%12, n22)]
Product B (masking) n21
5; 10; 50; 100; 500; 1000; 10,000 n20; 50; 100; 250; 500; 1000; 5000; 10,00022 %n2. All other products in the database
(excluding both A and B) n100; 1000; 5000; 10,00031 n2000; 10,000; 100,000; 1,000,00032 n3.
Total n.1 n.. – n.1 = n.2 n..
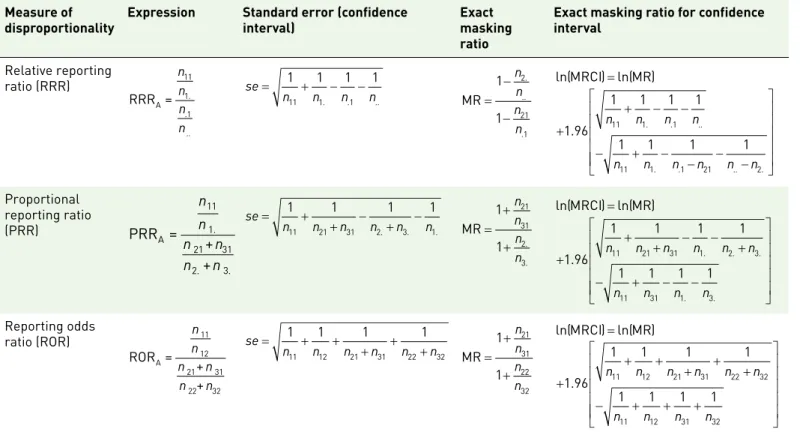
Table 4. Mathematical expressions of the masking ratios for the three main measures of disproportionality (RRR, PRR, ROR) and their respective confidence intervals used on spontaneous reporting system databases. The corresponding definitions of the nij included in this table are given in Table 1 (the corresponding formulae for a computation at the report level can be obtained by using the corresponding values from Table 2).
Measure of
disproportionality Expression Standard error (confidence interval) Exact masking ratio
Exact masking ratio for confidence interval Relative reporting ratio (RRR) RRR =A 11 1. .1 .. n n n n se n n n n = 1 + 1 − 1 − 1 11 1. .1 .. MR = − − 1 1 2 21 1 n n n n . .. . ln(MRCI) ln(= MR) + + − − − + − − − − 1 96 1 1 1 1 1 1 1 1 11 1 1 11 1 1 21 2 . . . .. . . .. . n n n n n n n n n n Proportional reporting ratio (PRR) PRR = + + A 11 1. 21 31 2. 3. n n n n n n se n n n n n n = + + − + − 1 1 1 1 11 21 31 2. 3. 1. MR = + + 1 1 21 31 2 3 n n n n.. ln(MRCI) ln(= MR) + + + − − + − + − − 1 96 1 1 1 1 1 1 1 1 11 21 31 1 2 3 11 31 1 3 . . . . . . n n n n n n n n n n Reporting odds ratio (ROR) ROR = + + A 11 12 21 31 22 32 n n n n n n se n n n n n n = + + + + + 1 1 1 1 11 12 21 31 22 32 MR = + + 1 1 21 31 22 32 n n n n ln(MRCI) ln(= MR) + + + + + + − + + + 1 96 1 1 1 1 1 1 1 1 11 12 21 31 22 32 11 12 31 32 . n n n n n n n n n n
in our Equation 1, we obtain Equation 2: MRCI=Lower95CI(after) Lower95CI MDA = × × × ′ ′ exp( . ) exp( . 1 96 1 96 se sse) MDA (2)
where MD denotes the measure of disproportion-ality used in the analysis for product A before removal (MD) or after removal (MD′) of masking product B and se is the standard error (MD can either be the RRR, PRR or ROR). Taking the logarithm of Equation 2 gives:
ln MRCI
(
)
=ln(MR)+1 96 se se′. ( − )where se and se′ denote the standard errors of the confidence interval before (se) or after (se′) the removal of masking product B.
The asymptotic standard error of the logarithm
of the relative reporting ratio (RRRA) is given
by:3,14,17
se
n n n n
≈ 1 + 1 − 1 − 1
11 1. .1 ..
and the value of the approximate standard error of
the logarithm of the RRRA(withoutB), after removal of
masking product B (Table 1), is equal to:
se n n n n n n ′( ) . . .. . after removalof B ≈ + − − − − 1 1 1 1 11 1 1 21 2
The exact MRCI of the lower bound of the 95%
confidence interval for the RRRA given masking
product B is therefore equal to:
ln( ) ln( ) [ . ] . . .. . MRCI = MR + + − − − − − + z n n n n n n n α 0 025 1 1 1 1 1 11 1 1 21 2 11 11 1 1 1 1 n. n. n.. − − ⩽ (3)
where z[α 0 025⩽ . ] (= –1.96) is the lower 95%
point of the standard normal distribution. Table 4 contains the expressions of the standard errors, MRs of the measures of disproportionality and their respective Lower95CI for the RRR, PRR and ROR.
Noting that n.. is generally very large in
spontane-ous reporting databases, therefore 1
n..
and 1
2
n..−n.
tend to zero. Equation 3 can be re-expressed as:
ln( ) ln( . . . MRCI ≈ MR) + − − − − 1 96 1 1 1 1 21 C n C n n (4) with C n n = 1 + 1 11 1.
The study of the masking function associated with the use of the Lower95CI of the RRR pro-vides some insight into the masking mechanisms associated with the use of the measures of dispro-portionality and their respective confidence inter-vals. The results are presented for the RRR; however, they remain valid for the other measures of disproportionality (it can easily be seen from the formulae in Table 4 and checked computa-tionally that the values of the elements under the two square roots of the standard errors are simi-lar, returning almost identical results across the different measures of disproportionality). If our
assumptions concerning n.. and n2. are met,
Equation 4 shows that MRCI varies from MR,
when n21 is equal to zero (no masking effect), to
infinity as n21 tends to n.1.
Assuming that n.., n1., n.1 are large (e.g. >100), an
approximation of MRCI (for the RRR) can be obtained from Equation 4:
MRCI MR≈ − − − exp . . . 1 96 1 1 1 1 11 11 1 21 1 n n n n n (5)
that is, MRCI=MR MF× where MF is a
multi-plication factor by which MRCI can be obtained via the MR of the RRR. The study of this multipli-cation factor provides an interesting insight on the properties of the MRCI compared with the MR. This approximation of the MRCI shows that the percentage of reports (x) containing the masking
product (n21) among the reports for the reaction
of interest (n.1) dramatically influences the
mag-nitude of the masking associated with the confi-dence interval. However, the number and the percentage of reports involving the product for
which the DA is conducted (n11) also play an important role in the shape of the resulting mask-ing function of MRCI (Figure 1).
Unlike for the masking function associated with the RRR, which is hyperbolic regardless of the
value of the ratio n21/n.1, the masking function
(Equation 5) associated with the Lower95CI can take different shapes depending on the total
num-ber of reports for the reaction of interest (n.1) and
the number of reports of that event involving the
products of interest (A) (n11) among the total
number of reports containing the reaction of
interest (n.1) (Figures 1 and 2). When the
per-centage of reports involving product A in the total number of reports for the reaction of interest is <10% (i.e. when the contribution of the expres-sion in the exponential part of the function becomes negligible), the masking function is hyperbolic, which provides two interesting fea-tures: first, the masking has a ‘buffering zone’ (for values of x approximately included between 0.1 and 0.7) in which the masking does not increase importantly as x increases (Figure 3). Second, and more importantly, the magnitude of the masking effect can be estimated with a simple hyperbolic function from the value of the ratio
x = n21/n.1. Unfortunately, under other
circumstances these two convenient properties are lost with the masking effect associated with the use of Lower95CI. This implies that simple rules proposed in previous studies that can be
Figure 1. Shape of the masking function depending on the respective number and proportion of reports involving the product A of interest (n11) among all the products for the reaction of interest (n.1). The plot was computed for values of n11 of 5 reports and values of
n.1 of 10 reports (i.e. n11 representing 50% of the total number of reports for the reaction of interest). x =
n21/n.1 (from 0 to 0.5), y = n.2/n.. (from 0 to 0.95) and z is the value of MRCI.
Figure 2. Shape of the masking function (value of MRCI) depending on the respective number and proportion of reports involving the product A of interest (n11) among all the products for the reaction of interest (n.1). The plot was computed for values of n11 of 5 reports and values of n.1 of 50 reports [i.e.
n11 representing 10% of the total number of reports for the event (E) of interest]. x = n21/n.1 (from 0 to 0.95) and y = n.2/n.. (from 0 to 0.95) and z is the value of MRCI. The graph shows that under these circumstances the masking function is hyperbolic.
Figure 3. The graph is a cross-sectional view of the value of the masking ratio (y) as a function of the proportion of reports containing the masking product B (but not the product of interest A) among the total number of reports containing the event (E) of interest (n.1). The graph shows the buffering zone of a hyperbolic masking function. This zone is included between proportions of reports from 0.1 to 0.7. The value of MRCI increases dramatically when the proportion %n21/n.1 is above this value.
used to approximate the MR only provide a satis-factory estimate of the MRCI when the multipli-cation factor is close to 1. The multiplimultipli-cation factor only remains close to 1 when the number of
reports involving the reaction of interest (n.1) is
important (e.g. >100) and as long as the propor-tion of reports involving the product of interest
(n11) remains low compared to n.1 (e.g. <10% of
the reports for the reaction of interest) (Table 5). This important finding implies that the properties of the approximate MR that we describe above can only be extended to the MRCI when these two conditions are met.
Equation 3 shows that the computation of the MRCI (like the exact MR) is also dramatically influenced by the method of computation (at the
report or drug–event level).9 The MRCI is drug–
event specific for the RRR when the computa-tion is performed at the drug–event level. Unfortunately, in the other situations (for the PRR and ROR and when the computation is per-formed at the report level for the RRR), the MRCI remains strictly specific for both product A, the masking product B and the event (E) of interest. This implies that, like for the exact MR, an important number of computations will have to be performed to detect a possible masking effect associated with the use of the Lower95CI of the measures of disproportionality (the number of computations is a quadratic function of the num-ber of drug–event pairs included in the
data-base).8,9 We could not find any way to bring down
the number of computations associated with MRCI via a simplification of its computation.
Simulation
Our simulation originally yielded 905,091 SDRs with the PRR and 1,038,067 with its Lower95CI based on approximately two million simulated contingency tables. The removal of the masking resulted in a gain of 77,036 SDRs with the PRR (an additional 8.5% SDRs) and 68,900 SDRs with the Lower95CI (an additional 6.6% SDRs). The removal of any effect (masking or revealing effect) resulted in a net gain of approximately 5% new SDRs for both methods (Figures 4 and 5). We emphasize that under normal circumstances, the number of SDRs to be reviewed would be much lower. However, the percentages of addi-tional SDRs unravelled by the unmasking are very similar to the number that we observed
pre-viously in real databases.8 Our simulation
vali-dated our mathematical algorithm as the MRCI exactly predicted the direction and the magnitude
of the masking observed for the confidence
inter-val of the PRRA since the observed MRCI
(Equation 1) and calculated MRCI (Equation 3) provided identical results.
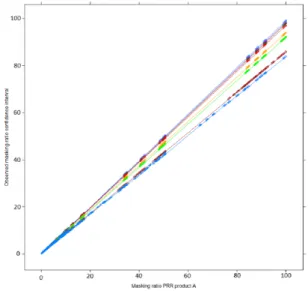
A very close correlation between the masking effect associated with the PRR and the masking effect associated with its confidence interval established in our mathematical framework has been observed in our simulation (Figure 6). In particular, our simulation confirms that the masking product inducing the highest masking effect on a given drug–event pair for the PRR will also be the product inducing the highest masking effect for the confidence interval (Figures 6 and 7).
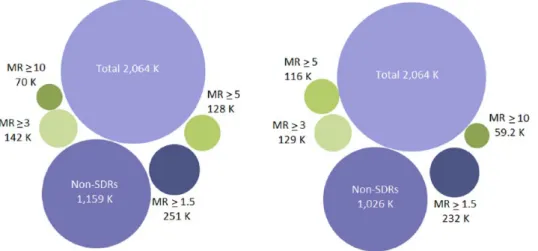
Among the records that were not associated with an SDR using the PRR (1,159,293), 62.9% of these (728,735) were affected by a masking effect (MR strictly > 1) and 367,828 (31.7%) were involved in a masking effect greater than 1.1, sug-gesting that most of the masking effect is of a moderate magnitude. Very similar figures were found using the Lower95CI. From the original records not originally highlighted as an SDR (1,026,317), 64.8% of these (665,473) were affected by a masking effect (MRCI > 1) but only 32.9% of these (337,628) were affected by a moderate masking effect (MR > 1.1). The pres-ence of a higher masking (defined by an arbitrary threshold of 1.5 for the MR) involved 21.6% of the (simulated) records not originally involved in an SDR for the PRR (250,778) and 22.6% of the records for the Lower95CI (232,022). Overall, the extent of important masking affecting the original non-SDRs remained low (Figure 8). The simulation showed that the proportion of new SDRs revealed by the unmasking and common to both methods increased with the value of the respective MRs. The number of new SDRs revealed after the removal of the masking effect common to both methods was 42,054 new SDRs (i.e. 55% of the new SDRs for the PRR and 61% of the new SDRs for the Lower95CI). This pro-portion increased with the value of the MR to reach, respectively, 68% and 81% in the presence of important masking (value above 3 for both ratios) (Figure 9). These results show that the removal of masking of high magnitude tends to reveal identical SDRs across the two methods.
Discussion
Previous attempts have been made to propose an algorithm to assess and quantify the masking
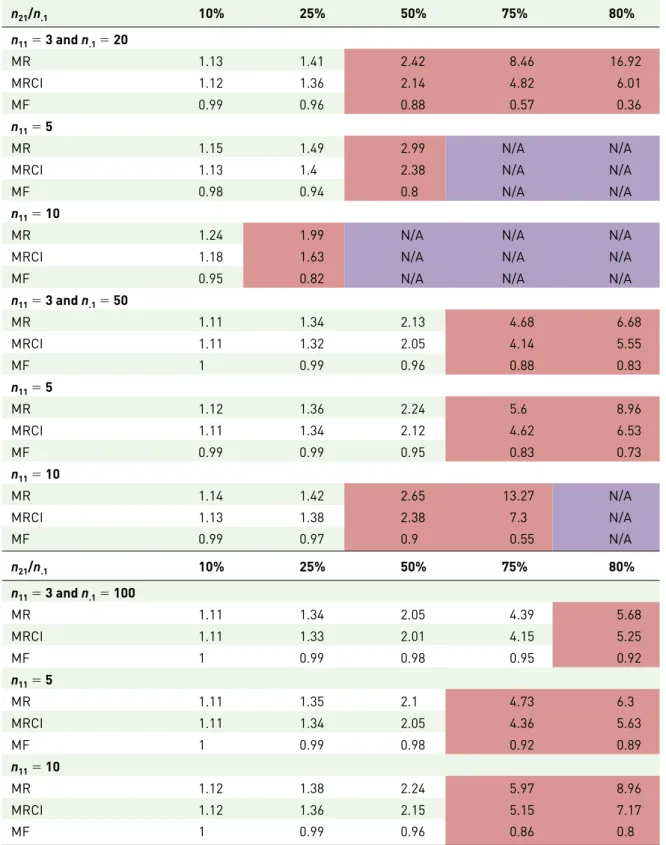
Table 5. Computation of the masking ratio for the PRR and masking ratio for its confidence interval under the scenario that n2. and n3. are large (>100 reports) with n2./n3. = 0.005 and n1. = 100. The percentages represent the proportion of reports including the masking product B among the total number of reports involving the reaction of interest (n21/n.1). The table shows that the masking ratio (for the confidence interval) cannot be easily estimated since the multiplication factor differs from one when the number of reports for the reaction of interest (n.1) is <100 and x is high (above 50%). The cells in red highlight the computations for which MF < 0.95. N/A denotes that the computation is not applicable.
n21/n.1 10% 25% 50% 75% 80% n11 = 3 and n.1 = 20 MR 1.13 1.41 2.42 8.46 16.92 MRCI 1.12 1.36 2.14 4.82 6.01 MF 0.99 0.96 0.88 0.57 0.36 n11 = 5 MR 1.15 1.49 2.99 N/A N/A
MRCI 1.13 1.4 2.38 N/A N/A
MF 0.98 0.94 0.8 N/A N/A
n11 = 10
MR 1.24 1.99 N/A N/A N/A
MRCI 1.18 1.63 N/A N/A N/A
MF 0.95 0.82 N/A N/A N/A
n11 = 3 and n.1 = 50 MR 1.11 1.34 2.13 4.68 6.68 MRCI 1.11 1.32 2.05 4.14 5.55 MF 1 0.99 0.96 0.88 0.83 n11 = 5 MR 1.12 1.36 2.24 5.6 8.96 MRCI 1.11 1.34 2.12 4.62 6.53 MF 0.99 0.99 0.95 0.83 0.73 n11 = 10 MR 1.14 1.42 2.65 13.27 N/A MRCI 1.13 1.38 2.38 7.3 N/A MF 0.99 0.97 0.9 0.55 N/A n21/n.1 10% 25% 50% 75% 80% n11 = 3 and n.1 = 100 MR 1.11 1.34 2.05 4.39 5.68 MRCI 1.11 1.33 2.01 4.15 5.25 MF 1 0.99 0.98 0.95 0.92 n11 = 5 MR 1.11 1.35 2.1 4.73 6.3 MRCI 1.11 1.34 2.05 4.36 5.63 MF 1 0.99 0.98 0.92 0.89 n11 = 10 MR 1.12 1.38 2.24 5.97 8.96 MRCI 1.12 1.36 2.15 5.15 7.17 MF 1 0.99 0.96 0.86 0.8
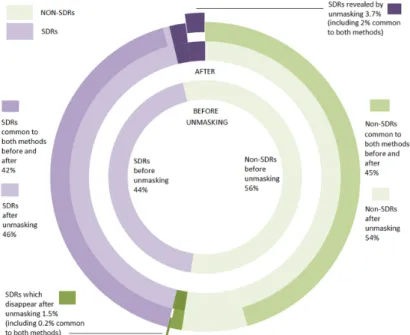
Figure 4. Number of signals of disproportionate reporting (SDRs) identified in the simulation after removal of the masking effect for the PRR. The figure also breaks down the number of SDRs (in purple) and non-SDRs (in green) that have been highlighted by each and both of the methods used in the study. The sectors in light colours indicate the percentage of records (non-SDRs in light green, SDRs in light purple) highlighted before and after removal of the masking. The sectors in dark colours indicate the percentage of new records highlighted after removal of the masking. Finally, the sectors that have been exploded from the pie chart correspond to the SDRs that have disappeared (exploded sector in green) and the new SDRs that have appeared (exploded sector in purple) common to both methods after removal of the masking effect.
Figure 5. Number of signals of disproportionate reporting (SDRs) identified in the simulation after removal of the masking effect for the Lower95CI. The figure also breaks down the number of SDRs (in purple) and non-SDRs (in green) which have been highlighted by each and both of the methods used in the study. The sectors in light colours indicate the percentage of records (non-SDRs in light green, SDRs in light purple) highlighted before and after removal of the masking. The sectors in dark colours indicate the percentage of new records highlighted after removal of the masking. Finally, the sectors that have been exploded from the pie chart correspond to the SDRs that have disappeared (exploded sector in green) and the new SDRs that have appeared (exploded sector in purple) common to both methods after removal of the masking effect.
effect associated with the use of measures of dis-proportionality and their corresponding
confi-dence intervals.6 The MR for the confidence
interval is a variable that provides a direct quanti-fication of the direction (masking or promoting effect) and magnitude of the masking effect asso-ciated with the use of Lower95CI. We have estab-lished the existence of a direct association between the masking effect with the use of measures of disproportionality and their respective confidence intervals (Lower95CI). In particular for a given drug–event pair, in the presence of a masking effect (MRCI > 1.1), the product responsible for the highest masking effect with the MD will also be the product inducing the highest masking effect when the corresponding Lower95CI is used. However, considering the differences observed between the MR and MRCI and in the absence of comparison between the MRCI with approximations of MR, we recommend using our exact algorithm (and not our proposed approxi-mation of the MR) to estimate the magnitude of the masking associated with the Lower95CI. Our simulation suggests that the extent of mask-ing on a given database is likely to be very similar across the two methods and also with other meas-ures of disproportionality for which we have developed an algorithm (ROR, RRR). In addi-tion, we have established that an important
Figure 6. Relation between the masking ratio of the measure of disproportionality (PRR) and its confidence interval (lower bound of its 95% confidence interval) according to the value of n11 (values of n11 from purple = 1, 3, 5, 10, 50, 100, 1000 to blue = 10,000). The masking ratio of the confidence interval is influenced by the number of reports of the product (A) (n11) on which the disproportionality analysis is
conducted (different colour lines). For an identical masking effect observed with the PRR, the masking ratio associated with the corresponding lower bound of the 95% confidence interval will decrease as the number of reports containing product A increases.
Figure 7. Relation (correlation) between the masking effect associated with the use of the masking ratio and its confidence interval. The plots are displayed according to the value of n31 (orange), n32 (green) and n11 (values of n11 from purple = 1, 3, 5, 10, 50, 100, 1000 to blue = 10,000). The axes of the plot on the right-hand side are on a logarithmic scale. These plots show that for a given drug–event pair, the product inducing the highest masking effect with the PRR will also induce the highest effect on the corresponding lower bound of the 95% confidence interval.
proportion of identical drug–event associations affected by the presence of an important masking effect will be revealed by the unmasking exercise, whether the PRR or its Lower95CI is used. We have also observed some masking effects of very high magnitude (MR or MRCI ⩾ 3) that was due to the conduct of a simulated analysis, which cov-ers extreme situations unlikely to be encountered
in practice. The results of our simulation can be extrapolated to any database containing more than 2000 reports.
Simulations have been previously used to under-stand masking mechanisms, but only covered a
limited number of situations.10–12,15 In our
pre-vious studies, the results observed in our
Figure 8. Extent of the masking effect associated with the use of the PRR (left-hand side) and with the Lower95CI (right-hand side) in the simulation performed in the study. The presence of important masking (defined as a masking ratio >3) was low and very similar across the two methods (data visualization available at the following URL: www-958.ibm.com/software/data/cognos/manyeyes/visualizations/new/bubble-chart/ number-of-records/1).
Figure 9. Number of new SDRs revealed according to the value of the respective masking ratios (MR and MRCI) before the removal of the masking effect. The proportion of new SDRs unmasked common to both methods increases with the magnitude of the masking effect originally affecting the record.
simulations perfectly predicted the results
observed on two large spontaneous databases.8,9
It also allowed us to study the influence of dif-ferent parameters on the masking effect in a controlled setting. It therefore provides an excellent working environment to test the algo-rithm on situations mimicking databases of rad-ically different sizes, which is difficult to perform in real life. On the other hand, we believe that the contingency tables generated by our simula-tion cannot realistically simulate the presence and distribution of true effects or false-positives across the drug–event pairs; we did not assess the usefulness (gained or lost performance and more importantly its public health impact) on the detection of true effects of any unmasking exercise in such a controlled setting. This assess-ment should be conducted on real spontaneous reporting databases (of different settings and
different sizes).9
We have previously observed on two large spon-taneous reporting system databases that the extent of masking associated with the PRR was low and mostly, but not only, affected events which were rarely reported (i.e. for which fewer than 100 reports were present in the databases). We have also observed that masking affected
events involved in stimulated or over-reporting.7
We have also demonstrated a major potential public health value of this exercise since one SDR revealed by our unmasking exercise later proved to be involved in a risk that led to the revocation of the marketing authorizations for fusafungine sprays in the EU (our DA was con-ducted 5 years before the regulatory action). This signal was revealed despite a moderate masking
effect (MR = 1.04).8,19
The use of Lower95CI is associated with some practical issues. First, no straightforward simplifi-cation can be used to detect and assess the mag-nitude of the masking affecting the reactions that are rarely reported, that is those that have fewer than 100 reports. In the absence of a simplified algorithm, we recommend the use of the exact MRCI. Second, like for the MR, we also show that the unmasking algorithm is dramatically affected by the method of computation – at the drug–event or report level – and is associated with an important amount of computations (the ber of which is a quadratic function of the num-ber of drug–event combinations present in the database). Unfortunately, unlike for the MR, we
did not find any way to simplify our algorithm to bring down the number of computations. Considering that the mathematical expression of the MRCI is more complicated than that of the MR, simplifications require assumptions that can have an unpredictable effect on the MRCI. The potential real-world public health benefits of removing the masking effect associated with the quantitative methods based on DA have been demonstrated in specific datasets but may be fur-ther investigated to establish whefur-ther they are robust and generalizable to other datasets. As we demonstrated before, this beneficial effect is highly situation-dependent and is influenced by the size of the database, type of products included in the database, extent of simulated reporting, importance of reactions associated with a high probability of an association with a drug aetiol-ogy, etc. One key issue for the future will be to prospectively assess the public health benefits of removing a masking effect in a database and iden-tifying the situations in which the removal might be beneficial (either in terms of number of true effects identified or in terms of time gained by the unmasking). Two studies have shown that unmasking can reduce the time necessary to detect signals of important public health
rele-vance in specific datasets.7,8 Some previous
retro-spective studies have already reported a benefit by identifying true effects unravelled by the unmasking and by demonstrating that signals
might be detected earlier.7,11,12,15,20 However,
with our study, we provide strong evidence that the public health impact of the unmasking exercise that we have demonstrated with the measures of disproportionality will also probably be observed with the MRCI.
Revealing true effects is only one side of the coin. This study and previous studies conducted with the PRR suggest that the unmasking is likely to inflate the rate of false-positives identi-fied by the quantitative methods (even more if
the algorithm is run iteratively).6,9 The rate
of true-/false-positive SDRs revealed by the unmasking has not been systematically studied or quantified particularly in a prospective way to minimize any hindsight bias. Such evaluation poses some practical and methodological chal-lenges. In particular, it would be necessary to adjudicate the SDRs in a blinded way (without knowing whether the SDRs were present initially or after removal of the masking) to avoid any
assessment bias.21 In addition, considering that
SRS databases can have significantly different features in terms of size, type of products covered and reports received and accepted, and subsequently entered (e.g. FAERS, VAERS,
EudraVigilance, VigiBase, etc.),13,22 such
evalu-ation would also have to be repeated on different types of databases. The limited number of stud-ies aimed at assessing the impact of the masking effect of disproportionality analyses have shown that reports including important events for
phar-macovigilance23 can be affected by a masking eff
ect.7,8,10–12,15 In that respect, our algorithm can
be run on any database provided that appropri-ate contingency tables are used for the DA and strict allocation rules of the reports containing both product A and masking product B are applied.
Finally, we highlight an important caveat of our results. Our unmasking algorithm can potentially be run ad libitum to fulfil pre-specified expecta-tions. We suggest that any unmasking should pri-marily be directed by the number of true-positives or rate of true-positive/false-positive findings
con-firmed by a clinical evaluation6,14,20 unravelled by
the removal of the masking product(s) inducing the masking of highest magnitude. No threshold to define the presence of consequential masking can be recommended at this stage.
Conclusion
We highlight a direct relation between the mask-ing observed with the PRR and for its confidence interval. The detection and quantification of the masking effect of measures of disproportionality and their confidence intervals can be automated. At the moment, the real benefits of this unmask-ing in terms of new true-positive signals (rate of true-positive/false-positive) or time gained in revealing of signals using this method are not yet definitively established. These benefits should be demonstrated in the context of prospective stud-ies aimed at assessing the performances of signal detection in real conditions. The implementation of this algorithm will require some additional resources (computational and human), in partic-ular on large spontaneous reporting system data-bases in which masking is difficult to identify empirically.
Acknowledgements
Valuable comments on this work were received from Jim Slattery.
Funding
The research leading to these results has received funding from the European Union’s Seventh Framework Programme (FP7/2007–2013) for the Innovative Medicine Initiative (www.imi. europa.eu) under Grant Agreement no. 115004.
Conflict of interest statement
JMD has no conflicts of interest with the pharma-ceutical industry. M.H. is working in Worldwide Safety and Regulatory, Pfizer Inc. None of the authors have any conflict of interests with any statistical software provider.
Disclaimer
The views expressed in this article are the per-sonal views of the author(s) and may not be understood or quoted as being made on behalf of or reflecting the position of Pfizer Inc.
Publication statement
This article has been neither submitted else-where, nor published elsewhere other than in abstract form.
The mathematical algorithm used in our study together with the simulation used to conduct our study are fully described and therefore can be independently replicated. Should anybody want to obtain the simulation data used to perform our analysis, these data can be obtained directly via the corresponding author.
References
1. Bate A and Evans SJW. Quantitative signal detection using spontaneous ADR reporting.
Pharmacoepidemiol Drug Saf 2009; 18:
427–436.
2. Deshpande G, Gogolak V and Weiss Smith S. Data mining in drug safety: review of published threshold criteria for defining signals of
disproportionate reporting. Pharm Med 2010; 24: 37–43.
3. Woodward M. Epidemiology. Study design and
data analysis. 2nd ed. Boca Raton: Chapman &
Hall/CRC, 2005.
4. Wisniewski AF, Bate A, Bousquet C, et al. Good signal detection practices: evidence from IMI PROTECT. Drug Saf 2016; 39: 469–90. 5. Almenoff J, Tonning JM, Gould AL, et al.
Perspectives on the use of data mining in pharmacovigilance. Drug Saf 2005; 28: 981–1007.
6. Gould AL. Practical pharmacovigilance analysis strategies. Pharmacoepidemiol Drug Saf 2003; 12: 559–574.
7. Juhlin K, Ye X, Star K, et al. (2014) Outlier removal to uncover patterns in adverse drug reaction surveillance: a simple unmasking strategy. Pharmacoepidemiol Drug Saf 22: 1119–1129.
8. Maignen F, Hauben M, Hung E, et al. Assessing the extent and impact of the masking effect of disproportionality analyses on two spontaneous reporting systems databases. Pharmacoepidemiol
Drug Saf 2014; 23: 195–207.
9. Maignen F, Hauben M, Hung E, et al. A conceptual approach to the masking effect of measures of disproportionality. Pharmacoepidemiol Drug Saf 2014; 23: 208–217.
10. Montastruc F, Salvo F, Arnaud M, et al. Signal of gastrointestinal congenital malformations with antipsychotics after minimising competition bias: a disproportionality analysis using data from Vigibase(®). Drug Saf 2016; 39: 689–696. 11. Pariente A, Didailler M, Avillach P, et al. A
potential competition bias in the detection of safety signals from spontaneous reporting databases.
Pharmacoepidemiol Drug Saf 2010; 19: 1166–1171.
12. Pariente A, Avillach P, Salvo F, et al. Effect of competition bias in safety signal generation: analysis of a research database of spontaneous reports in France. Drug Saf 2012; 35: 855–864. 13. Report of CIOMS Working group VIII. Practical
aspects of signal detection in pharmacovigilance.
Geneva, 2010.
14. Guideline on the use of statistical signal detection tools in the EudraVigilance data analysis system (Doc. Ref. EMEA/106464/2006 rev. 1), www. ema.europa.eu/docs/en_GB/document_library/ Regulatory_and_procedural_guideline/2009/11/
WC500011434.pdf (2006, accessed 3 October 2016).
15. Wang HW, Hochberg AM, Pearson RK, et al. An experimental investigation of masking in the US FDA adverse event reporting system database.
Drug Saf 2010; 33: 1117–1133.
16. Evans SJ, Waller PC and Davis S. Use of proportional reporting ratios (PRRs) for signal generation from spontaneous adverse drug reaction reports. Pharmacoepidemiol Drug Saf 2001; 10: 483–486.
17. Collett D. Modelling binary data. 2nd ed. Boca Raton: Chapman & Hall/CRC, 2003.
18. Schlesselman JJ. Case-control studies: design,
conduct, analysis. New York: Oxford University
Press, 1982.
19. Hauben M and Maignen F. Does serious consequential masking exist? An update
Pharmacoepidemiol Drug Saf. In press.
20. Alvarez Y, Hidalgo A, Maignen F, et al. Validation of statistical signal detection
procedures in EudraVigilance post-authorisation data: a retrospective evaluation of the potential for earlier signalling. Drug Saf 2010; 33: 475–487. 21. Arnaud M, Salvo F, Ahmed I, et al. A method
for the minimization of competition bias in signal detection from spontaneous reporting databases.
Drug Saf 2016; 39: 251–260.
22. Strom B. Ad hoc data sources for
pharmacoepidemiology studies. In Strom B. (ed.)
Pharmacoepidemiology. 4th ed. Chichester: John
Wiley and Sons, Ltd., 2005.
23. Trifirò G, Pariente A, Coloma PM, et al. Data mining on electronic health record databases for signal detection in pharmacovigilance: which events to monitor? Pharmacoepidemiol Drug Saf 2009; 18: 1176–1184.
Visit SAGE journals online journals.sagepub.com/ home/taw