RESEARCH OUTPUTS / RÉSULTATS DE RECHERCHE
Author(s) - Auteur(s) :
Publication date - Date de publication :
Permanent link - Permalien :
Rights / License - Licence de droit d’auteur :
Institutional Repository - Research Portal
Dépôt Institutionnel - Portail de la Recherche
researchportal.unamur.be
University of Namur
Forests to the People: Decentralization and Forest Degradation in the Indian Himalayas, World Development, 38(11):1642-56
Baland, Jean-Marie; bardhan, pranab; das, sanghamitra; mookherjee, dilip
Publication date:
2010
Document Version
Early version, also known as pre-print Link to publication
Citation for pulished version (HARVARD):
Baland, J-M, bardhan, P, das, S & mookherjee, D 2010, Forests to the People: Decentralization and Forest
Degradation in the Indian Himalayas, World Development, 38(11):1642-56..
General rights
Copyright and moral rights for the publications made accessible in the public portal are retained by the authors and/or other copyright owners and it is a condition of accessing publications that users recognise and abide by the legal requirements associated with these rights. • Users may download and print one copy of any publication from the public portal for the purpose of private study or research. • You may not further distribute the material or use it for any profit-making activity or commercial gain
• You may freely distribute the URL identifying the publication in the public portal ?
Take down policy
If you believe that this document breaches copyright please contact us providing details, and we will remove access to the work immediately and investigate your claim.
Forests to the People: Decentralization and Forest
Degradation in the Indian Himalayas
1Jean-Marie Baland, Pranab Bardhan, Sanghamitra Das and Dilip Mookherjee2
October 6, 2008
1
We are grateful to Rinki Sarkar for her excellent field work and supervision of the team of field investigators --- S. Parmar, Rajesh Kumar, Suresh Verma, Ramesh Badrel, Joginder Kainthla, Bhupesh Chauhan, P. Mohanasundaram, Sanjay Rana, Vidit Tyagi, Apurva Pant and Narendra Mandral --- who bore great hardships and showed great commitment and courage during the years of data collection. Thanks are due to Anil Sharma and Rakesh Sinha for their research assistance, and to all the
government officials at all levels in Himachal Pradesh and Uttarakhand who went out of their way to aid and assist us in conducting our field surveys. We would specifically like to record our gratitude to Mr. D.K. Sharma, Principal Secretary (Planning) Himachal Government, Dr. Pankaj Khullar,
Additional Principal Conservator of Forests, Himachal Forest Department, Dr. R.S. Tolia, Principal Secretary, Uttarakhand Government. Finally, these surveys would not have been feasible had it not been for the enthusiastic involvement of the local communities. For useful comments we are grateful to Bina Agarwal, Eswaran Somanathan and Rajesh Thadani. This research was supported by the National Science Foundation (NSF grant no. SES-0079079), the MacArthur Foundation network on Inequality and Economic Performance, the Belgian Program on Interuniversity Poles of Attraction initiated by the Belgian State, Prime Minister’s Office, Science Policy Programming , the Program ’Actions de Recherches Concertees’ of the French-speaking Community of Belgium and the Planning and Policy Research Unit of the Indian Statistical Institute.
2
Baland, CRED, Department of Economics, University of Namur, Belgium; Bardhan, Department of Economics, University of California at Berkeley; Mookherjee, Department of Economics, Boston University; Das, Indian Statistical Institute, New Delhi.
Forests to the People: Decentralization and Forest
Degradation in the Indian Himalayas
Abstract
Over the past decades, India and Nepal have embarked upon ambitious programs of decentralization over their forests by transferring management and use rights from the state to the local communities. Even though centralized forest management by the State suffers from a number of weaknesses, it is not clear that endowing local communities with long term rights over the forests necessarily leads to better outcomes in terms of resource degradation.
In this paper, we compare the degradation of forests managed by local communities (Van Panchayats or VPs), relative to state forests in the Indian state of Uttarakhand. To this end, we use a unique data set including ground-level ecological measures of forest quality including canopy cover, biomass, lopping and regeneration. Controlling for forest geography, unobserved village characteristics and cross-forest spillovers, VP forests are 20—30% less lopped, and roughly similar on other dimensions. The extent of lopping is important as it directly measures the short run impact on the forest of firewood and fodder collection by villagers. We also show that, for older VP, the lopping differences tend to translate into better long term biomass measures, such as the density of trees (basal area).
1. INTRODUCTION
Property rights and management of common property resources such as forests, fisheries and irrigation systems has become a central issue in development economics and policy. This owes both to the high degree of reliance of lives of the poor in rural communities in developing countries on these resources, as well as concerns for environmental sustainability.3 While there are many plausible causes of degradation of such resources such as population pressure, economic growth, commercial exploitation, socio-economic heterogeneity and government policies, an important determinant that has received much attention is the nature of property rights and control mechanisms. It is frequently argued that excessive state control and management of such resources has been associated with adverse incentive and monitoring systems, which have contributed to degradation of common property resources (Ostrom (1990), Somanathan (1991), Gibson, McKean and Ostrom (2000), Jodha (2001), Shivakoti and Ostrom (2002)). This suggests the need for policies that allow local communities to own and manage these resources themselves.
While questioning the performance of centralized states in managing common property resources, the literature on environmental resource management has been nuanced about the performance of decentralization policies and community-based management schemes. In their comprehensive analysis of case studies, for instance, Baland and Platteau (1996) argue that local communities are fairly deft in developing rules of allocation and distribution of the resource output across users, such as those described by Wade (1987) for South Indian irrigation collective schemes. It is tempting to generalize from the existence of such schemes (e.g., for rotating allocation of fishing spots) that local communities have a genuine capacity to satisfactorily manage common property resources. While distribution measures involve some protection of the resource, they are often inadequate in preserving the resource against strong market and population pressures. Baland and Platteau describe case-study-based evidence that local communities tend to be much less successful in devising conservation measures, particularly in complex dynamic systems such as forests or fisheries.
Other concerns have been voiced in the broader context of community-based development programs. In their recent critical review of such programs, Mansuri and Rao (2004) describe a range of possible weaknesses of community participation programs arising from lack of accountability of community leaders, local elite capture, deficiencies in local training, poor design and implementation. They also lament the lack of empirical studies that establish causal relationships between participatory elements and relevant outcomes. This results frequently from lack of availability of suitable data-sets with large samples and objective measures of resource stocks, and identification problems arising from endogenous treatment and unobserved heterogeneity.
This paper focuses on the impact of Van Panchayats (VPs, or local forest councils) on forest degradation in Uttarakhand, the only Indian state characterized by such a
3
See Dasgupta (1996) and Dasgupta et al (2000) for an overview of these concerns. Jodha (1986, 2001) presents evidence that between 15-25% of the incomes of the rural poor in India depend on these resources. Beck and Nesmith (2001) survey evidence from various parts of India and West Africa, which indicate a similar range of dependence.
village community management system. These were first created in 1931 by the colonial British government, following large-scale protests by local populations at previous attempts of the government to convert forests to state property and impose restrictions on local use. A 1931 Act allowed a Van Panchayat to be formed following a collective application by at least one-third of the local community. Forest areas were subsequently transferred out of state control to the local council, which became responsible for regulating and monitoring use of the forest by members of the local community. Since Independence, the Indian government has continued to encourage the formation of Van Panchayats, based on the idea that community management can improve governance and prevent degradation of the forest stock. One-third of villages in the mid-Himalayan region of Uttarakhand have set up VPs. VP forests now co-exist with state forests, some of which are protected and others are not, and represent 11% of the total forest area in the state (Sarkar, 2008).
Like much of the existing literature, we attempt to infer the effectiveness of local community management vis-à-vis state protection by comparing the condition of local forests under these two types of management. Our main contribution is two-fold, in comparison to most of the literature (reviewed in detail in Section 5). First, we rely on a random sample of relatively large size and geographic coverage, in contrast to many papers relying on case studies or restricted samples. Moreover we utilize detailed ground-level measures of forest quality conducted by trained ecologists, in contrast to subjective perception-based measurements of forest stocks by local community members, or aerial satellite images. Second, we explore possible biases associated with the self-formation of Van Panchayats (henceforth, VP), and problems of unobserved heterogeneity, to the extent feasible with a cross-sectional dataset. A few papers in the literature, notably Edmonds (2002) and Somanathan, Prabhakar and Mehta (2005), have also relied on large representative cross-sectional samples, and explored the robustness of findings with respect to these sources of bias. Our study complements theirs and emerges with broadly similar conclusions.
Our study covers 399 forest patches, from a stratified random sample of 83 villages from the mid-Himalayan region (i.e., altitude between 1800 and 3000 metres) of Uttarakhand. Local residents of the sampled villages were asked to identify forest patches accessed by them. A team of ecologists then made direct measurements of canopy cover, biomass (basal area, basal volume), lopping and regeneration rate (number of saplings per hectare above a certain height) at a number of randomly chosen transects within these patches. These forest surveys were complemented with household surveys and in-depth interviews with local population including distance to forests accessed and collection time per bundle of firewood.
We find no significant quality differences between VP and non-VP forest patches, in the absence of any controls for species composition, aspect, altitude, slope and proximity to villages and roads. Adding geographic controls and village fixed effects shows an average tree in VP patches to be approximately 20% less lopped compared to those in state forests. Differences on other dimensions are statistically insignificant. This indicates that selection effects accounted for the lack of any difference in the raw lopping averages. Specifically, more degraded forests are more likely to be converted into VP forests. A direct comparison (using a conditional logit with village fixed effects) indicates a greater tendency for forest patches in closer proximity to the village to be VP forests. On the other hand, similar to Somanathan et al (2005) we
find no tendency for VP and non-VP broad-leaf forests to differ by aspect, altitude or slope.
While Somanathan et al (2005) also control for geographical attributes of the forest and unobserved village characteristics, we additionally control for possible cross-forest spillovers resulting from different forms of management. This incorporates the concern that the superiority of VP management is not properly measured by differences between VP and non-VP patches in the neighborhood of the same village, since the VP may enforce restrictions on access on its own patch that may induce villagers to substitute by extracting more from other neighboring patches. We control for the composition of other forests in the vicinity of the same village (i.e, state protected forest area, and VP areas, with unprotected forests constituting the residual category). We find that state-protected forests exhibited negative spillovers, while VP forests did not. This raises the estimated difference between VP and state protected forests even further to 28%.
We perform another check for selection bias by distinguishing between old and new VPs. Selection effects are likely to dominate management effects for forests recently converted to VPs, since the effects of restraints enforced by VPs on firewood and fodder collection would take some time to manifest themselves in measured forest quality. For older VPs, factors guiding selection at the time of conversion should matter less, and management method should matter more. If observed differences are stronger for new VPs, it indicates a greater likelihood of having been driven by selection effects. We find the opposite: the differences are stronger for older VPs. This reinforces the inference that observed differences in lopping and regeneration reflect differences in mode of management rather than selection effects.
Section 2 provides background information concerning forest management institutions in Uttarakhand. In section 3, we describe the context as well as the methodology of our survey. We also present descriptive statistics concerning measures of forest degradation in the region. The main regression results are presented in section 4. Section 5 then relates our study and findings to related literature. Section 6 concludes.
2. FOREST INSTITUTIONS IN UTTARAKHAND
State forests are governed by the forest department. The department has a hierarchical administrative structure. The lowest rung is occupied by the “forest guard” responsible for field operations on a day to day basis. A legacy of the colonial past, the department manages and monitors vast expanses of forests under its control. The main motive behind the department’s operations is conservation, though some commercialization objectives also exist. For instance, while there is a ban on green felling, the forest department can sell timber acquired through silviculture operations or through salvaging operations where the forest stock has been damaged due to natural calamities. In some pine forests, the department can extract and sell resin, an important ingredient in the manufacture of turpentine. Locals have “rights’ to access state forests for their livelihood needs. However, they have to abide by rules of extraction and use prescribed by the forest department (shown in Table A2 in the Appendix). Violation of such rules is a legal offence. The “forest guard” is the main interface between the locals and the higher authorities in the department. His main
role is to watch over the forest for detecting violations and imposing penalties on the accused.
For historical reasons, state forests have been classified into ‘un-demarcated’ and ‘demarcated’ patches.4 Un-demarcated forests are known as ‘Civil Soyam’ forests in Uttarakhand and are not marked by boundary pillars. The department cannot impose prohibitions on these patches as regards rights of access and use. In course of field work it was found that these were usually patches of forests between the village boundary and the demarcated state forest patches. A demarcated forest, which is marked by boundary pillars, is an area notified under the Indian Forest Act of 1927. Locals can access such forests unless prohibited. For instance, the forest department can close plantation zones from use or stop the granting of timber rights from a degraded forest to promote regeneration.5 Demarcated forests are further categorized into ‘demarcated protected forests’ and ‘reserved forests’.6 As the name suggests, reserved forests have more restrictions on access and use and the forest department has the authority, if it wishes, to exercise maximum control on them but it can relax these norms. In Uttarakhand, most demarcated forest patches are ‘reserved forests’. Van Panchayat forests were first formed under the Van Panchayat act of 1931. The British had started intruding into local forest patches in large parts of Kumaon and parts of Garhwal areas of Uttarakhand, to cater to their imperial needs of timber and charcoal. They started demarcating forests for their own use. This sparked off a series of agitations by the local inhabitants who set forests on fire in protest. In a bid to pacify the villagers, the British set up a Grievance Committee which passed the Van Panchayat Act in 1931. Under this act, villagers can create community managed forests from forests controlled by the revenue department. The act entitles the villagers to demarcate the boundary of their panchayat forests, protect it from illegal tree felling, fires, encroachments and cultivation. Daily operations are chiefly governed by rules that village forest council have themselves crafted, often aided by government officials. The rules appear designed to ensure sustainable use of forest resources. In the case of firewood, extraction is restricted to ‘dry-wood’ only and, in the case of timber, only ‘dried-trees’ can be felled upon payment of a stipulated fee. There are quantitative restrictions on the extraction of firewood, fodder and leaf-litter. In some cases, the forest is divided into compartments and extraction is permitted on a rotational basis across these compartments so as to ensure sufficient time for regeneration of closed-compartments. Penalties are imposed in case of rule violations. A vigilance mechanism is usually required to make these rules fool-proof. For this
4
Forests were demarcated by the British to facilitate their timber felling operations in order to cater to their imperial needs of ship-building and construction of railways.
5
Collective plantation programs initiated by the forest department for rejuvenating degraded patches of forests do not appear to have been successful. 72% of the villages reported no such programs. In those villages that reported the existence of these programs, 69% of respondents were of the opinion that they were marginally effective, and 20% believed they were ineffective. Such programs seem to have failed due to weak mobilization of the local community, poor post-plantation care and interference with villagers’ grazing zones and cattle-paths.
6
When the Indian Forest Act of 1927 was promulgated, the basic objective was first to establish control over forests by notifying them as “protected”. Thereafter settlement operations were carried out that defined people’s rights on forests. Boundary pillars were put up and these were classified as ‘demarcated protected forests’. Thereafter, well stocked forests with least human interference were identified and were classified as ‘reserved’. Forests were all rights of use are denied are declared a ‘sanctuary area’. This information is based on discussions with Dr Pankaj Khullar, additional principal conservator of forests in Himachal Pradesh.
purpose, either a guard is hired or there is informal monitoring by villagers. The local guard is usually hired through contributions made by local inhabitants or resources diverted from VP earnings.
VPs are typically created in Civil Soyam forests in the vicinity of the villages. While a major objective is to rejuvenate and manage patches of Civil Soyam forests for local use, it also prevents neighbouring villages from intruding into this zone, once formally demarcated as a ‘Van Panchayat’ forest. Most of the VPs are fairly old and have been in existence for over 35 years, even though a significant number of them were created over the past decade as part of the Indian government policies to promote community participation in forest management.7 Interactions with the local inhabitants revealed that most of these VPs were formed by the villagers only after being motivated by the forest department. In our sample, 39 out of 45 VPs have been initiated in this manner.
3. SURVEY METHODOLOGY AND FOREST DEGRADATION MEASURES 3.1 Survey Design
On the basis of Census of India village location maps and the corresponding topograhical maps of the Survey of India, we selected a stratified random sample of 83 villages in Uttarakhand in the altitude-zone between 1800 and 3000 meters. The stratification was based on three criteria: altitude, number of households, and distance to the nearest town. For each criteria the strata were formed so that equal number of villages belonged to each stratum. Then, villages were randomly chosen so as to be representative of the population joint distribution of the three criteria. In the second stage, a random sample of 20 households was chosen in each village so as to be repesentative of the village joint distribution of household landholding and caste. Three sets of questionnaires were used in each village: (a) a household questionnaire dealing with the socio-economic structure of the household and its dependence on forests; (b) a village questionnaire designed to secure information on a host of village level characteristics such as demographic size, access to physical and social infrastructure, the market environment, and institutions of local governance; (c) an ecology questionnaire intended to gather quantitative and qualitative evidence on the condition of the forests accessed by the villagers. This paper relies primarily on the data collected from the ecology questionnaire.
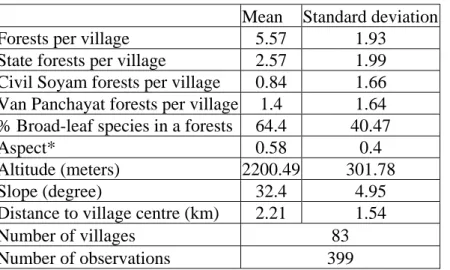
Table 1 provides some details of the number and nature of forests surveyed. On average there were 5.6 forests accessed by one village, of which 2.6 were state forests, 1.4 were VP forests, and the rest were Civil Soyam forests. About two-thirds of the forest species were broad-leaf rather than coniferous forests, the former providing greater utility to neighboring villagers owing to the superior quality of firewood and fodder. The forests were located on an average altitude of 2200 meters above sea-level, at an average slope of 32 degrees, and an average aspect of 0.58 (where an
7
The 1976 and 2001 amendments make Van Panchayat formation much easier, and ensure greater control on the incomes generated and their uses for local development purposes (for more details, see Sarkar, 2008).
aspect of 1 is most conducive to vegetation growth, representing a direction between east and north).8
For conducting the ecology surveys we employed ecologists from the local area, who identified and mapped local forest zones on the basis of local interactions. Ground level observations revealed considerable variations in density within forests. Depending on the size of the forest area, up to 6 random transects (100 meters in length) were laid in the forest and measurements at three equidistant plots (of 5.63 meters radius) on the transect were recorded on species composition, canopy cover, basal area, heights and girths of trees above 3 meters in height and regeneration characteristics. Table A1 in the appendix shows that within-forest variance in these quality measures exceeds that between forests, indicating the importance of using multiple transects within each forest.
Qualitative assessment of grazing, lopping, leaf-litter accumulation, timber extraction and evidence on natural calamities such as fire and snowfall damage to trees was also recorded at each plot in terms of a predetermined qualitative scale. The second part of the ecology surveys interviewed 3 to 4 members of each village with regard to their perceptions of changes in forest stock over the past quarter century and the nature of institutions governing access and use of the forest.
Households in these villages were overwhelmingly involved in farming activities, with only 11% of household time allocated to non-agricultural occupations. Households were highly dependent on local forests for firewood, grazing and leaf-fodder. Firewood was the only source of energy used for heating, and the major source for cooking. LPG was the main cooking fuel alternative, with 11% of the household using it as a primary source of cooking energy in summer (3% in winter). Over 84% of firewood, 77% of timber and 62% of leaf fodder were collected from local forests. In terms of biomass, timber extraction was less important, accounting for only one tenth the wood removed for firewood.9 Despite the fact that these areas are fairly disaster-prone, with half the villages experiencing natural disasters in the last five years, the latter played a relatively minor role in forest degradation.10 Hence firewood and fodder collection seemed to be the most important sources of forest degradation.
From our community-representative interviews, 91% of respondents in Uttarakhand agreed that ‘in their villages the forest stock was depleting’, and 30% described forest
8
The lowest value of aspect is 0, corresponding to a direction of south to west. Such directions correspond to greater sunlight exposure, which lowers moisture content of the soil. See Singh and Singh (1987) for further geographic details concerning vegetation in Himalayan forests.
9
The household responses indicated one tree equivalent of timber used by a household every five years. Based on an assumption of three ton weight per tree, and 80 households per village, timber use accounted for biomass removal of 48 tons per village per year, compared with 456 tons for firewood removal.
10
The ecologists visually estimated different sources of tree degradation, using a qualitative scale from categories 0 to 3 (with 0 denoting no degradation, 1 denoting low degradation, 2 denoting moderate degradation, and 3 denoting high degradation). Categories of sources considered were grazing, leaf litter removal, lopping, timber removal, natural calamity (fire and snowfall). The forest average score for grazing was 1.9, for lopping was 2.29, and timber was 1. The forest average scores for degradation resulting from fire was only 0.55 and from snow was 0.56.
degradation over the past quarter century as ‘drastic’. Collection levels per household have declined on average by about 36% and mean collection times for firewood increased by over 60%. Forest degradation, in the sense of lower forest quality, is much more serious than deforestation, i.e. shrinking forest area, since distance to the forest increased by less than 10% in the meantime. This indicates households were spending more time inside the forest looking for firewood. Declining quality of the forest rather than shrinking forest boundaries (resulting from encroachment) thus appears to be the dominant problem.11
3.2 Measures of Forest Degradation
Degradation has various dimensions that are difficult to represent by a single measure. Canopy cover (crown cover) is the principal measure used by the Forest Survey of India (FSI), as well as by Somanathan et al (2005, 2006) on the basis of aerial satellite images. Our study is based instead on direct ground-level measures of forest quality on five different dimensions of forest quality: canopy cover, height, girth and species of trees, lopping and regeneration rates. We describe these below.
Canopy cover is defined as the amount of ground area covered by the spread of tree branches and leaves, as viewed from above. A mirror with grids of equal size was used to determine the canopy cover from the ground-level, so as to record the
proportion of grids covered by tree canopies within each plot. FSI uses a threshold of 40% to denote a severely degraded forest, while Somanathan et al (2005) take canopy cover above 80% as an indicator of a well-stocked forest. Accordingly we may distinguish between severely degraded, degraded and healthy forests, using 40% and 80% as the corresponding cutoffs. There appears to be more consensus among ecologists concerning the latter cutoff, i.e., that long-term growth of the forest is not hampered by canopy covers in the range 80—100%. For this reason, the tables below will provide proportions of forests that lie below the 80% cutoff.
Basal area and volume represent tree biomass, a second important dimension of tree quality. Basal area is defined as the sectional area at breast height of all trees put together per unit area.12 Basal area estimates above 40 mts2 per hectare are considered by forestry experts to be indicative of good bio-mass potential of a forest (Thadani and Ashton (1995)). We augment this measure by multiplying the height of each tree with its basal area to obtain a measure of basal volume, which is a more accurate measure of tree biomass as it incorporates possible loss of height due to excessive lopping. As we will see in Table 3 below, these two measures are highly correlated. Lopping is the third dimension of degradation. To measure lopping, a visual scale was constructed: each tree encountered in the sample plots was classified into grade-1 if the extent of lopping was less than 30% (mid value 15%) of the tree height, grade-2 if the tree was 30-70% (mid value 50%) lopped and grade-3 if the tree height was over 70% (mid value is 85%) lopped. Grade 1 does not affect long-term growth while
11
From the household surveys, only 3% of land holdings of households were reported to have been obtained by encroaching (forests or village commons). This amounts to less than an acre per village. 94% of land was acquired through inheritance. While these data may well understate the extent of encroachment, they suggest that it was a comparatively insignificant source of shrinking forest area.
12
During field work, we measured the girth at breast height of all trees above three meters in height, thereby ignoring smaller trees.
grade 3 negatively affects survival of the tree. Grade 2 is the middle range where growth is affected negatively (height and girth of trees get stunted) but the effect on sustainability is uncertain (Thadani (1999)) 13,14. For each forest parcel we surveyed, we then computed the average value of the lopping measure, which gives us the average extent of lopping in that parcel.
Regeneration is another indicator of sustainability of forest stock. The regeneration rate is measured by the number of saplings per hectare above the height of 0.50cm. A value of 500 indicates abnormally low regeneration, while above 2000 indicates healthy regeneration (Thadani and Ashton (1995)).
A final measure of degradation is the amount of time taken by neighboring villagers to gather a bundle of firewood normally carried by adults (approximately 35 kilograms) from within the forest. More time is spent gathering a given amount of firewood within a more degraded forest, as villagers have to search more to find good trees, or have to climb to a higher level of each tree in order to lop off branches. The village questionnaires included collection times per bundle reported for each forest patch accessed by a sample of surveyed villagers. These collection times include time to walk to the forest. Controlling for distance of each forest to the village, variations in reported collection times provide a measure of variations in within-forest gathering times. However, there are no sustainability benchmarks available from forestry scientists concerning gathering times.
Our data also includes the percentage of broad-leaf species in the forest, based on the trees inspected by the ecologists in the areas around each transect. In the regressions, we control for the broad-leaf component of the forest, since broad-leaved forests tend to be more useful and therefore more degraded than coniferous forests.15
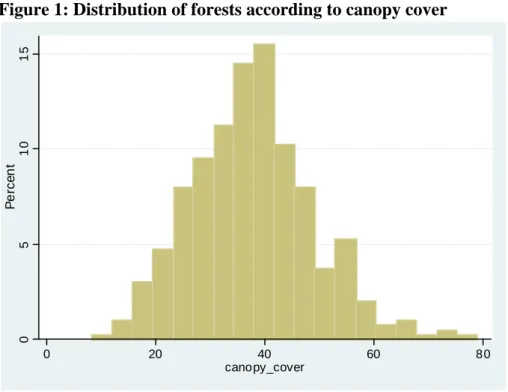
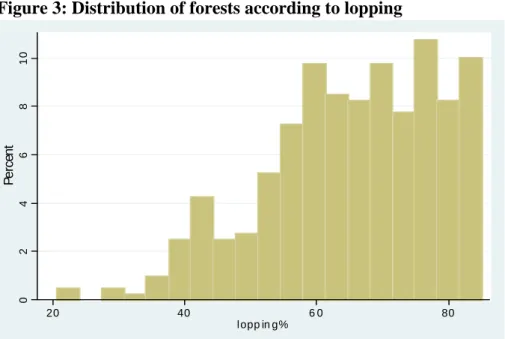
Table 2 provides averages of all six measures of forest quality in our sample. In Figures 1 to 3, we also present the distribution of the forests for the three main measures: canopy cover, basal area and lopping. The average canopy cover is alarmingly low, as it lies below 40%, indicating severe degradation. There is no forest with a canopy cover exceeding 80%, which is the threshold defining a healthy untouched forest. By contrast, in terms of basal area, the forests appear relatively healthy, with the mean basal area above the threshold of 40 square meters per hectare. More than half of the forests are above this threshold. Sustainability thresholds for basal volume are not available from forestry specialists, so we cannot assess degradation in terms of basal volume. However, basal area and basal volume are highly correlated (see Table 3 below), indicating that with regard to biomass the Uttarakhand forests are comparatively less degraded. With regard to lopping, the average tree is 65% lopped, with almost all forests lopped more than 30%. The extent
13
See for instance, Kumar and Shahabuddin (2005), who show high grazing and firewood extraction are associated with low canopy cover, low height and girth of trees in the Sariska Tiger Reserve forests in northern India.
14
Scientific work on what values of these measures indicate lack of sustainability in our area of study is limited. Our survey and the cutoffs used for measures indicative of degradation in our area have used the field experience of Dr. R. Thadani.
15
Coniferous species have lower calorific value, burn more quickly owing to presence of resin, and produce sparks. They are also a poor source of leaf fodder and litter, with a lower nutrient content, and a lower rate of decomposition.
of degradation therefore seems severe on this dimension. It is also severe with regard to regeneration rates, the average lying below the 500 threshold for severe degradation, no forest crossing the 2000 threshold which corresponds to healthy regeneration. Finally, the average time to collect a bundle of firewood (around 35 kgs) is close to 4 hours. The household questionnaire data indicate that collection times have increased by approximately 60% over the past quarter century, while distance to the forest has not appreciably changed. This suggests forests have become progressively more degraded in recent decades.
In summary, we have substantial evidence of degradation of trees, judged by canopy cover, lopping and regeneration. In contrast, in terms of biomass, the extent of degradation seems less severe. This indicates that degradation measures based on forest biomass alone miss significant dimensions of forest quality. Moreover, the measures used here are not strongly correlated with one another, indicating the need to measure them separately in order to evaluate VP management. Table 3 reports the correlation coefficients across the different measures used. Basal area and basal volume have a correlation of 0.90, and lopping and canopy cover have a correlation of -0.59. Apart from these pairs, all others have substantially lower correlations. In particular, it is worth noting that collection times are hardly correlated with the other measures of degradation.16
4. REGRESSION RESULTS
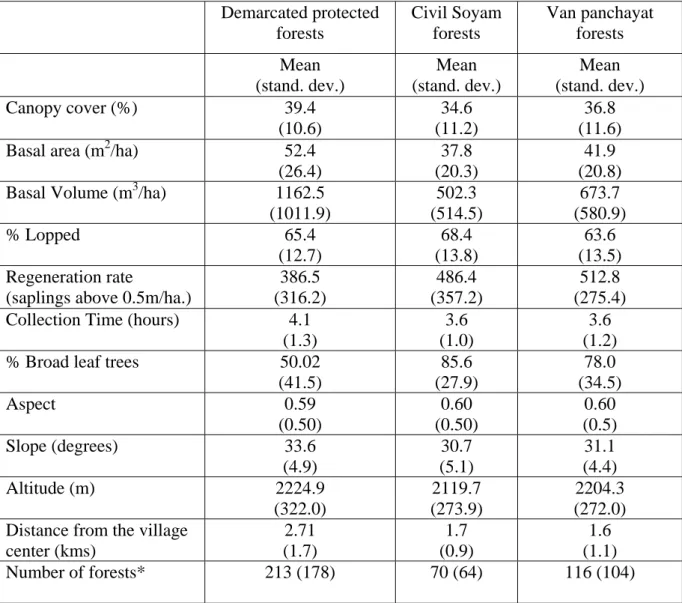
Table 4 displays differences between the three principal types of forests with regard to the various degradation measures, without controlling for any other forest attributes. The differences on most dimensions appear marginal and are not statistically significant. VP forests have marginally lower canopy cover than demarcated state forests, but are slightly less lopped and have a higher regeneration rate.
These raw differences reflect the joint effects of forest geography, forest management, household extraction activities and related community characteristics. In particular they may conceal important differences in geographic characteristics across VP and non-VP forests. The last four rows of Table 4 indicate that VP and Civil Soyam forests are significantly more broad-leaved and closer to the village than state demarcated forests. With respect to aspect, altitude and slope they are similar. Hence VP and Civil Soyam forests are likely to be more highly valued by local villagers, which is likely to translate into greater degradation. We therefore need to control for underlying geographical attributes in assessing the effectiveness of VPs.
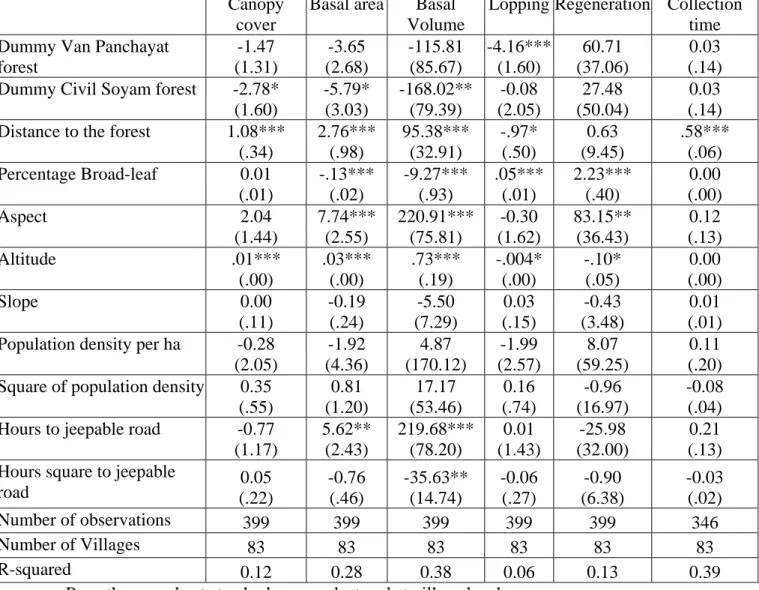
Table 5 shows simple OLS regressions of the six different quality measures of forest patches on forest type, controlling for aspect, altitude, slope, village population density, proximity to roads, and distance of the forest patch from the village. The different forest types considered are VP forests and Civil Soyam forests, with state protected forests constituting the control type. These regressions also provide estimates of the effect of geographical attributes on forest degradation. Controlling for all the other attributes, broad-leaved forests are significantly more likely to be lopped and have lower biomass, while exhibiting higher regeneration rates. Superior aspect is
16
As a result, the strength of a possible feedback effect from forest degradation on firewood collection through increased collection costs is weakened.
associated with higher bio-mass and higher regeneration rates. Higher altitude forests have greater canopy cover and biomass, are lopped more, and regenerate better. More distant forests have superior biomass.
Controlling for these geographic attributes, Table 5 shows that VP forests are significantly less lopped than state protected forests, and are statistically indistinguishable on all other dimensions. The lopping rate is lower by 4.2 percentage points, against an average lopping rate of 65%, which amounts to a 6% difference. Hence if we compare a state protected forest and a VP forest of similar geographical attributes, the VP forest exhibits less extraction of firewood and fodder. On the other hand, comparing Van Panchayat and Civil Soyam forests with a paired-t test (not reported in the table), we find that the two types of forests are similar with respect to all measures of degradation.
The regression results in Table 5 are subject to at least three potential sources of bias. First, it is possible that villages with lower forest quality (for instance due to the unmeasured pressure of neighboring villages, or inability of the community to restrict extraction activities via informal means) or with superior ‘social capital’ tend to have more VP forests. Second, even within a given village area, more degraded patches may be more likely to be converted into VP forests. Third, there may be spillovers from VP forests to other forests in the neighboring area: regulations concerning use of a given VP forests may cause villagers to switch their collections to the other forests in the vicinity. We address each of these possible biases below.17
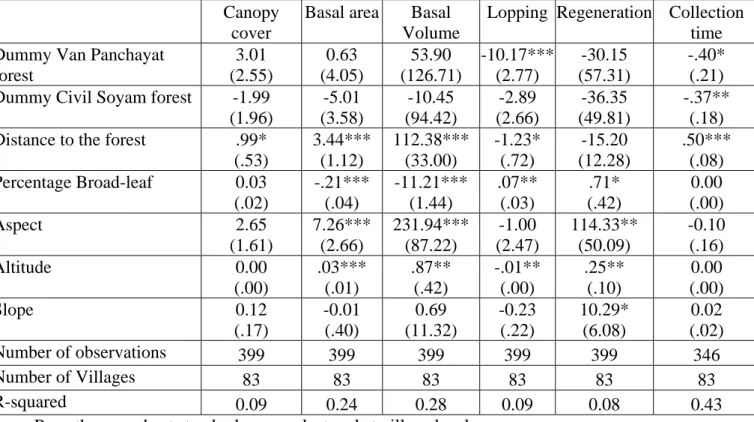
We control for the first source of bias associated with unobserved heterogeneity in village characteristics by including village fixed effects in the regression. Table 6 reports the results obtained under this new specification, which effectively compares different forest patches of similar attributes adjoining the same village area. The estimated difference in lopping between VP patches and state protected patches now increases to 10.2 percentage points, and collection times are lower by 0.4 hours. On other dimensions the differences are statistically insignificant. Our estimates also imply that, in the vicinity of any given village, VP forests are superior to Civil Soyam forests with regard to canopy cover by 14.3% (p-value= .07) and are 12.5% less lopped (p-value=.02). Since crown cover and canopy cover are closely related, the former result is similar to the findings of Somanathan et al (2005). In addition, we find significant improvements on the lopping dimension compared to both state demarcated and Civil Soyam forests.
The differences in results between Table 5 and 6 indicate the importance of unobserved village characteristics. Hence, from now on, we focus on the village fixed effect specification. It is also worth noticing that Table 6 shows no significant difference between Civil Soyams and state reserved forests. This finding is consistent with many of our survey interviews. Our field investigators came away with the impression that there was little distinction made by villagers between different types of state forests. They seemed aware of the administrative status of the forest but not particularly of the underlying restrictions associated with each type. Thus, a forest
17
Finally, it is possible that some types of forests are more susceptible to be used by residents from neighboring villages. We also ran the regressions displayed in Tables 4-12 by also including the number of neighboring villages having access to the same forest. For the sake of brevity, these results are not reported here, but they closely parallel those presented below.
official remarked: “for a villager, a forest is a forest!” Moreover, monitoring by the forest guards appointed by the forest department was reported to be weak. The proportion of villages in which monitoring of firewood extraction in state forests was perceived by villagers as `poor’ was as high as 98%. With respect to timber extraction and medicinal herbs collection, monitoring was reported `poor’ in 68% and 78% of the forests, respectively.
The second source of bias is the possible endogeneity of forest boundaries between VP and non-VP patches within a given village. A VP once formed may wish to draw boundaries so as to appropriate the better part of the forest for itself, leaving the poorer quality parts in the state forest. Or the Forest Department which actually draws the boundaries may willfully create the opposite pattern.18 Somanathan et al (2005) argue that if there was a systematic tendency for forest boundaries to be drawn to include or exclude high quality forests from VP areas, this would tend to be manifested in systematic differences in those attributes strongly correlated with forest quality, such as aspect or altitude. They found that state protected forests tended to exhibit better aspect (i.e., were more north-facing), indicating that selection bias associated with endogenous local boundaries resulted in an underestimate of the benefits of VP management.
Table 4 showed little differences in raw averages of aspect or altitude between VP and non-VP forests. Table 7 explores these differences more carefully, using a conditional logit with village fixed effects, which predicts the likelihood of a forest patch being under VP management on the basis of observed geographical attributes.19 It shows no significant association with aspect, slope or altitude, unlike the findings of Somanathan et al (2005). However we do find a strong correlation with the distance from the village: as shown in Table 4, VP forests are on average 1.3 km closer to the village than the state forests and about the same distance as Civil Soyam forests. Since human pressures on the forest tend to increase in proximity of the villages, this indicates a tendency for more degraded patches to be converted to Van Panchayat forests. Of course, Tables 5 and 6 already controlled for distance to the village from the forest patches and hence reduced the bias due to the possible endogeneity of forest boundaries.
Next, we address the concern that the superior quality of VP forests relative to other forests in the same vicinity may reflect negative spillovers. If villagers respond to restrictions on firewood and fodder collection in VP forests by switching their extraction to other forests, previous estimates of benefits of VP management are upward biased. Table 8 augments the regressions in Table 7 to include composition of other forest area in the same village between Van Panchayat, Civil Soyam and protected state forests. We also control for relative distances to the village, by controlling for the average distance of all the local patches to the village.
Table 8 shows that these additional controls further increase the estimated coefficient of the VP dummy on lopping reduction to 13 percentage points relative to state forests. But there is no statistically significant difference between Civil Soyam and
18
Alternatively, one might argue that the state had a vested interest in showing that decentralization works, and therefore selected better forests for conversion.
19
In our data, aspect is measured on average across the forest, not at the boundaries. This is because our unit of observation is the village and the forests to which it has access .
VP forests. Moreover, VP forests have no significant spillovers on the other forests except in the case of basal area. The superiority of VP over state forests with regard to lopping cannot thus be attributed to negative externalities. Protected state forests on the other hand have strong negative spillovers with regard to canopy cover and lopping on neighboring forests, which can perhaps be attributed to better enforcement of protective measures in those forests. This again reinforces the positive impact of VPs on forest degradation relative to the state protected forests. Conversion of a state-protected forest into a VP forest will enable the negative spillovers of the former to be avoided. The magnitude of these spillovers is, however, small relative to the direct effects.
As a final check for the importance of selection effects, we examine an important source of possible heterogeneity of the effect of VP management: the length of time that a VP has been in existence. There is considerable heterogeneity in ages of VPs in our sample. Some VPs have been in existence since the 1930s, while others have been started under the active encouragement of the Indian government since the 1970s. Table 9 displays the dates of creation of the VPs. More than half were started before 1970, and every decade since then has witnessed creation of some new ones.
The effect of VP management in restricting firewood and fodder collection by local villagers is likely to take some time to manifest itself in measures of forest quality. As more time goes by, these effects should become more important, while selection effects operating on construction of forest boundaries should become less important. Hence one way to gauge the relative effects of forest selection and VP management is to separate old and new VPs, vis-à-vis other types of forest management.
Table 10 shows the effects of separating effects of old and new VPs, where `old’ is defined as having been in existence for over 25 years. The differences in effects are more pronounced for old VPs, with regard to canopy cover and lopping. The difference in lopping between old VPs and state protected forests now expands to 18.3 percentage points, amounting to a 28% difference relative to the mean lopping rate. In contrast, the lopping difference between new VPs and state protected forests is much smaller (6.7 percentage points, contrasted to 18 percentage points for old VPs). Basal area in the new VP forests is significantly lower than state protected forests. These results are consistent with the hypothesis that more degraded forests are more likely to be converted to VP forests, and VP management subsequently improves forest quality, bringing them back on par with other forests. They are not consistent with the opposite hypothesis that better forests tend to be converted to VP forests and VP management subsequently causes them to become more degraded.
5. RELATED LITERATURE
There is relatively little evidence available from large-scale statistical surveys concerning the relative effectiveness of local community management, vis-à-vis state management. Much of the evidence in the literature is based on case-studies, small samples or surveys of geographically narrow areas (e.g., Gibson, McKean and Ostrom (2000), Jodha (2001), Ostrom (1990), Shivakoti and Ostrom (2002), Somanathan (1991), Varughese and Ostrom (2001)). Some case studies of Uttarakhand forests support the view that VPs perform relatively well compared to the state forest department in protecting local forests (e.g., Somanathan (1991)). However, other case
studies often report that VP performance varies widely across villages, with indications of serious degradation for a significant number of local forests. There is also a view that decentralized management mechanisms, where they exist, are eroding under population pressure and market integration (Britt-Kapoor, 1994; Singh, 1999; Ballabh et al, 2002; Agarwal, 2006). Apart from the narrow geographical area and small sample coverage, these studies are usually based on villagers’ perceptions of local forests and VP operations.
Some studies of forest governance utilize data from larger samples drawn from larger geographical areas, but restrict themselves to cross-sectional comparisons across different types of VP forests, based on qualitative perceptions-based data concerning the state of the forest stock (e.g., Agrawal and Yadama (1997), Agrawal and Chhatre (2006)). Agrawal and Yadama, for instance, examine 279 VP forests in the Kumaon region of Uttarakhand, and compare a dichotomous response of local residents concerning their perception of the state of the forest across various aspects of the VP, such as size of the user group, VP age, number of months it hired a forest guard and number of annual meetings, after controlling for population pressure and distance to the forest from a paved road. They find that older VPs and those hiring more guards were associated with a better forest stock. Agrawal and Chhatre examine local perceptions of forest condition in a non-random sample of 95 forests in the neighboring state of Himachal Pradesh that were managed by local communities. After controlling for geographic, demographic and socio-economic village characteristics, they find a better forest condition in those areas where community management has been in existence for a longer time, and is subject to greater internal competition for official positions, but a poorer condition in those that hire guards or impose more fines.20
Reliance on subjective perceptions of local villagers to measure forest quality is fraught with a number of possible biases. Those participating actively in a local user group council may be pre-disposed to view the forest condition in a favorable light. Moreover, respondents often tend to mix means with the ends, depending on whether they focus on VP activities (e.g. the existence of explicit rules) or its impact on the forest (e.g. forest degradation). If the VP forest is well managed informally, the VP does not need to impose many rules and may appear as relatively inactive. Conversely, if the forest is badly degraded, the VP may be very active in strictly enforcing rules. In these two situations, the VP can be considered as ‘effective’ or ‘ineffective’ depending on the respondent’s point of view. In this sense, the ‘effectiveness’ of the VP is very hard to assess without an independent, objective survey of the forest. This highlights the importance of using ecological measures of forest quality, collected by an outside team of trained ecologists.
The other major problem with cross-sectional comparisons of forests across different management types is the bias resulting from unobserved cross-village heterogeneity and endogenous selection. The local community is required to organize itself and apply to form a VP, and works in collaboration with the state Forest department to draw up boundaries between state forests and VP forests. Little is known about how the selection process actually operates on the ground and what biases it might give
20
They explain the latter result in terms of possible endogeneity of monitoring and fines: better forests are in better condition because of lower levels of extraction of firewood and fodder, which in turn necessitate less monitoring and enforcement activities.
rise to. It is possible that villages with superior `social capital’ organize to form VPs: these village communities could be more successful in devising informal means of inducing greater restraint among households with respect to their extraction practices. In that case the differences between VP forests and non-VP forests proxy partly the effect of differences in local `social capital’, thus over-estimating the benefits of VP management per se. Alternatively, villages neighboring more degraded forests may have a stronger incentive to form a VP, and the concerned VP may be motivated to monitor and enforce rules more actively. This would impart a negative correlation between forest condition and measures of VP existence or operation (analogous to those found by Agrawal and Chhatre (2006)). Similar biases would obtain if the state Forest department has a vested interest in keeping better forests under its own control, and deny help to VPs.
A few papers attempt to confront these problems. In the context of local infrastructure projects in northern Pakistan, Khwaja (2006) uses physical measurements of infrastructure and its maintenance by an external team of engineers. He controls for unobserved community characteristics by using community fixed effects, and compares projects within the same community but with differing extents of community participation. He finds that projects with greater community participation are in better condition if the technical issues involved are negligible, and in worse condition if they are significant. In the context of forest degradation in Nepal, Edmonds (2002) and Baland et al (2007) use data from household responses to questions concerning firewood extraction, and relate these to existence of self-governing forest user groups, controlling for a range of household and community characteristics.21 Baland et al (2006) extend this approach to the mid-Himalayan ranges of Uttarakhand and Himachal Pradesh, using data which overlaps with that used in this paper. All these papers estimate a 10-15% reduction in firewood extraction associated with the existence of a self-governing user group. Nevertheless, the dependent variable in these papers is the extent of firewood extraction by neighboring households, rather than direct measures of the forest stock. Firewood collection by neighboring villagers is one possible source of forest degradation among many others (such as natural calamities, logging, timber removal); there is no firm evidence of its relative significance. This paper complements the literature by examining evidence directly on forest quality rather than on firewood collection levels of residents (as done, e.g., in Baland et al (2006)).
The paper most closely related to ours is Somanathan, Prabhakar and Mehta (2005) which also focuses on forest stock measurement. They use satellite-based measures of vegetation indices (commonly used to predict canopy cover of forests) over geographical regions spanning VP and non-VP forests, from a large random sample covering a wide area in Uttarakhand. This enables them to avoid subjective perception-based measures of local forest quality, and problems of narrow geographic coverage. Moreover, they control for a number of geographical attributes (such as slope, aspect, altitude and distance from the village) that affect forest quality, and unobserved village characteristics by using village fixed effects. They find that VP broad-leaved forests had better crown cover compared with unprotected broad-leaved forests, and about the same as state protected forests. Moreover, they find that VP and
21
Edmonds uses a number of methods to control for endogeneity bias, such as a comparison between communities forming user groups at different points of time, and instruments (such as distance to a forest range post) for user group formation.
non-VP forests did not differ systematically with respect to altitude, aspect and slope, suggesting there was little bias caused by endogenous selection of forest boundaries within the vicinity of a given village. They conclude that VPs were at least as effective as the state forest department in managing forests, though at much lower cost.
This paper complements Somanathan et al (2005) by utilizing more precise, ground-level measurement of forest quality using various measures that capture more dimensions of forest quality, and a larger variety of controls for endogenous selection. The satellite-based vegetation index they use is a predictor of canopy cover of the forest, whereas we measure canopy cover directly. Apart from this, the regeneration potential of the forest depends on many other dimensions that cannot be captured by satellite data. Lower branches of trees can be severely lopped, while trunks and tree crowns are left intact. Such trees have few chances of survival in the medium term, yet will not be reflected in current canopy cover estimates. The collection of leaf-litter for fodder or grazing often restricts the growth of saplings at the foot of the tree, ultimately restricting the future growth of the tree, and making forests vulnerable to invasion by inferior species. Effects of severe lopping or leaf-litter collection today are likely to persist for many decades due to likely regeneration failure of the stable forest species (Thadani (1999), Thadani and Ashton (1995), Singh and Singh (1987)). Our ability to measure lopping and regeneration enables us to compare VP and non-VP forests on these dimensions in addition to canopy cover and tree biomass, and we do find significant differences with regard to these dimensions. These findings reinforce the view expressed in their paper, concerning the effectiveness of VP management.
6. CONCLUDING COMMENTS
In this paper, we investigated the impact of community management on forest degradation in the Indian Himalayas. More precisely, we compared forests managed by local communities to those managed by the State forest department in the Indian state of Uttarakhand. Our results are based on a unique data set collected directly at the forest level, on a wide range of forest quality measures. As in Somanathan et al (2005), we find little differences across forests in terms of canopy cover, the measure usually used in satellite imagery. By contrast, with regards to lopping, the most direct measure of human pressure due to firewood and fodder collection, we find that VP forests are significantly less degraded than state protected forests.
Successive controls for unobserved heterogeneity and endogenous selection of forest type increased the estimated differences between VP and other forest types. The results were also robust with respect to controls for possible local spillover effects across forest types. The quantitative magnitude of the difference in lopping is about 20%? This difference is more pronounced for older VPs that also exhibit a better measure of canopy cover, consistent with the view that these differences reflect the impact of community management per se rather than selection effects.
These results are also corroborated by other studies of firewood and fodder collection by neighboring households (Baland et al (2006)). There, it is found that proximity to Van Panchayat forests was associated with significantly lower use of firewood compared with state forests, after controlling for household, village and forest
characteristics. Those estimates imply that conversion of state protected forests to VP forests would be associated with a 20% reduction in firewood collections. This is roughly the same order of magnitude of the estimated difference in extent of lopping that we found here. Edmonds (2002) found an 11% reduction in household firewood extraction in Nepal forest user groups.
Local community management thus appears to be an attractive option as a means of halting forest degradation in the Himalayas, particularly when account is taken of the costs incurred by the State Forest Department. However, some words of caution are in order. First, the use of cross-sectional data will always leave room for possible biases resulting from unobserved heterogeneity. We have controlled for unobserved village level characteristics with the use of village fixed effects, and for endogenous selection of forest types by a variety of indirect methods. Panel data or use of randomized treatments would be needed to reduce these biases even further. However, the effects of community management may take a long time to manifest themselves, and may exhibit considerable heterogeneity across regions, so the scope for randomized treatment evaluations are limited unless the experiments are conducted over a wide geographic area and over long spans of time. Second, the ecological benefits from conversion to local community management may take a long time to materialize, while alternative policies may yield quicker and larger benefits. Baland et al (2006) estimated that a 33% subsidy on LPG cylinders would moderate firewood collection by more than a conversion of all state-protected forests to VP forests. By acting on household incentives directly, such energy policies may therefore be more effective than community management initiatives. Moreover, the scope for converting state forests to Van Panchayats is limited by the willingness of the local community to organize itself to form and manage a Van Panchayat, particularly when they have not done so in the past.
REFERENCES
Agarwal, S. (2006): ‘Community Forestry in Transition: 60 years of Experience in the Indian Central Himalaya.’ Paper submitted to the IASCP Conference, Bali. June 19-23.
Agrawal, A. and G.Yadama (1997):`How do Local Institutions Mediate Market and Population Pressures on Resources? Forest Panchayats in Kumaon, India,’
Development and Change, vol. 28, No. 3, pp. 435-465.
Agrawal A. and A. Chhatre (2006), `Explaining Success on the Commons:
Community Forest Governance in the Indian Himalaya,’ World Development, 34(1), 149-166.
Baland J.M., P. Bardhan, S. Das, D. Mookherjee and R. Sarkar (2007): ‘Deforestation in the Indian Himalayas: an assessment’, working paper.
Baland J.M., P. Bardhan, S. Das, D. Mookherjee and R. Sarkar (2006), `Managing the Environmental Consequences of Growth: Forest Degradation in the Indian Mid-Himalayas,’ Indian Policy Forum, 2006-07, Volume III, Sage Publications India. Baland J.M., P. Bardhan, S. Das, D. Mookherjee and R. Sarkar (2007), `Inequality, Collective Action and the Environment,” in J.M. Baland, P. Bardhan and S. Bowles (Ed.). Inequality, Cooperation and Environmental Sustainability, Princeton University Press.
Baland, J.M. and J. P. Platteau, (1996): ‘Halting Environmental Degradation. Is there a Role for Rural Communities?’FAO, Oxford University Press.
Ballabh, V., K. Balooni and Shibani Dave, (2002): ‘Why Local Resource
Management Institutions Decline. A Comparative Analysis of Van Panchayats and Forest Protection Committees in India,’ World Development, Vol. 30, No. 12, pp. 2153-2167
Beck T. and C. Nesmith (2001), `Building on Poor People’s Capacities. The Case of Common Property Resources in India and West Africa,’ World Development, 29(1), 119-133.
Britt-Kapoor, C. (1994): ‘A Tale of Two Committees. Villager’s Perspective on Local Institutions, Forest Management and ResourceUse in Two Central Himalayan Indian Villages,’ Rural Development Forestry Network, Network Paper 17a, Summer. Dasgupta P. (1996), ‘The Economics of the Environment’, Environment and Development Economics, 1, 387—428.
Dasgupta P., S. Levin and J. Lubchenco (2000), `Economic Pathways to Ecological Sustainability: Challenges for the New Millenium,” Bioscience, 50(4), 339—345.
Edmonds E. (2002), ‘Government Initiated Community Resource Management and Local Resource Extraction from Nepal's Forests,’ Journal of Development Economics 68(1), June 2002, 89-115.
Gibson C., McKean M. and Ostrom E. (editors), (2000), People and Forests:
Communities, Institutions and Governance, MIT Press, Cambridge MA and London. Jodha N. S. (1986), ``Common Property Resources and the Rural Poor,” Economic and Political Weekly, 21, 1169-1181.
Jodha N.S. (2001), `Common Property Resources in Crisis,’ in Life on the Edge Sustaining Agriculture and Community Resources in Fragile Environments, Oxford University Press, New Delhi.
Khwaja A. (2006), `Can Good Projects Succeed in Bad Communities?” Working Paper, Kennedy School of Government, Harvard University.
Kumar R. and G. Shahabuddin (2005), `Effects of Biomass Extraction on Vegetation Structure, Diversity and Composition of Forests in Sariska Tiger Reserve, India,’ Environmental Conservation, 32:33, 248-259.
Mansuri G. and V. Rao (2004), `Community-Based and –Driven Development: A Critical Review,’ World Bank Research Observer, 19(1), 1-39.
Ostrom E. (1990), Governing the Commons: The Evolution of Institutions for Collective Action, Cambridge: Cambridge University Press.
Rawat, A.S. (1999): ‘Forest Management in Kumaon Himalaya. Struggle of the Marginalised People,’ Indus Publishing Cy, New Delhi.
Sarkar, R. (2008), ‘Decentralised Forest Governance in Central Himalayas: A Re-evaluation of Outcomes, Economic and Political Weekly, 43 (18).
Shivakoti G. and E. Ostrom (Editors) (2002), Improving Irrigation Governance and Management in Nepal, Institute for Contemporary Studies Press, Oakland.
Singh, Satyajit (1999): ‘Collective Dilemmas and Collective Pursuits. Community Management of Van Panchayats (forest councils) in the UP Hills,’ Wasteland News, May-July, pp 29-45
Singh, J. S. and S. P. Singh (1987): ‘Forest Vegetation of the Himalaya,’ The Botanical Review, 53: pp 80-192
Somanathan, E., (1991): ‘Deforestation, Property Rights and Incentives in the Central Himalayas,’ Economic & Political Weekly, 26: PE37-46.
Somanathan, E., R. Prabhakar and B.S. Mehta, (2005): ‘Does Decentralisation Work? Forest Conservation in the Himalayas,’ BREAD Working Paper, No. 096, June.
Somanathan, E., R. Prabhakar and B.S. Mehta, (2006): ‘How Degraded are Himalayan Forests?,’ Current Science, Vol. 91, July, pp 61-67
Thadani, R. and P.M.S. Ashton (1995), ‘Regeneration of Banj Oak (Quercus
Leucotrichophora) in Central Himalaya,’ Forest, Ecology and Management, Vol. 78, pp. 217-224.
Thadani, R. (1999), ‘ Disturbance, Micro Climate and the Competitive Dynamics of Tree Seedlings in Banj Oak Forest of the Central Himalaya,’ Ph.D Thesis, Yale University.
Varughese G. and E. Ostrom (2001), ``The Contested Role of Heterogeneity in Collective Action: Some Evidence from Community Forestry in Nepal”, World Development, 29
(5), May 2001, pp. 747-765.
Wade, R., (1987): ‘The Management of Common Property Resources: Finding a Cooperative Solution,’ The World Bank ResearchObserver, Vol. 2, No. 2, pp 219-234.
Table 1: Forest Characteristics
Mean Standard deviation
Forests per village 5.57 1.93
State forests per village 2.57 1.99
Civil Soyam forests per village 0.84 1.66 Van Panchayat forests per village 1.4 1.64 % Broad-leaf species in a forests 64.4 40.47
Aspect* 0.58 0.4
Altitude (meters) 2200.49 301.78
Slope (degree) 32.4 4.95
Distance to village centre (km) 2.21 1.54
Number of villages 83
Number of observations 399
*: Aspect equals 1 if it is most conducive to vegetation growth (from east to north), zero if it is least conducive to growth (south to west) and 0.5 for combinations of the two (SE or NW).
Table 2: Descriptive Measures of Forest Degradation
Mean Median Proportion of degraded forests* % Canopy Cover 37.79 (11.11) 37.5 100 Basal Area (m2/ha) 46.79 (24.61) 41.31 47.12 Basal Volume (m3/ha) 904.59 (867.49) 671.58 na % Lopped 65.39 (13.17) 67.11 99 Regeneration rate (number of saplings above 0.5m/ha) 440.75 (317.42) 383.33 100 Collection Time (hours) 3.89 (1.23) 4 na Number of Observations: 399.
*:Degradation thresholds: Canopy cover below 80%, Basal area below 40 m2/ha, Lopping above 30%, Regeneration rate below 2000/ha.
Figure 1: Distribution of forests according to canopy cover 0 5 10 15 Pe rc e n t 0 20 40 60 80 canopy_cover
Figure 2: Distribution of forests according to basal area
0 10 20 30 Pe rc e n t 0 50 100 150 200 250 basal_area
Figure 3: Distribution of forests according to lopping 0 2 4 6 8 10 Pe rc en t 20 40 6 0 80 lopp in g%
Table 3: Coefficients of correlation between measures of forest quality
Canopy Cover
Basal Area Basal Volume
Lopping Regeneration Collection Time
% Canopy Cover 1.00
Basal Area (m2/ha) 0.32 1.00
Basal Volume (m3/ha) 0.25 0.90 1.00 % Lopped -0.59 -0.21 -0.16 1.00 Regeneration (number of saplings above 0.5m/ha) 0.04 -0.12 -0.23 -0.10 1.00 Collection Time (hours) 0.06 0.13 0.09 -0.02 0.05 1.00
Table 4: Characteristics of Forests by Forest Status Demarcated protected forests Civil Soyam forests Van panchayat forests Mean (stand. dev.) Mean (stand. dev.) Mean (stand. dev.) Canopy cover (%) 39.4 (10.6) 34.6 (11.2) 36.8 (11.6)
Basal area (m2/ha) 52.4
(26.4)
37.8 (20.3)
41.9 (20.8)
Basal Volume (m3/ha) 1162.5
(1011.9) 502.3 (514.5) 673.7 (580.9) % Lopped 65.4 (12.7) 68.4 (13.8) 63.6 (13.5) Regeneration rate
(saplings above 0.5m/ha.)
386.5 (316.2) 486.4 (357.2) 512.8 (275.4)
Collection Time (hours) 4.1
(1.3)
3.6 (1.0)
3.6 (1.2)
% Broad leaf trees 50.02
(41.5) 85.6 (27.9) 78.0 (34.5) Aspect 0.59 (0.50) 0.60 (0.50) 0.60 (0.5) Slope (degrees) 33.6 (4.9) 30.7 (5.1) 31.1 (4.4) Altitude (m) 2224.9 (322.0) 2119.7 (273.9) 2204.3 (272.0) Distance from the village
center (kms) 2.71 (1.7) 1.7 (0.9) 1.6 (1.1) Number of forests* 213 (178) 70 (64) 116 (104)
Table 5: Forest Quality OLS regressions: Pooled Sample
Parentheses: robust standard errors, clustered at village level ***, **, *: significant at 1,5,10% respectively
Canopy cover
Basal area Basal Volume
LoppingRegeneration Collection time Dummy Van Panchayat
forest -1.47 (1.31) -3.65 (2.68) -115.81 (85.67) -4.16*** (1.60) 60.71 (37.06) 0.03 (.14) Dummy Civil Soyam forest -2.78*
(1.60) -5.79* (3.03) -168.02** (79.39) -0.08 (2.05) 27.48 (50.04) 0.03 (.14) Distance to the forest 1.08***
(.34) 2.76*** (.98) 95.38*** (32.91) -.97* (.50) 0.63 (9.45) .58*** (.06) Percentage Broad-leaf 0.01 (.01) -.13*** (.02) -9.27*** (.93) .05*** (.01) 2.23*** (.40) 0.00 (.00) Aspect 2.04 (1.44) 7.74*** (2.55) 220.91*** (75.81) -0.30 (1.62) 83.15** (36.43) 0.12 (.13) Altitude .01*** (.00) .03*** (.00) .73*** (.19) -.004* (.00) -.10* (.05) 0.00 (.00) Slope 0.00 (.11) -0.19 (.24) -5.50 (7.29) 0.03 (.15) -0.43 (3.48) 0.01 (.01) Population density per ha -0.28
(2.05) -1.92 (4.36) 4.87 (170.12) -1.99 (2.57) 8.07 (59.25) 0.11 (.20) Square of population density 0.35
(.55) 0.81 (1.20) 17.17 (53.46) 0.16 (.74) -0.96 (16.97) -0.08 (.04) Hours to jeepable road -0.77
(1.17) 5.62** (2.43) 219.68*** (78.20) 0.01 (1.43) -25.98 (32.00) 0.21 (.13) Hours square to jeepable
road (.22) 0.05 -0.76 (.46) -35.63** (14.74) -0.06 (.27) (6.38) -0.90 -0.03 (.02)
Number of observations 399 399 399 399 399 346
Number of Villages 83 83 83 83 83 83