Neurobiology of Disease
Changes in Brain Function Occur Years before the Onset of
Cognitive Impairment
Lori L. Beason-Held,
1Joshua O. Goh,
1,2Yang An,
1Michael A. Kraut,
3Richard J. O’Brien,
4Luigi Ferrucci,
1and Susan M. Resnick
11Intramural Research Program, National Institute on Aging, National Institutes of Health, Baltimore, Maryland 21224,2Graduate Institute of Brain and Mind Sciences, National Taiwan University College of Medicine, Taipei 100, Taiwan,3Department of Radiology, Johns Hopkins Hospital, Baltimore, Maryland 21287, and4Department of Neurology, Johns Hopkins University School of Medicine, Baltimore, Maryland 21224
To develop targeted intervention strategies for the treatment of Alzheimer’s disease, we first need to identify early markers of brain changes that
occur before the onset of cognitive impairment. Here, we examine changes in resting-state brain function in humans from the Baltimore
Longitudinal Study of Aging. We compared longitudinal changes in regional cerebral blood flow (rCBF), assessed by
15O-water PET, over a mean
7 year period between participants who eventually developed cognitive impairment (n
⫽ 22) and those who remained cognitively normal (n ⫽
99). Annual PET assessments began an average of 11 years before the onset of cognitive impairment in the subsequently impaired group, so all
participants were cognitively normal during the scanning interval. A voxel-based mixed model analysis was used to compare groups with and
without subsequent impairment. Participants with subsequent impairment showed significantly greater longitudinal rCBF increases in
orbito-frontal, medial orbito-frontal, and anterior cingulate regions, and greater longitudinal decreases in parietal, temporal, and thalamic regions compared
with those who maintained cognitive health. These changes were linear in nature and were not influenced by longitudinal changes in regional
tissue volume. Although all participants were cognitively normal during the scanning interval, most of the accelerated rCBF changes seen in the
subsequently impaired group occurred within regions thought to be critical for the maintenance of cognitive function. These changes also
occurred within regions that show early accumulation of pathology in Alzheimer’s disease, suggesting that there may be a connection between
early pathologic change and early changes in brain function.
Introduction
It is estimated that as many as 5.4 million individuals are
cur-rently diagnosed with Alzheimer’s disease (AD) in the United
States alone, and this number is expected to triple by the year
2050. The marked increase in the number of people with AD has
tremendous implications not only for an already overburdened
healthcare system, but also for the individuals themselves and for
their 15 million caretakers (
Alzheimer’s Association, 2012
).
Current experimental treatments of AD revolve around
re-versing existing pathology in the brains of those already
diag-nosed with the disease, primarily focusing on
-amyloid removal
(
Callaway, 2012
;
Castellani and Perry, 2012
). So far, however, the
participants in these studies have not shown significant cognitive
benefits related to the removal of
-amyloid.
In AD, abnormal accumulation of amyloid and tau proteins in
the brain are thought to begin 10 –20 years before the onset of
overt symptoms (
Hof et al., 1996
;
Perl, 2010
;
Bateman et al.,
2012
), suggesting that interventions designed to prevent
accu-mulation of amyloid or other pathologic proteins may be more
effective than attempting to reverse the pathology that already
exists. However, for these early interventions to be successful,
they need to be selectively administered to persons who will likely
develop the disease in their lifetimes. Thus, it is critical to identify
early biomarkers that are strongly predictive of future change in
cognition.
Here, we investigate early changes in brain activity that occur
before the initial onset of symptoms in those who go on to
de-velop significant cognitive impairment (CI). As regional cerebral
blood flow (rCBF) is a marker of neuronal activity (
Jueptner and
Weiller, 1995
), we used resting-state
15O-water PET data from
participants in the Baltimore Longitudinal Study of Aging
(BLSA) to examine longitudinal changes rCBF collected over a
mean 7 year period in 22 participants who subsequently develop
impairment in the years after the scan interval. We compare these
changes with those that occur over the same period in 99
partic-ipants who remained cognitively normal.
The goal was to determine whether accelerated activity
changes can be detected in the brains of those who develop future
cognition dysfunction, and whether the distribution of these
changes sheds light on the regional vulnerability of the brain
before CI. Based on the regional distribution of early amyloid and
Received April 2, 2013; revised Sept. 11, 2013; accepted Sept. 17, 2013.
Author contributions: M.A.K. and S.M.R. designed research; L.L.B.-H., M.A.K., R.J.O., L.F., and S.M.R. performed research; J.O.G. contributed unpublished reagents/analytic tools; L.L.B.-H., J.O.G., and Y.A. analyzed data; L.L.B.-H. wrote the paper.
This work was supported in part by the Intramural Research Program of the National Institutes of Health, National Institute on Aging, and Research and Development Contract N01-AG-3-2124. We thank the BLSA participants and staff for their dedication to these studies and the staff of the Johns Hopkins PET facility for their assistance.
The authors declare no competing financial interests.
Correspondence should be addressed to Dr. Lori Beason-Held, National Institute on Aging/LBN, 251 Bayview Boulevard, Baltimore, MD 21224-6825. E-mail: heldlo@mail.nih.gov.
DOI:10.1523/JNEUROSCI.1402-13.2013
tau pathology (
Braak and Braak, 1991
;
Wolk and Klunk, 2009
)
and on the regional changes in brain activity noted in the
prodro-mal mild cognitive impairment (MCI) stage of AD (
de Leon et al.,
2007
;
Pihlajama¨ki et al., 2009
), we hypothesized that frontal,
tem-poral, and parietal association cortices would be the most likely
regions to exhibit altered activity levels before the onset of illness.
Materials and Methods
Participants. We used data from 121 older participants in the
neuroim-aging substudy (Resnick et al., 2000) of the BLSA (Shock et al., 1984) (Table 1) who had both MRI and PET imaging assessments for at least three annual visits. Of these participants, 99 (57 male, 42 female) re-mained cognitively normal (CN) throughout the study. The remaining 22 (11 male, 11 female) participants were diagnosed with CI over time. CI was determined by consensus diagnosis using Diagnostic and Statistical Manual of Mental Disorders Third Edition, Revised (DSM-III-R) (1987) criteria for dementia, and the National Institute of Neurological and Communication Disorders-Alzheimer’s Disease and Related Disorders Association criteria (McKhann et al., 1984), using neuropsychological diagnostic tests and clinical data (Driscoll et al., 2006). None of the par-ticipants had a history of CNS disease (epilepsy, stroke), psychiatric dis-orders, severe cardiac disease (myocardial infarction, coronary artery disease requiring angioplasty or bypass surgery), or metastatic cancer at enrollment.
The local Institutional Review Board approved the research protocol for this study, and written informed consent was obtained at each visit from all participants.
Neuropsychological testing. During each visit, participants completed a
battery of 12 neuropsychological tests evaluating six cognitive domains. Memory was assessed using the California Verbal Learning Test and Benton Visual Retention Test (BVRT). Word knowledge and verbal abil-ity were measured using Primary Mental Abilities Vocabulary. Verbal fluency was assessed by Letter (i.e., F, A, and S) and Category fluency tests. Attention and working memory were measured by the Digit Span Test of the Wechsler Adult Intelligence Scale-Revised and the Trail Mak-ing Test. Digits Backward, Trails B, and Verbal fluency (categories and letters) assessed executive function. The Card Rotations Test assessed visuospatial function. Neuropsychological testing occurred at each neu-roimaging PET visit and continued during the years after the PET phase of the study.
PET scanning parameters. Annual PET scans were administered from
baseline through year 8 of the study (Fig. 1). Valid scans for each partic-ipant were included in the analyses. In CN particpartic-ipants, scans were ex-cluded from the point of diagnosis onward in those who developed significant health-related issues (stroke n⫽ 3, seizure disorder n ⫽ 1, lymphoma n⫽ 1, aphasia n ⫽ 1). Of the 22 CI, four had onset of CI before follow-up year 8 (1 individual had onset at year 5, 2 individuals at year 6, and 1 individual at year 7 of the study). We excluded scans on and after symptom onset in these individuals, so that data used in the analyses were only those collected before the onset of impairment. The follow-up
scan interval examined in this study was 7.4⫾ 1.5 years (mean ⫾ SD) for the CN group and 7.0⫾ 1.7 years for the CI group. The mean time from baseline to onset of CI in the CI group was 10.9⫾ 3.7 years.
Each PET session included a resting-state scan in which participants were instructed to keep their eyes open and focused on a computer screen covered by a black cloth. PET measures of rCBF were obtained using [15O]water. For each scan, 75 mCi of [15O] water was injected as a bolus. Scans were performed on a GE 4096⫹ scanner, which provides 15 slices of 6.5 mm thickness. Images were acquired for 60 s from the time the total radioactivity counts in the brain reached threshold level. Attenuation correction was performed using a transmission scan acquired before the emission scans.
PET image preprocessing and mixed model analysis. Image
preprocess-ing was done uspreprocess-ing Statistical Parametric Mapppreprocess-ing (SPM5; Wellcome Department of Cognitive Neurology). For each participant across follow-up sessions, PET images were realigned to the first session, spa-tially normalized to the MNI template space with 2⫻ 2 ⫻ 2 mm resolu-tion, and smoothed using a full width at half maximum of 12 mm. Voxel rCBF values for all images were ratio adjusted and scaled to a mean global flow of 50 ml/100 g/min.
A mixed model approach was used to analyze the PET data, which enabled us to account for individual differences in longitudinal trends more effectively. The mixed model was implemented using R version 2.11.1 running the packages AnalyzeFMRI version 1.1–12 and lme4 ver-sion 0.999375-37, and included fixed effects of age, sex, and group, and the interaction of each of these measures with change over time. The focus of the current analysis was the interaction between group (CN vs CI) and rCBF change over time, identifying brain regions that show significant differences in longitudinal rCBF changes between partici-pants who retain normal cognition compared with those who develop subsequent CI. Baseline differences between the groups were also as-sessed. Whole-brain statistical contrast t-maps of group differences at baseline and differences in change over time (group⫻ scan interval interac-tion) were generated using a statistical threshold of p⬍ 0.005 as recom-mended for PET data by the PET Working Group of the National Institutes of Health/NIA Neuroimaging Initiative (http://www.nia.nih.gov/about/ events/2011/positron-emission-tomography-working-group) with an addi-tional cluster size threshold ofⱖ50 voxels (400 mm3).
Because the two groups differed in baseline age, an age-matched sen-sitivity analysis was also performed in a subsample of participants using a 3:1 ratio of CN:CI (CN age, 72.2⫾ 6.5 years, mean ⫾ SD; median age 69.9 years, range 61.3– 85.9 years; CI age 74.1⫾ 7.5 years, median 71.2 years, range 61.0 – 85.0 years; no significant age difference between the groups, p⫽ 0.25).
To determine whether change in tissue volume of each region had an effect on the rCBF change in that area, we repeated all analyses with covariate adjustment for the longitudinal MRI volumes of each signifi-cant cluster observed in the mixed model results.
To further examine the changes in rCBF over time, rCBF values of significant regions in the voxel-based full sample analysis were extracted from a 4 mm spherical region centered on the local maxima of each area using the Marsbar SPM toolbox (Brett et al., 2002). Using the age- and sex-adjusted rCBF values, annual rates of change, direction of change, and characterization of the linear or nonlinear trajectory of rCBF change were then estimated for each region using a mixed model approach. These rCBF values were also used to examine the relationship between change in neuropsychological performance and change in rCBF over time. Here, the slope of performance change on each test was correlated with the slope of rCBF change from each region in the two groups.
MRI scanning. Scanning was performed on a GE Signa 1.5 Tesla
scan-ner. A 3-D T1-weighted spoiled gradient refocused MRI scan (35 ms TR, 5 ms TE, 24 cm FOV, 45° flip angle, 256⫻ 256 matrix, 0.94 ⫻ 0.94 mm voxel size, 1.5 mm slice thickness, 124 slices) was obtained annually at each imaging visit.
MRI volume calculation. The MRI scans were segmented into gray
matter, white matter, and CSF and spatially normalized into stereotactic space using a high-dimensional elastic warping method (Davatzikos et al., 2001) and a volume-preserving transformation (Shen and Da-vatzikos, 2002). Binary maps of the clusters showing rCBF differences Table 1. Group demographics
CN CI
N 99 (57 male) 22 (11 male)
Baseline age (yr) 68.6 (7.5) 74.1 (7.5)a
Median age (yr) 68.2 71.2
Age range (yr) 56.1– 86.0 61.0 – 85.0
Scan interval (yr) 7.4 (1.5) 7.0 (1.7)
Years to symptom onset NA 10.9 (3.7)
Education (yr) 16.3 (2.7) 16.4 (3.0) Hypertension (%) 46.5 63.6 Diabetes (%) 10.1 13.6 Hypothyroidism (%) 7.1 9.1 APOE 3/4 (%) 21.2 22.7 APOE 4/4 (%) 4.0 4.5
aThe cognitively impaired group is significantly older than the normal group ( p⫽ 0.002). No other differences
between the two participant groups were generated from the PET analy-sis, and total volumes of gray⫹ white matter were calculated within each cluster for each participant at each imaging visit. As described above, the volume of each cluster at each visit was then included as a covariate in the secondary PET analyses adjusting for tissue volume.
Results
Neuropsychological testing
Twenty-two participants received a clinical diagnosis of CI after
the last PET CBF scan used in the current analysis. Nine
partici-pants were diagnosed with MCI, and 13 were diagnosed with
Alzheimer’s disease. In this group, the mean interval from
base-line to onset of impairment for the CI group was 10.9 (3.7) years
(range 4 –15 years).
Linear mixed models were used to examine differences at
baseline and in longitudinal change in task performance before
the onset of impairment. Relative to CN, the CI group performed
similarly on most cognitive measures at baseline and in
perfor-mance change over time. Differences were only noted on the
Digit Span Test, where the CI group performed below the CN
group on Digits Backwards at baseline (CN
⫽ 7.9 (0.2) digits,
CI
⫽ 6.8 (0.4) digits; p ⫽ 0.02) and showed a decline in Digits
Forward performance over time (CN
⫽ 0.02 slope of change,
CI
⫽ ⫺0.08 slope; p ⫽ 0.03).
Baseline differences in rCBF
Significant differences were noted at baseline between the CI and
CN groups (
Fig. 2
). Higher rCBF was noted in the middle
occip-ital gyrus (BA 19, p
⬍ 0.001) in the CI relative to the CN group.
Lower rCBF in the CI group was seen in the middle frontal gyrus
(BA 9, p
⬍ 0.001), precentral gyrus (BA 4, p ⬍ 0.001), inferior
temporal gyrus (BA 20, p
⬍ 0.001), caudate (p ⬍ 0.001), and
putamen ( p
⫽ 0.001). Of these baseline differences, only
de-creased rCBF noted in middle frontal gyrus, inferior temporal
gyrus, caudate, and putamen survived correction for regional
MRI volume.
Longitudinal differences in rCBF
We found significant differences in longitudinal rCBF change
between the CI and CN groups (
Fig. 3
;
Table 2
). Several regions
exhibited greater increases in rCBF over time in the CI compared
with CN group. These areas primarily involved the frontal lobe
and included orbitofrontal (BA 11) and medial frontal (BA 10)
regions, extending into the anterior cingulate cortex (BA 32).
Areas of accelerated rCBF decrease in CI compared with CN
included the insula, supramarginal gyrus (BA 40), medial inferior
parieto-occipital cortex (BA 18), lingual gyrus (BA 18), and
thal-amus. The brainstem also appeared as a region of decreased
rCBF, but this difference was the result of a reduced increase in
rCBF over time in CI relative to CN. All of the regions survived
regional MRI volume correction, except the insula, which was no
longer significant after correction.
Shape analysis of the trajectories of longitudinal rCBF change
showed no significant nonlinear changes over time, suggesting
that all of the changes were linear in nature (
Fig. 4
). The annual
rates of change and the effective direction of change for each
region are shown in
Table 3
.
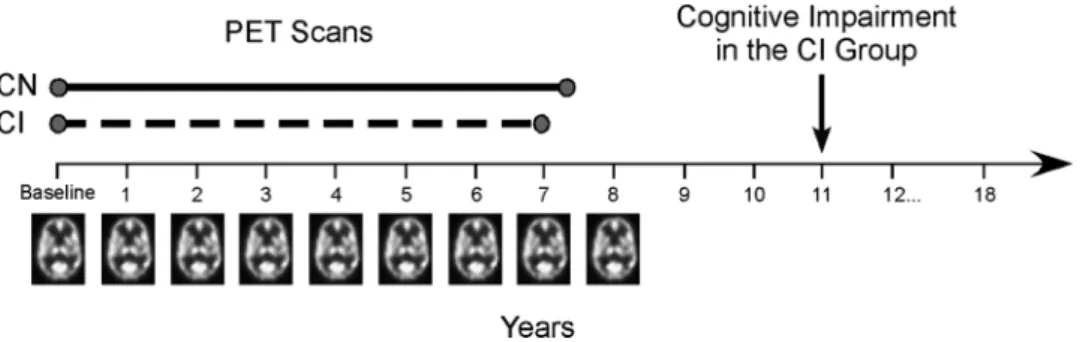
Figure 1. Study design. In the initial phase of the neuroimaging study, annual resting-state PET scans were administered through follow-up year 8 of the study. Participants also performed a battery of cognitive tests each year. A group of participants developed initial symptoms of cognitive impairment on an average corresponding to year 11 (symptom onset, mean⫾ SD, 10.9 ⫾ 3.7 years from baseline; n⫽ 22). Changes in brain activity before the onset of impairment were assessed in CI (scan interval examined, mean ⫾ SD, 7.0 ⫾ 1.7 years) and compared with those who remained CN (scan interval examined, mean⫾ SD, 7.4 ⫾ 1.5 years; n ⫽ 99) throughout the study.
Figure 2. Group differences at baseline. Axial slices showing regions where the CI group exhibited higher rCBF (red) and lower rCBF (blue) at the baseline assessment relative to the CN group. The higher rCBF in left occipital cortex (slice 2) and the lower rCBF in the right precentral gyrus (slice 4) did not remain significant after correction for MRI tissue volume.
Age-matched analysis
The results of the age-matched analyses were similar to those
observed with the full sample. The only difference between the
findings of the age-matched sample and the full sample was a lack
of significant longitudinal rCBF decline in the insula and
supra-marginal gyrus (BA 40) of the age-matched CI relative to the CN
groups (denoted in
Table 2
).
Neuropsychological performance and change in rCBF
Correlations of the change in test performance and the change in
rCBF revealed only one significant relationship. Increased errors
over time on the BVRT correlated negatively with orbitofrontal
rCBF in the CN group (r
⫽ ⫺0.23, p ⫽ 0.02) and positively with
orbitofrontal rCBF in the CI group (r
⫽ 0.43, p ⫽ 0.04). This
suggests that, over time, poorer performance (increased BVRT
errors) was related to the decreased rCBF observed in the CN
group and to the increased rCBF observed in the CI group
within this region (trajectory of orbitofrontal rCBF change
shown in
Fig. 4
).
Discussion
Using longitudinal neuroimaging data from the BLSA, we have
shown that people who subsequently develop CI show
acceler-ated changes in brain activity that begin years before the onset of
symptoms. These changes include both relative increases in
activity over time in frontal regions and decreases in activity in
temporal and parietal areas thought to be critical for different
aspects of cognition. The changes are also found within
re-gions that show early accumulation of pathology in
Alzhei-mer’s disease.
Many of the group differences in change over time were
lo-cated in the frontal lobe of the brain, with each area exhibiting
accelerated linear increases in activity over time in the CI
com-pared with CN group. These regions included orbitofrontal,
me-dial frontal, and anterior cingulate cortex. Past studies have
shown that the orbitofrontal cortex and anterior cingulate
re-gions are critical for attention and error detection (
Petrides, 2007
;
Tang et al., 2012
), and the medial frontal cortex is thought to play
a role in memory processes (
Burgess et al., 2011
). These regions,
particularly the medial frontal and anterior cingulate cortex, are
additionally considered to be central components of the default
mode network (
Shulman et al., 1997
;
Raichle et al., 2001
), the
modulation of which is theorized to impact normal cognitive
function with advancing age (
Lustig et al., 2003
;
Grady et al.,
2006
).
Other regions exhibited accelerated linear decreases in activity
over time in the CI compared with the CN group. These included
the lingual gyrus and the medial inferior parieto-occipital cortex.
The lingual gyrus, which lies along the ventral occipitotemporal
visual pathway, and the medial inferior parietal cortex are areas
also thought to be involved in memory and attention processes
(
Cabeza et al., 2012
;
Straube, 2012
). These results, in conjunction
with the longitudinal increases in frontal activity, suggest that
brain activity changes begin long before the onset of CI in regions
that are ultimately crucial for maintenance of cognitive function.
Baseline differences between the groups were also observed in
middle frontal and inferior temporal cortices implicated in
mem-ory processes (
Haxby et al., 2000
;
Axmacher et al., 2008
). Yet,
these areas were relatively small in size and did not show
signifi-cant differences between groups in activity change over time. The
lack of baseline differences in the areas that do show differential
changes over time may be the result of interindividual variability
in rCBF and the limited power available when examining a single
point in time.
Our findings of accelerated longitudinal changes in brain
ac-tivity in individuals who develop CI support findings from
cross-sectional resting-state studies in MCI. Although activity in the
default mode network is thought to generally decrease in MCI
and AD with advancing disease state (
Lustig et al., 2003
;
Greicius
and Menon, 2004
;
Petrella et al., 2007
;
Pihlajama¨ki et al., 2010
),
some studies have shown an increase in medial frontal regions in
MCI relative to cognitively normal individuals (
Wang et al., 2011
;
De Vogelaere et al., 2012
;
Jin et al., 2012
). It is particularly
inter-esting that the activity levels in the frontal cortex appear to be
positively related to the accumulation of
-amyloid in the brain
(
Sperling et al., 2009
) and that increased connectivity of frontal
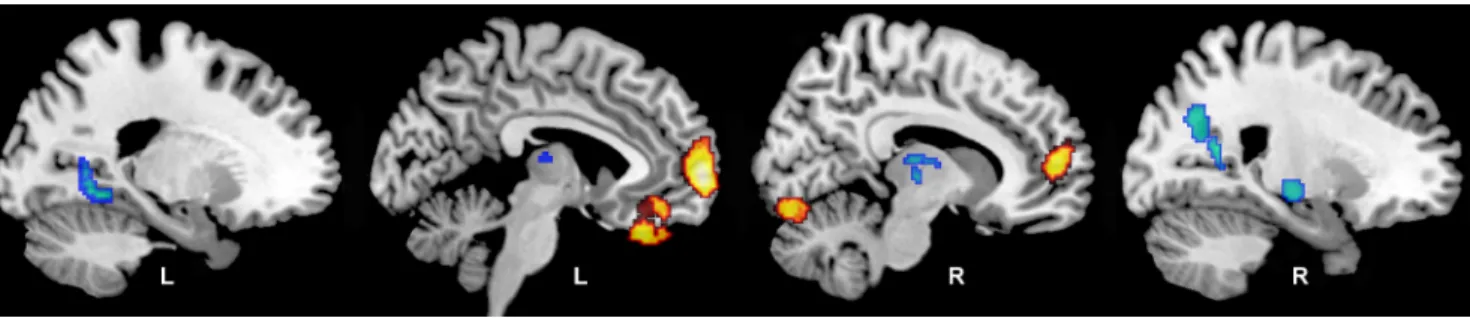
Figure 3. Longitudinal changes in rCBF. Regions showing differences in longitudinal rates of rCBF changes for the CI group relative to the CN group are shown on sagittal sections of the brain. Areas in yellow represent regions where CI show greater increases in rCBF over time relative to CN; areas in blue represent regions where CI exhibit greater decreases in rCBF over time. The group difference in insular decline (slice 4) did not remain significant after MRI tissue volume correction.Table 2. Local maxima of rCBF change over timea
Region Side x y z p Voxels
Greater rCBF increases
Orbitofrontal cortex (11) L ⫺4 32 ⫺28 ⬍0.001 413 Medial frontal gyrus (10) L ⫺6 64 0 ⬍0.001 789b Anterior cingulate cortex (32) R 8 54 8 ⬍0.001 789b
Cerebellum R 12 ⫺78 ⫺16 ⬍0.001 138 Greater rCBF decreases Insula R 66 10 2 0.002 65c,d Supramarginal gyrus (40) R 64 ⫺38 32 0.003 59d Parieto-occipital cortex (18) R 22 ⫺62 36 ⬍0.001 291 Lingual gyrus (18) L ⫺20 ⫺54 ⫺2 ⬍0.001 105 Thalamus R 6 ⫺10 8 0.003 59 Brainstem R 18 ⫺22 ⫺8 ⬍0.001 154
aRegions where CI show differences in longitudinal rCBF change compared with CN in the full sample of participants.
Stereotaxic coordinates are listed; Brodmann areas are indicated in parentheses.
bRegions contained within the same cluster.
cRegion that did not survive correction for tissue volume change over time. dRegions that were no longer significant in the age-matched analysis.
regions with other brain areas occurs in
asymptomatic individuals at high risk of
developing AD (
Fleisher et al., 2009
). A
number of studies have also shown
de-creased resting-state activity levels within
the posterior cingulate and parietal cortex
in MCI relative to normal agers (
Sorg et
al., 2007
;
De Vogelaere et al., 2012
;
Wang
et al., 2011
). Our results confirm the
find-ings seen in individuals with MCI and
suggest that resting-state activity levels
within these regions begin to change years
before the diagnosis of CI. Indeed,
ante-rior cingulate, medial frontal, and
supra-marginal regions showed significantly
different activity levels between the
im-paired and normal groups at the last
follow-up visit, which occurred
⬃4 years
before symptom onset in those who
sub-sequently developed impairment.
The next question naturally relates to
what these changes represent. Here, we
see regions of both accelerated decreases
and increases in rCBF activity levels over
time in association with CI. Declines in
rCBF likely represent regions of
in-creased functional vulnerability over
time, whereas increases in rCBF are more
challenging to explain. Historically,
in-creases in activity in the older brain have
been interpreted as representing
compen-satory processes (
Grady et al., 1999
;
Madden et al., 1999
). That is,
one region increases activity levels to compensate for failing
ac-tivity in other region(s), allowing for the maintenance of
cogni-tive function. Here, we see some evidence in support of this
theory. Despite our two groups having similar longitudinal
tra-jectories of cognitive performance during the studied interval,
declining performance on a test of visual memory recall, the
BVRT, was associated with declining activity in the CN group and
with increasing activity in the CI group.
Other explanations of increasing activity in AD and its
pro-dromal stage have also been proposed (
Palop and Mucke, 2010
;
Reiman and Jagust, 2012
). It is possible that increases in brain
activity represent an excitotoxic reaction to increasing
neuropa-thology (
Sojkova et al., 2008
;
Sperling et al., 2009
;
Bakker, 2012
),
which may ultimately result in further synaptic and network
dys-function (
Kapogiannis and Mattson, 2011
). It is also possible that
increases represent a failure to properly inhibit activity levels
(
Andrews-Zwilling et al., 2010
), again likely related to the
develop-ment of neuropathology.
It is well known that there is a characteristic progression of
pathology in the brain of AD patients and that hallmark features
of the disease involve the abnormal accumulation of amyloid and
tau proteins in the brain. It is thought that abnormal
accumula-tion of these proteins begins 10 –20 years before the onset of
cognitive dysfunction (
Hof et al., 1996
;
Perl, 2010
), although
Braak and Braak (1995
) have suggested that some changes may
begin as early as 50 years before the end stage of the disease.
With respect to amyloid deposition, autopsy studies have
shown that there is accumulation first in orbitofrontal, temporal
pole, and inferior temporal areas, with further accumulation in
frontal, occipital, and inferior parietal areas in the early stages of
disease progression (
Braak and Braak, 1991
;
Thal et al., 2002
). In
vivo neuroimaging tracers also show early accumulation of
fibril-lar amyloid in orbitofrontal and parietal regions of the brain
(
Wolk and Klunk, 2009
). The orbitofrontal, medial frontal,
infe-rior temporal, and infeinfe-rior parieto-occipital brain areas that
show accelerated change in CI in the present study are located
within the regional pattern of early amyloid deposition.
Overlap between regions of CI-associated accelerated blood
flow change is also seen in relation to the distribution of
abnor-mally phosphorylated tau protein in the form of neurofibrillary
tangles. Neurofibrillary tangles generally first develop in the
en-torhinal cortex and then progress to inferior temporal, inferior
frontal, and retrosplenial cortex (
Braak and Braak, 1995
,
1997
).
Accelerated CI-associated brain activity changes noted in
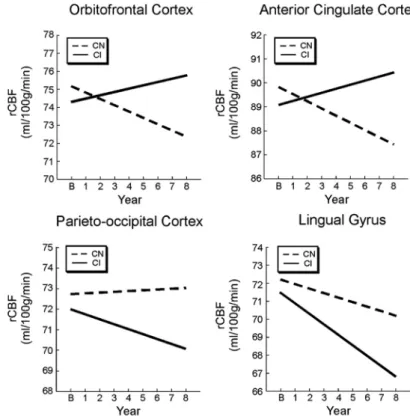
orbito-Figure 4. Regional trajectories of rCBF change. The CI group shows different trajectories of rCBF of change over time relative to the CN group. Estimated trajectories of longitudinal change are shown for regions of greater rCBF increase in the CI group (orbito-frontal and anterior cingulate regions) and greater rCBF decrease in the CI group (parieto-occipital and lingual regions). All changes were linear in nature.Table 3. Rates of rCBF change over timea
Baseline rCBF
Annual rate of change
CN CI CN CI Effective change
Greater rCBF increases
Orbitofrontal cortex (11) 75.17 (7.0) 74.33 (8.4) ⫺0.35 0.18 Increase in CI Medial frontal gyrus (10) 75.97 (4.5) 74.81 (5.2) ⫺0.36 0.19 Increase in CI Anterior cingulate cortex (32) 89.83 (5.3) 89.08 (5.7) ⫺0.30 0.17 Increase in CI Cerebellum 96.81 (7.1) 97.36 (7.9) ⫺0.43 0.14 Increase in CI Greater rCBF decreases
Insula 41.60 (8.5) 39.93 (8.5) ⫺0.22 ⫺0.82 Greater decrease in CI Supramarginal gyrus (40) 81.32 (4.5) 81.38 (5.3) 0.00 ⫺0.38 Greater decrease in CI Parieto-occipital cortex (18) 72.72 (6.1) 71.99 (6.0) 0.04 ⫺0.24 Greater decrease in CI Lingual gyrus (18) 72.21 (8.3) 71.54 (14.0) ⫺0.25 ⫺0.59 Greater decrease in CI Thalamus 78.62 (8.6) 76.78 (11.8) ⫺0.70 ⫺1.03 Greater decrease in CI Brainstem 84.15 (5.4) 84.59 (6.9) 0.42 0.09 Less increase in CI
aAnnual rates of rCBF change and the effective direction of change for regions showing significant differences in
longitudinal change between the CN and CI groups in Table 2. Baseline rCBF was not significantly different between the groups.
frontal, medial frontal, and inferior temporal cortex fall within
the areas vulnerable to early tau accumulation.
Together, the majority of regions showing accelerated rCBF
change in CI compared with CN involve areas of early
neuro-pathologic changes in AD, suggesting that there may be a
connec-tion between early pathologic change and early changes in brain
activity. Although the exact mechanism(s) responsible for the
activity changes remains to be determined, our results show that
there are significant changes in brain function that precede the
development of CI. In the face of accumulating neuropathology,
an argument could be made that some of these changes represent
compensatory activity that support the maintenance of cognitive
function and that impairment began after the early
compensa-tory mechanisms ultimately failed.
Our findings also point to a limitation of cross-sectional
stud-ies of cognitively “normal” individuals. These samples are
typi-cally comprised of both individuals who are in a preclinical stage
of disease as well as those who will maintain normal cognition.
This makes separation of the two groups difficult when
examin-ing a sexamin-ingle point in time. Longitudinal studies are more likely to
discern the clinical course of participants and are therefore
criti-cal in developing the tools needed to target individuals who will
benefit from disease intervention therapies before their
symp-toms become apparent and possibly irreversible.
References
Alzheimer’s Association (2012) Alzheimer’s disease facts and figures. Alz-heimers Dement 8:131–168.CrossRef Medline
Andrews-Zwilling Y, Bien-Ly N, Xu Q, Li G, Bernardo A, Yoon SY, Zwilling D, Yan TX, Chen L, Huang Y (2010) Apolipoprotein E4 causes age- and Tau-dependent impairment of GABAergic interneurons, leading to learning and memory deficits in mice. J Neurosci 30:13707–13717.
CrossRef Medline
Axmacher N, Schmitz DP, Wagner T, Elger CE, Fell J (2008) Interactions between medial temporal lobe, prefrontal cortex, and inferior temporal regions during visual working memory: a combined intracranial EEG and functional magnetic resonance imaging study. J Neurosci 28:7304 –7312.
CrossRef Medline
Bakker A, Krauss GL, Albert MS, Speck CL, Jones LR, Stark CE, Yassa MA, Bassett SS, Shelton AL, Gallagher M (2012) Reduction of hippocampal hyperactivity improves cognition in amnestic mild cognitive impairment. Neuron 74:467– 474.CrossRef Medline
Bateman RJ, Xiong C, Benzinger TL, Fagan AM, Goate A, Fox NC, Marcus DS, Cairns NJ, Xie X, Blazey TM, Holtzman DM, Santacruz A, Buckles V, Oliver A, Moulder K, Aisen PS, Ghetti B, Klunk WE, McDade E, Martins RN, et al. (2012) Clinical and biomarker changes in dominantly inher-ited Alzheimer’s disease. N Engl J Med 367:795– 804.CrossRef Medline
Braak H, Braak E (1991) Neuropathological stageing of Alzheimer-related changes. Acta Neuropathol 82:239 –259.CrossRef Medline
Braak H, Braak E (1995) Staging of Alzheimer’s disease-related neurofibril-lary changes. Neurobiol Aging 16:271–278; discussion 278 –284.Medline
Braak H, Braak E (1997) Pattern of cortical lesions in Alzheimer’s disease. In: Alzheimer’s disease: biology, diagnosis and therapeutics (Iqbal K, Winbald B, Nishimura T, Takeda M, Wisniewski H, eds), pp 227–237. Chicago: Wiley.
Brett M, Anton J, Valabregue R, Poline J (2002) Region of interest analysis using an SPM toolbox. Neuroimage 16:1140 –1141.
Burgess PW, Gonen-Yaacovi G, Volle E (2011) Functional neuroimaging studies of prospective memory: what have we learnt so far? Neuropsycho-logia 49:2246 –2257.CrossRef Medline
Cabeza R, Ciaramelli E, Moscovitch M (2012) Cognitive contributions of the ventral parietal cortex: an integrative theoretical account. Trends Cogn Sci 16:338 –352.CrossRef Medline
Callaway E (2012) Alzheimer’s drugs take a new tack. Nature 498:13–14.
Medline
Castellani RJ, Perry G (2012) Pathogenesis and disease-modifying therapy in Alzheimer’s disease: the flat line of progress. Arch Med Res 43:694 – 698.CrossRef Medline
Davatzikos C, Genc A, Xu D, Resnick SM (2001) Voxel-based
morphome-try using the RAVENS maps: methods and validation using simulated longitudinal atrophy. Neuroimage 14:1361–1369.CrossRef Medline
de Leon MJ, Mosconi L, Blennow K, DeSanti S, Zinkowski R, Mehta PD, Pratico D, Tsui W, Saint Louis LA, Sobanska L, Brys M, Li Y, Rich K, Rinne J, Rusinek H (2007) Imaging and CSF studies in the preclinical diagnosis of Alzheimer’s disease. Ann N Y Acad Sci 1097:114 –145.
CrossRef Medline
De Vogelaere F, Santens P, Achten E, Boon P, Vingerhoets G (2012) Altered default-mode network activation in mild cognitive impairment com-pared with healthy aging. Neuroradiology 54:1195–1206. CrossRef Medline
Driscoll I, Resnick SM, Troncoso JC, An Y, O’Brien R, Zonderman AB (2006) Impact of Alzheimer’s pathology on cognitive trajectories in nonde-mented elderly. Ann Neurol 60:688 – 695.CrossRef Medline
Fleisher AS, Sherzai A, Taylor C, Langbaum JB, Chen K, Buxton RB (2009) Resting-state BOLD networks versus task-associated functional MRI for distinguishing Alzheimer’s disease risk groups. Neuroimage 47:1678 – 1690.CrossRef Medline
Grady CL, McIntosh AR, Rajah MN, Beig S, Craik FI (1999) The effects of age on the neural correlates of episodic encoding. Cereb Cortex 9:805– 814.CrossRef Medline
Grady CL, Springer MV, Hongwanishkul D, McIntosh AR, Winocur G (2006) Age-related changes in brain activity across the adult lifespan. J Cogn Neurosci 18:227–241.CrossRef Medline
Greicius MD, Menon V (2004) Default-mode activity during a passive sen-sory task: uncoupled from deactivation but impacting activation. J Cogn Neurosci 16:1484 –1492.CrossRef Medline
Haxby JV, Petit L, Ungerleider LG, Courtney SM (2000) Distinguishing the functional roles of multiple regions in distributed neural systems for vi-sual working memory. Neuroimage 11:380 –391.CrossRef Medline
Hof PR, Giannakopoulos P, Bouras C (1996) The neuropathological changes associated with normal brain aging. Histol Histopathol 11:1075– 1088.Medline
Jin M, Pelak VS, Cordes D (2012) Aberrant default mode network in sub-jects with amnestic mild cognitive impairment using resting-state func-tional MRI. Magn Reson Imaging 30:48 – 61.CrossRef Medline
Jueptner M, Weiller C (1995) Does measurement of regional cerebral blood flow reflect synaptic activity? Implications for PET and fMRI. Neuroim-age 2:148 –156.CrossRef Medline
Kapogiannis D, Mattson MP (2011) Disrupted energy metabolism and neu-ronal circuit dysfunction in cognitive impairment and Alzheimer’s dis-ease. Lancet Neurol 10:187–198.CrossRef Medline
Lustig C, Snyder AZ, Bhakta M, O’Brien KC, McAvoy M, Raichle ME, Morris JC, Buckner RL (2003) Functional deactivations: change with age and dementia of the Alzheimer type. Proc Natl Acad Sci U S A 100:14504 – 14509.CrossRef Medline
Madden DJ, Gottlob LR, Allen PA (1999) Adult age differences in visual search accuracy: attentional guidance and target detectability. Psychol Aging 14:683– 694.CrossRef Medline
McKhann G, Drachman D, Folstein M, Katzman R, Price D, Stadlan EM (1984) Clinical diagnosis of Alzheimer’s disease: report of the NINCDS-ADRDA Work Group under the auspices of Department of Health and Human Services Task Force on Alzheimer’s Disease. Neurology 34:939 – 944.Medline
Palop JJ, Mucke L (2010) Amyloid-beta-induced neuronal dysfunction in Alzheimer’s disease: from synapses toward neural networks. Nat Neurosci 13:812– 818.CrossRef Medline
Perl DP (2010) Neuropathology of Alzheimer’s disease. Mt Sinai J Med 77: 32– 42.CrossRef Medline
Petrella JR, Prince SE, Wang L, Hellegers C, Doraiswamy PM (2007) Prog-nostic value of posteromedial cortex deactivation in mild cognitive im-pairment. PLoS One 2:e1104.CrossRef Medline
Petrides M (2007) The orbitofrontal cortex: novelty, deviation from ex-pectation, and memory. Ann N Y Acad Sci 1121:33–53. CrossRef Medline
Pihlajama¨ki M, Jauhiainen AM, Soininen H (2009) Structural and func-tional MRI in mild cognitive impairment. Curr Alzheimer Res 6:179 –185.
CrossRef Medline
Pihlajama¨ki M, O’Keefe K, Bertram L, Tanzi RE, Dickerson BC, Blacker D, Albert MS, Sperling RA (2010) Evidence of altered posteromedial corti-cal fMRI activity in subjects at risk for Alzheimer disease. Alzheimer Dis Assoc Disord 24:28 –36.CrossRef Medline
Raichle ME, MacLeod AM, Snyder AZ, Powers WJ, Gusnard DA, Shulman GL (2001) A default mode of brain function. Proc Natl Acad Sci U S A 98:676 – 682.CrossRef Medline
Reiman EM, Jagust WJ (2012) Brain imaging in the study of Alzheimer’s disease. Neuroimage 61:505–516.CrossRef Medline
Resnick SM, Goldszal AF, Davatzikos C, Golski S, Kraut MA, Metter EJ, Bryan RN, Zonderman AB (2000) One-year age changes in MRI brain volumes in older adults. Cereb Cortex 10:464 – 472.CrossRef Medline
Shen D, Davatzikos C (2002) HAMMER: hierarchical attribute matching mechanism for elastic registration. IEEE Trans Med Imaging 21:1421– 1439.CrossRef Medline
Shock NW, Greulich RC, Andres R, Arenberg D, Costa PT Jr, Lakatta E, Tobin JD (1984) Normal human aging: the Baltimore Longitudinal Study of Aging. Washington, DC: U.S. Government Printing Office.
Shulman GL, Fiez JA, Corbetta M, Buckner RL, Miezin FM, Raichle ME, Petersen SE (1997) Common blood flow changes across visual tasks: II. Decreases in cerebral cortex. J Cogn Neurosci 9:648 – 663.CrossRef Medline
Sojkova J, Beason-Held L, Zhou Y, An Y, Kraut MA, Ye W, Ferrucci L, Mathis CA, Klunk WE, Wong DF, Resnick SM (2008) Longitudinal cerebral blood flow and amyloid deposition: an emerging pattern? J Nucl Med 49:1465–1471.CrossRef Medline
Sorg C, Riedl V, Mu¨hlau M, Calhoun VD, Eichele T, La¨er L, Drzezga A, Fo¨rstl H, Kurz A, Zimmer C, Wohlschla¨ger AM (2007) Selective changes of
resting-state networks in individuals at risk for Alzheimer’s disease. Proc Natl Acad Sci U S A 104:18760 –18765.CrossRef Medline
Sperling RA, Laviolette PS, O’Keefe K, O’Brien J, Rentz DM, Pihlajama¨ki M, Marshall G, Hyman BT, Selkoe DJ, Hedden T, Buckner RL, Becker JA, Johnson KA (2009) Amyloid deposition is associated with impaired de-fault network function in older persons without dementia. Neuron 63: 178 –188.CrossRef Medline
Straube B (2012) An overview of the neuro-cognitive processes involved in the encoding, consolidation, and retrieval of true and false memories. Behav Brain Funct 8:35.CrossRef Medline
Tang YY, Rothbart MK, Posner MI (2012) Neural correlates of establishing, maintaining, and switching brain states. Trends Cogn Sci 16:330 –337.
CrossRef Medline
Thal DR, Ru¨b U, Orantes M, Braak H (2002) Phases of A beta-deposition in the human brain and its relevance for the development of AD. Neurology 58:1791–1800.CrossRef Medline
Wang Z, Yan C, Zhao C, Qi Z, Zhou W, Lu J, He Y, Li K (2011) Spatial patterns of intrinsic brain activity in mild cognitive impairment and Alz-heimer’s disease: a resting-state functional MRI study. Hum Brain Mapp 32:1720 –1740.CrossRef Medline
Wolk DA, Klunk W (2009) Update on amyloid imaging: from healthy aging to Alzheimer’s disease. Curr Neurol Neurosci Rep 9:345–352.CrossRef Medline