Publisher’s version / Version de l'éditeur:
Vous avez des questions? Nous pouvons vous aider. Pour communiquer directement avec un auteur, consultez la
première page de la revue dans laquelle son article a été publié afin de trouver ses coordonnées. Si vous n’arrivez
pas à les repérer, communiquez avec nous à [email protected].
Questions? Contact the NRC Publications Archive team at
[email protected]. If you wish to email the authors directly, please see the
first page of the publication for their contact information.
https://publications-cnrc.canada.ca/fra/droits
L’accès à ce site Web et l’utilisation de son contenu sont assujettis aux conditions présentées dans le site
LISEZ CES CONDITIONS ATTENTIVEMENT AVANT D’UTILISER CE SITE WEB.
Nature Communications, 11, 1, pp. 1-12, 2020-07-27
READ THESE TERMS AND CONDITIONS CAREFULLY BEFORE USING THIS WEBSITE.
https://nrc-publications.canada.ca/eng/copyright
NRC Publications Archive Record / Notice des Archives des publications du CNRC :
https://nrc-publications.canada.ca/eng/view/object/?id=25345382-f4e9-43c8-b444-60e49632bdf3
https://publications-cnrc.canada.ca/fra/voir/objet/?id=25345382-f4e9-43c8-b444-60e49632bdf3
Archives des publications du CNRC
This publication could be one of several versions: author’s original, accepted manuscript or the publisher’s version. /
La version de cette publication peut être l’une des suivantes : la version prépublication de l’auteur, la version
acceptée du manuscrit ou la version de l’éditeur.
For the publisher’s version, please access the DOI link below./ Pour consulter la version de l’éditeur, utilisez le lien
DOI ci-dessous.
https://doi.org/10.1038/s41467-020-17565-y
Access and use of this website and the material on it are subject to the Terms and Conditions set forth at
Preferential inhibition of adaptive immune system dynamics by
glucocorticoids in patients after acute surgical trauma
Ganio, Edward A.; Stanley, Natalie; Lindberg-Larsen, Viktoria; Einhaus,
Jakob; Tsai, Amy S.; Verdonk, Franck; Culos, Anthony; Ghaemi, Sajjad;
Rumer, Kristen K.; Stelzer, Ina A.; Gaudilliere, Dyani; Tsai, Eileen;
Fallahzadeh, Ramin; Choisy, Benjamin; Kehlet, Henrik; Aghaeepour, Nima;
Angst, Martin S.; Gaudilliere, Brice
Preferential inhibition of adaptive immune system
dynamics by glucocorticoids in patients after acute
surgical trauma
Edward A. Ganio
1,6
, Natalie Stanley
1,6
, Viktoria Lindberg-Larsen
2,6
, Jakob Einhaus
1
, Amy S. Tsai
1
,
Franck Verdonk
1
, Anthony Culos
1
, Sajjad Ghaemi
1,3
, Kristen K. Rumer
1
, Ina A. Stelzer
1
,
Dyani Gaudilliere
4
, Eileen Tsai
1
, Ramin Fallahzadeh
1
, Benjamin Choisy
1
, Henrik Kehlet
5
,
Nima Aghaeepour
1,6
, Martin S. Angst
1,6
& Brice Gaudilliere
1,6
✉
Glucocorticoids (GC) are a controversial yet commonly used intervention in the clinical
management of acute in
flammatory conditions, including sepsis or traumatic injury. In the
context of major trauma such as surgery, concerns have been raised regarding adverse
effects from GC, thereby necessitating a better understanding of how GCs modulate the
immune response. Here we report the results of a randomized controlled trial
(NCT02542592) in which we employ a high-dimensional mass cytometry approach to
characterize innate and adaptive cell signaling dynamics after a major surgery (primary
outcome) in patients treated with placebo or methylprednisolone (MP). A robust,
unsu-pervised bootstrap clustering of immune cell subsets coupled with random forest analysis
shows profound (AUC
= 0.92, p-value = 3.16E-8) MP-induced alterations of immune cell
signaling trajectories, particularly in the adaptive compartments. By contrast, key innate
signaling responses previously associated with pain and functional recovery after surgery,
including STAT3 and CREB phosphorylation, are not affected by MP. These results imply
cell-speci
fic and pathway-specific effects of GCs, and also prompt future studies to examine GCs’
effects on clinical outcomes likely dependent on functional adaptive immune responses.
1Department of Anesthesiology, Perioperative and Pain Medicine, School of Medicine, Stanford University, Stanford, CA, USA.2The Lundbeck Foundation
Center for Fast-track Hip and Knee replacement, Copenhagen, Denmark.3Digital Technologies Research Centre, National Research Council Canada, Toronto,
ON, Canada.4Division of Plastic and Reconstructive Surgery, Department of Surgery, School of Medicine, Stanford University, Stanford, CA, USA.5Section of
Surgical Pathophysiology 7621, Rigshospitalet, Blegdamsvej 9, DK-2100 Copenhagen, Denmark.6These authors contributed equally: Edward A. Ganio,
Natalie Stanley, Viktoria Lindberg-Larsen, Nima Aghaeepour, Martin S. Angst, Brice Gaudilliere. ✉email:[email protected]
123456789
T
he use of glucocorticoids (GCs) for the management of
acute inflammatory conditions including sepsis and
trau-matic injury remains controversial
1,2. Despite equivocal
results regarding their beneficial or potentially harmful effects,
GCs are frequently administered to patients undergoing major
surgery
3–7. GCs effectively decrease the incidence of
post-operative nausea and vomiting
8—a process predominantly driven
by direct central effects
9—and some studies suggest additional
benefits including attenuation of postoperative pain and
fatigue
10,11. However, such
findings are inconsistent. Concerns
regarding the use of GCs in acutely injured patients include
increased infection risk and impaired wound and bone healing.
As a result, administration of GCs in bone fusion surgery is
frequently discouraged out of concern for impaired functional
outcomes
12. In addition, a scarcely explored but highly relevant
question in cancer surgery is whether GCs promote
micro-seeding and, consequently, metastatic disease
13. Considering the
widespread administration of GCs in surgical patients, an
in-depth analysis of the effects of GCs on the immune response to
surgical injury is critical to establish a biological basis that can
guide their safe and effective clinical use.
While the immune modulating properties of GCs have been
examined in various clinical contexts, there is sparse information
regarding their effects in patients who suffer from acute traumatic
injury
14. Studies examining the effects of GCs on the production
of circulating inflammatory mediators
15or on the distribution
patterns of select immune cell subsets
16after surgery have
pro-vided important insights. Specifically, prior studies have shown
that GCs differentially and dose-dependently attenuate the
pro-duction of both pro-inflammatory (e.g., IL-6)
17,18and
anti-inflammatory circulating cytokines (e.g., IL-10)
17–19. However,
the binding of GCs to the glucocorticoid receptor (GR) results in
a pleiotropic modulation of multiple inflammatory signaling
pathways in both innate and adaptive immune cells
14. As such,
single-cell techniques capturing functional responses in all major
immunological compartments will provide much needed insight
as to how GCs modulate the complex immune response to acute
injury
20.
Our group has recently utilized mass cytometry—a
high-dimensional, single-cell
flow cytometry technology
21,22—to
comprehensively interrogate the peripheral immune system in
patients undergoing total hip arthroplasty (THA) surgery
23,24.
THA is a compelling model to study the effect of GCs on the
human immune response to major trauma as it is associated with
significant tissue injury, which initiates a stereotypical and
coordinated immune response: within hours of injury,
neu-trophils, monocytes (MCs), and natural killer (NK) cells,
acti-vated by alarmins and inflammatory cytokines, are recruited to
the site of injury, while compensatory immunosuppressive events,
including decreased T cell frequencies and effector functions,
evolve in parallel
25,26. As innate and adaptive immune cells
respond to multiple environmental cues, they integrate complex
extracellular signals into coordinated signaling responses that
enable wound healing and recovery
23,24,27–34. Differences in
response patterns can impact clinical recovery trajectories
35. For
example, our group has recently shown that accentuated signaling
responses in innate immune cells, including elements of the JAK/
STAT and MAPK/CREB signaling pathways in classical
mono-cytes (cMCs), strongly correlated with delayed resolution of pain
and prolonged functional impairment of the operated joint
23,24.
Here, we apply a high-dimensional mass cytometry assay to
characterize the immune-modulating effects of a single dose of
125 mg methylprednisolone (MP) in a randomized control trial of
patients undergoing THA (NCT02542592). Our primary aim is to
provide an in-depth profile of peripheral immune cell distribution
and intracellular signaling responses, thereby building a
high-resolution cell atlas of immune system dynamics after surgery in
patients treated with placebo or GCs (primary outcome). Our
secondary aim is to examine whether single-dose administration
of GCs would improve patient-centered recovery outcomes,
including pain and function (secondary outcomes), which were
previously predicted by specific immune response patterns after
surgical injury
23,24. Our data indicate that GCs profoundly alter
adaptive immune cell signaling responses after surgery while
sparing key innate cell signaling responses previously associated
with surgical recovery from pain and functional impairment.
Observed cell-specific immune modulation by GCs is consistent
with the fact that GC did not alter measured parameters of
sur-gical recovery. The results provide the basis for future studies
examining the effect of perioperative GC administration on
sur-gical outcomes that may be particularly affected by adaptive
immune cell alterations.
Results
Patient and clinical characteristics. Sixty-three patients
under-going primary THA were randomized to receive a single
pre-operative 125 mg dose of intravenous MP (MP group) or isotonic
saline (control group) on the day of surgery. Patient
character-istics have been described in prior analyses focused on the effect
of GCs on cardiovascular regulation
36(NCT02445898) and
glu-cose homeostasis
37(NCT02332603), and are summarized in
Table
1. Samples suitable for analysis with mass cytometry were
available for 58 patients, 30 randomized to the control group and
28 randomized to the MP group (Supplementary Fig. 1).
Assessment of immunological trajectories after surgery. Serial
whole blood samples collected at baseline (pre-surgery) and at 1,
6, 24, 48 hours (h), and 2 weeks (wk) after surgery were analyzed
using a 47-parameter mass cytometry immuno-assay (Fig.
1).
Twenty-six cell phenotype markers were simultaneously assessed
to characterize major innate and adaptive immune cell subsets
(Supplementary Fig. 2). In addition, the activity of 11 intracellular
proteins that are activated after surgery, including elements of the
MAPK, CREB, NF-κB and JAK/STAT signaling pathways were
quantified on a per-cell basis. Intracellular markers were chosen
based on our previous reports showing that variation in the
activity pattern of these signaling responses correlated with
sen-tinel clinical recovery parameters, including the resolution of pain
and the function of the operated hip
23,24.
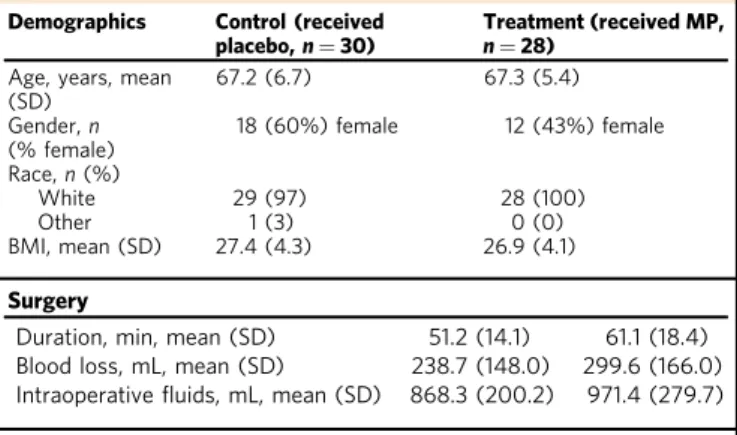
Table 1 Patient and procedural characteristics.
Demographics Control (received placebo,n = 30)
Treatment (received MP, n = 28)
Age, years, mean (SD) 67.2 (6.7) 67.3 (5.4) Gender,n (% female) 18 (60%) female 12 (43%) female Race,n (%) White 29 (97) 28 (100) Other 1 (3) 0 (0) BMI, mean (SD) 27.4 (4.3) 26.9 (4.1) Surgery
Duration, min, mean (SD) 51.2 (14.1) 61.1 (18.4) Blood loss, mL, mean (SD) 238.7 (148.0) 299.6 (166.0) Intraoperativefluids, mL, mean (SD) 868.3 (200.2) 971.4 (279.7) Anesthesia
Propofol sedation dose, mg, mean (SD) 165.5 (137.3) 178.5 (129.7) Bupivacaine dose, mg mean (SD) 14.8 (1.2) 15.0 (1.01)
Twenty-one innate and adaptive immune cell subsets were
manually gated using an established strategy
38. The resulting
immunological dataset was divided into two sets of immune
features, quantifying the distribution and intracellular signaling
activity for 9 innate (first set) and 12 adaptive (second set)
immune cell subsets. A non-linear dimensionality reduction
algorithm (Isomap) was employed to dynamically plot
surgery-evoked immune trajectories along the innate and adaptive axes
over the two-week postoperative course (Supplementary Fig. 3,
Supplementary Movie 1). Immunological trajectories evolved
along the innate and adaptive axes immediately after surgery.
This suggests that elements of both the innate and adaptive
compartments are mobilized early and jointly after traumatic
injury. Our results are consistent with recent transcriptomic and
flow cytometry analyses
23,34and challenge the traditional view of
sequential engagement of innate and adaptive compartments after
traumatic injury.
MP modulates immune responses for at least 48 h after surgery.
Separate inspection of the immunological trajectories for patients
randomized to MP or placebo treatment (Supplementary Fig. 3,
Supplementary Movie 1) revealed pronounced differences between
the two groups for at least 48 h after surgery. However, trajectories
diverged more along the adaptive (Y) than the innate (X) axis,
indicating that MP affected the adaptive immune compartment
more prominently than the innate compartment.
To complement the Isomap analysis with a quantitative and
cell-specific evaluation, an unsupervised clustering algorithm was
applied to the mass cytometry dataset (excluding neutrophils
which were analyzed separately). This algorithm was developed to
compute statistics quantifying differences between patient groups,
while enabling the visualization of group-level statistics on a
per-cell cluster basis for a systems-level mapping of clinically relevant
and cell subset specific differences between patient groups (see
“Methods”). Cells were clustered into coherent subpopulations
based on the expression of all cell phenotype markers using a
robust bootstrapped meta-clustering algorithm. All clusters were
projected onto a two-dimensional cell atlas for visual
interpreta-tion using principal component analysis (PCA) (Fig.
2a). Major
innate and adaptive cell populations were identified and
contoured based on the expression of canonical surface markers.
Differences in cell frequency and intracellular signaling responses
between the control and MP treatment groups were quantified in
each cell cluster at each time point and visualized in the
two-dimensional PCA plot (Fig.
2b).
A random forest (RF) algorithm was applied to the dataset
comprised of all cell cluster features (including frequency and
signaling features) to estimate the magnitude of differences for
features separating the placebo group from the MP group at each
time point (Fig.
2c). Using a leave-group-out cross validation
procedure (see methods) the RF model predicted the probability
that each sample belonged to the MP group. The control and MP
groups differed significantly at 1 h (AUC = 0.91, p = 1.03E−7),
6 h (AUC
= 0.92, p = 3.16E−8), 24 h (AUC = 0.85, p = 3.81E
−6), and 48 h (AUC = 0.76, p = 2.3E−3) after surgery, but not at
baseline (AUC
= 0.52, p = 0.76), or at 2 wk (AUC = 0.48, p =
0.84) after surgery. These results indicate that a single dose of MP
result in a wide-spread and cell-specific modulation of the
immune response to surgery for at least 48 h after surgery. This is
consistent with the time course of non-specific alterations of
plasma inflammatory markers including C-reactive protein as
previously reported for this cohort
39.
Patient recruitment Control n = 30 Methylprednisolone n = 28 Baseline 1 h 6 h 24 h 48 h 2 week Sample collection Surgery Sample processing Antibody staining Mass cytometry Lysis Barcoding Differential analysis of immune system dynamics
1 h 6 h 24 h 48 h 2 week Overview
Adaptive
Control MP
Study workflow
Immune trajectories after surgery
Innate
a
b
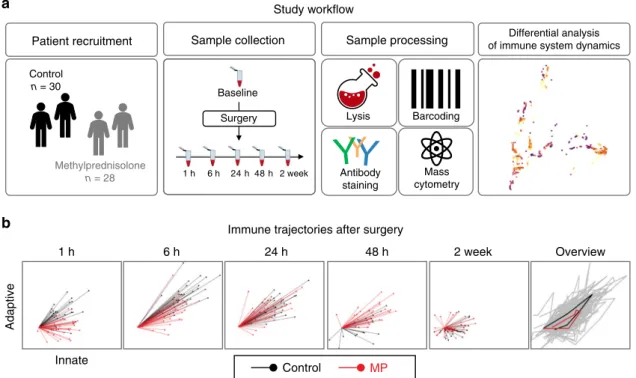
Fig. 1 Study workflow. a In a double-blind study, patients were randomized to receive a single preoperative dose of 125 mg methylprednisolone (MP, n = 28 patients) or saline placebo (n = 30 patients). Peripheral blood and clinical outcomes data were collected prior to surgery (baseline) and at the indicated time points after surgery. After erythrocyte lysis, peripheral immune cells were barcoded, stained with cell-phenotyping and intracellular cell-signaling antibodies, and analyzed by mass cytometry. Unsupervised bootstrapped clustering of immune cell subsets followed by random forest analysis was performed to identify differential immune cell dynamics in MP vs. control groups.b A non-linear dimensional reduction algorithm (Isomap) showing individual patients’ immunological trajectories after surgery along the innate (X) and adaptive (Y) axes (MP in red, control in black). Snapshots are shown for the 1 h, 6 h, 24 h, 48 h and 2 wk time points (animated trajectories can be found in Supplementary Movie 1). Right panel. Overview of median trajectories for the MP and control groups are shown in red and black.
The RF analysis, anchored in a statistically stringent
cross-validation method, indicated that the effect of MP was most
pronounced for the 1, 6, and 24 h time points (Fig.
2c). These
perioperative time points were examined in more detail to
determine the cell- and signaling-specific effects of MP
(Supplementary Fig. 3). Cell frequencies and signaling responses
were also quantified in manually gated immune cell subsets
(Supplementary Fig. 4) to corroborate observations contained in
the immune atlas using a univariate statistical approach
(Wilcoxon Rank Sum Test).
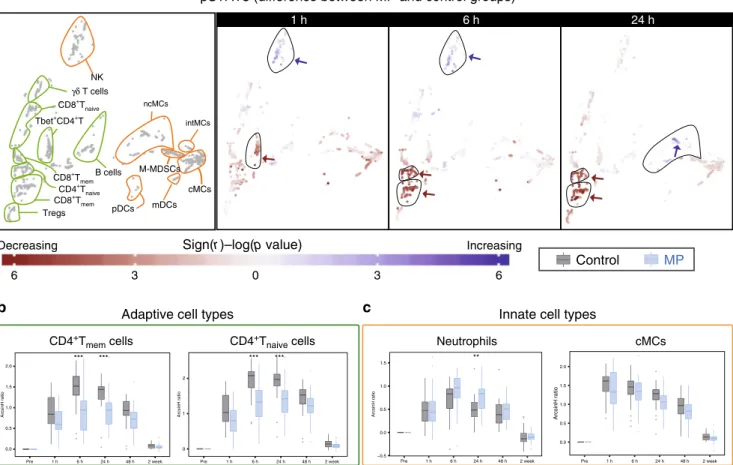
MP reorganizes the phenotypic immune landscape after
sur-gery. We examined the effect of MP on the frequency of immune
cell subsets at 1, 6, and 24 h after surgery (Fig.
3a). MP altered the
frequencies of several immune cell subsets, most prominently at 1
and 6 h after surgery. In the adaptive compartment, cell
fre-quencies in CD4
+naiveand CD4
+memT cell subsets (including
Tbet
+CD4
+T cell subsets) decreased at 1 and 6 h after surgery in
the MP group compared to the control group (Fig.
3a, b). Little or
no difference was detected for the frequencies of B cell or CD8
+T
cell subsets. In the innate compartment, cMCs, ncMCs, and
M-MDSC frequencies decreased, while the frequency of a subset of
CD56
loCD16
+NK cells and neutrophils increased at 1 and 6 h
after surgery (Fig.
3a, c). The frequency of mDCs decreased at 1
and 6 h, but increased at 24 h after surgery.
MP can affect immune cell frequencies through several
mechanisms including alteration of intracellular signaling
responses implicated in the mobilization, adhesion, proliferation
and survival of these cells in the peripheral immune
compart-ment
6. In addition, insight into the effects of MP on cell
type-specific signaling responses to surgery may be more instructive
than considering immune cell frequencies in isolation, as prior
studies suggest functional attributes are powerful correlates of
surgical outcomes
23,29. We therefore evaluated the effect of MP
on intracellular signaling dynamics.
MP reorganizes the functional immune landscape after surgery.
The median intracellular signaling activity was quantified for each
1 h
6 h
24 h
48 h
2 week
–log (p value)
0 3 6
Unsupervised clustering of immune cell subsets Random forest analysis
Cell-specific differences between MP and control groups
B-cells Tregs γδT-cells Non-classical monocytes Myeloid dendritic cells Plasmacytoid dendritic cells Intermediate monocytes Classical monocytes NKTcells CD8+ Tmemcells CD56+CD16–NK cells CD56loCD16+NK cells CD8+ T naïvecells CD4+ Tnaïvecells CD4+ T memcells Tbet+CD4+Tcells M-MDSCs Probability
Time after surgery
Control MP Pre 1 h 6 h 24 h 48 h 2 week 0.0 0.2 0.4 0.6 0.8 1.0
c
a
b
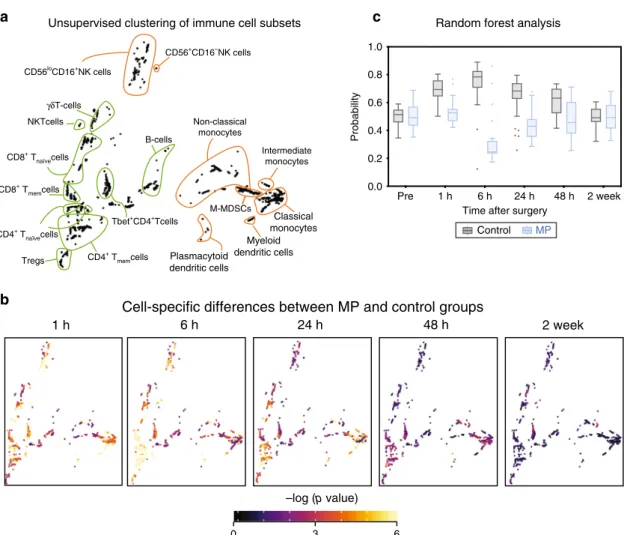
Fig. 2 A high-resolution atlas detailing peripheral immune cell alterations by MP after surgery. a Immune cells were clustered based on the expression of all phenotypic markers using an unsupervised bootstrapped clustering algorithm. The clusters were projected into two dimensions and major immune cell compartments were identified based on phenotypic marker expression (contoured in orange/green for innate/adaptive immune compartments, respectively).b Univariatep-values (two-sided Wilcoxon Rank Sum Test) were computed for each cluster at each time point to quantify the difference in functional marker expression or cell frequency between samples in the control (n = 30 patients) and MP (n = 28 patients) groups. At each time point, clusters were colored by the best univariate p-value observed for cell frequency and functional marker expression.c A Random Forest model was trained to classify patients in the control or MP group at each timepoint based on cluster-derived cell frequency and intracellular signaling responses. The boxplot depicts the probability predicted by the Random Forest model that samples from patients in the control (gray) or MP (blue) group were allocated to the MP group. The model revealed that samples from placebo- or MP-treated patients were distinguishable at 1 h (AUC= 0.91, p = 1.03E−7), 6 h (AUC = 0.92, p = 3.16E−8), 24 h (AUC = 0.85, p = 3.81E−6), and 48 h (AUC = 0.76, p = 3.2E−3) after surgery (two-sided Wilcoxon rank-sum test, p-values calculated for each unique model). All boxplots show median values, interquartile range, whiskers of 1.5 times interquartile range.
cell cluster and signaling protein at each time point. The values
derived in pre-surgical samples were subtracted from the values
derived in post-surgical samples to infer the change of the net
signaling responses to surgery. Inspection of the 2-dimensional
cell atlas suggested that MP altered elements of the JAK/STAT and
NF-κB pathways (Supplementary Fig. 3). With respect to the JAK/
STAT pathway, the pSTAT3 and pSTAT5 (and to a lesser extent
pSTAT1) responses were altered most prominently (Fig.
4,
Sup-plementary Figs. 3, 5). In contrast, only small or no differences
were observed for elements of the P38 and ERK/MAPK pathways
including pP38, pERK1/2, pMAPKAPK2, prpS6, and pCREB
responses (Supplementary Fig. 4).
The effects of MP on intracellular immune cell dynamics were
signaling- and cell type-specific. With respect to the JAK/STAT
pathway, MP resulted in a sustained attenuation of the
STAT3 signaling response in adaptive immune cells, including
CD4
+T cell subsets (Tbet
+CD4
+T cells at 1 h and CD4
+T
memand CD4
+T
naiveat 6 and 24 h after surgery) (Fig.
4a, b). Similarly,
MP resulted in a prominent and early attenuation of the
STAT5 signaling response in adaptive immune cells including
CD4
+T cell subsets (CD4
+T
mem, CD4
+T
naive, Tbet
+CD4
+T,
and T
regs) and CD8
+T cell subsets (CD8
+T
naiveand CD8
+T
mem)
at 1 and 6 h after surgery (Supplementary Fig. 5a, b). However,
MP had little or no effect on the STAT3 and STAT5 signaling
responses in innate immune cells, including neutrophils and MC
subsets (Fig.
4a, c, Supplementary Fig. 5a, c).
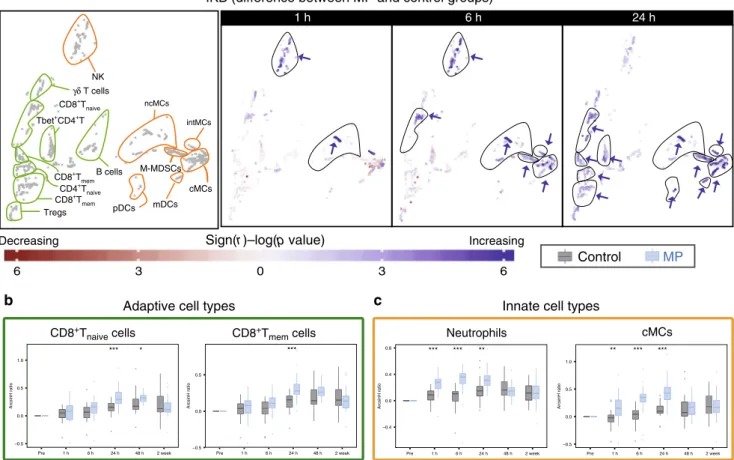
In contrast, MP treatment resulted in elevated total IκBα (a
canonical inhibitor of NF-κB) in both the innate and adaptive
immune cell compartment. Differences were most pronounced
24 h after surgery for adaptive immune cell subsets (CD4
+T
mem,
CD4
+T
naive, Th1, T
regs, CD8
+T
naiveand CD8
+T
mem), and some
innate immune cell subsets (mDCs, cMCs, ncMCs, intMCs, and
M-MDSCs). Differences for other innate immune cell subsets
(neutrophils and NK cells) were already prominent 1 and 6 h after
surgery (Fig.
5).
In summary, MP administration attenuate multiple
intracel-lular signaling programs that are activated in response to surgery,
including elements of the JAK/STAT and NF-κB signaling
pathways. However, other important signaling pathways remain
unaffected by MP. These included elements of the MAPK
1 h 6 h 24 h 6 3 0 3 6 Neutrophils cMCs
Control
MP
** 0 10 20 30 Pre 2 week Percentage 1 h 6 h 24 h 48 h *** *** 0 10 20 30 40 Percentage Pre 1 h 6 h 24 h 48 h 2 week *** * 20 40 60 Pre 2 week Percentage 1 h 6 h 24 h 48 h *** *** 40 60 80 Pre 2 week Percentage 1 h 6 h 24 h 48 h Decreasing IncreasingInnate cell types
Adaptive cell types
Frequency (difference between MP and control groups)
Sign(r )–log(p value)
CD4+T
mem cells CD4+Tnaive cells NK cMCs B cells mDCs Tregs CD8+T naive γδ T cells ncMCs intMCs pDCs M-MDSCs Tbet+CD4+T
a
b
c
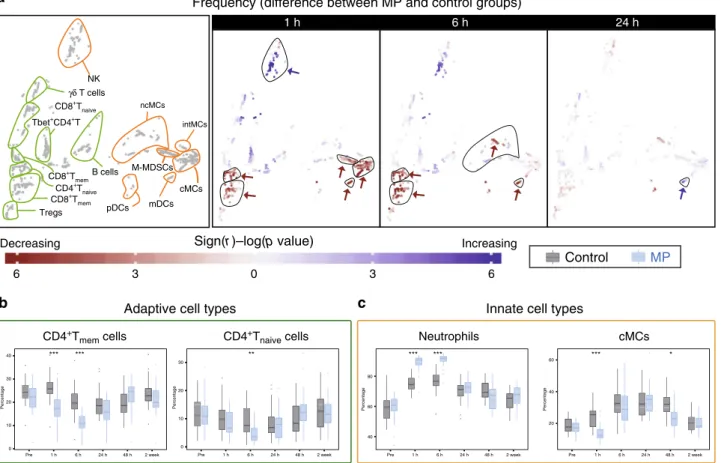
CD8+T mem CD8+T mem CD4+T naive *Fig. 3 Alteration of innate and adaptive immune cell frequencies by MP. a Immune cell atlas depicting differences in cell frequency between the MP and control groups at 1, 6 and 24 h after surgery (expressed as % of CD45+mononuclear cells, with the exception of neutrophils, which are expressed as % of total live cells). Cell clusters are color-coded according to the directional differences between the control (n = 30 patients) and MP (n = 28 patients) group. Directional differences were computed using a two-sided Wilcoxon rank-sum test (sign(r) -log(p-value), blue/red indicating an increased/ decreased frequency in the MP group; arrows point at cell clusters that differ most significantly between the patient groups). In cell clusters of the adaptive immune compartment (contoured in green), MP treatment resulted in decreased frequencies of CD4+Tmemat 1 and 6 h and CD4+Tnaïvecells at 6 h, but no
significant changes in CD8+T or B cell frequencies. In cell clusters of the innate immune compartment (contoured in orange), MP treatment resulted in decreased frequencies of cMCs and M-MDSCs at 1 h, and ncMCs and mDCs at 1 and 6 h. In contrast, MP resulted in increased frequencies of CD56loCD16 +NK cells at 1 h and mDCs at 24 h.b, c Box-plots depicting the frequency of manually gated immune cell subsets corroborating observations contained in
the immune cell atlas. Immune cell subsets for which MP’s effect on adaptive (b) and innate (c) immune cell frequencies were most pronounced (CD4+ Tmem, CD4+Tnaive, cMCs) are shown. Neutrophil frequencies (not included in the immune cell atlas) are also shown. Box plots for all manually gated
immune cells are available in Supplementary Fig. 4. All boxplots show median values, interquartile range, whiskers of 1.5 times interquartile range. (Two-sided Wilcoxon rank-sum test, *p < 0.01, **p < 0.001, ***p < 0.0001). Exact p-values are available in Supplementary Table 2.
pathways such as pP38, pERK1/2, prpS6, and pCREB in all
immune cell subsets as well as the STAT3 and STAT5 signaling
pathways in innate immune cells, including neutrophils and MC
subsets. Notably, signaling responses previously shown to
strongly correlate with clinical recovery from pain and functional
impairment after THA surgery
23,24, including STAT3 and CREB
signaling responses in MCs, are unaffected by MP treatment.
These
findings raise the question as to whether MP
administra-tion affected these clinically important recovery parameters.
MP does not alter pain, fatigue or functional impairment. The
course of postoperative pain, functional recovery of the operated
joint, fatigue, and resulting impairment of daily functioning were
captured over 4 weeks after surgery as previously described
23.
Instruments for assessing these clinical recovery outcomes
included an adapted version of the Western Ontario and
McMaster Universities Arthritis Index (WOMAC) and the
Sur-gical Recovery Scale (SRS). No differences were detected between
the MP and control groups (Fig.
6). These results are congruent
with previous reports
23,24and suggest signaling responses spared
by MP treatment (such as STAT3 and CREB signaling in MCs)
are more relevant determinants of the clinical recovery
parameters examined in this study than signaling responses that
are affected by MP.
Discussion
This study provides an in-depth and functional profile of the
effect of GCs on immune system dynamics after a major surgical
trauma (THA). Analysis of patients’ immune trajectories after
surgery reveals that a single preoperative dose of 125 mg MP
produces profound and cell-specific alterations of the innate and
adaptive immune response for at least 48 h after surgery. Notably,
MP treatment accentuates IκB signaling responses in all major
immune cell subsets of the innate and adaptive compartments,
while selectively inhibiting JAK/STAT signaling responses in the
adaptive compartment only.
Interestingly, the modulation of the surgical immune response
by MP does not affect assessed clinical recovery trajectories
including pain, fatigue, and functional impairment of the
oper-ated hip. These results are in line with previous reports indicating
that single-dose administration of GC in the perioperative period
does not affect pain and functional trajectories beyond
post-operative day 2, although some reports suggest short-term
ben-eficial effects during the first 24–48 h
1,40–43. The results are also
1 h 6 h 24 h
Sign(r )–log(p value)
Control
MP
*** *** 0.0 0.5 1.0 1.5 2.0 Pre 2 week ArcsinH ratio 1 h 6 h 24 h 48 h 0.0 0.5 1.0 1.5 2.0 Pre 2 week ArcsinH ratio 1 h 6 h 24 h 48 h *** *** 0 1 2 Pre 1 h 6 h 24 h 48 h 2 week ArcsinH ratio ** −0.5 0.0 0.5 1.0 1.5 Pre 2 week ArcsinH ratio 1 h 6 h 24 h 48 h Neutrophils cMCs Decreasing IncreasingInnate cell types
Adaptive cell types
pSTAT3 (difference between MP and control groups)
6 3 0 3 6
a
b
c
NK cMCs B cells mDCs Tregs CD8+T naive γδ T cells ncMCs intMCs pDCs M-MDSCs Tbet+CD4+T CD8+Tmem CD8+T mem CD4+T naive CD4+Tmem cells CD4+Tnaive cells
Fig. 4 Alteration of intracellular pSTAT3 responses by MP. a Immune cell atlas depicting differences of the phospho-(p)STAT3 response (arcsinh ratio) between the control (n = 30 patients) and MP (n = 28 patients) group at 1, 6, and 24 h after surgery relative to the preoperative time point. Blue/red cluster colors indicate increased/decreased signaling in the MP group, respectively (two-sided Wilcoxon rank-sum test). Arrows point at cell clusters that differ most significantly between the patient groups. In cell clusters of the adaptive compartment (contoured in green), MP treatment resulted in a sustained attenuation of pSTAT3 responses in CD4+T cells (first in Tbet+CD4+T cells at 1 h, then in CD4+Tnaiveand CD4+Tmemcells at 6 and 24 h. In
contrast, in clusters of the innate compartment (contoured in orange) MP treatment resulted in no significant changes in the pSTAT3 signal in monocyte subsets (including cMCs, intMCs, and M-MDSCs) and in only a modest increase in the pSTAT3 signal in CD56loCD16+NK cells at 1 and 6 h and ncMCs at
24 h.b, c Box plots depict the pSTAT3 signal in manually gated immune cell subsets corroborating observations contained in the immune atlas. b MP’s attenuation of the pSTAT3 signal was most pronounced in CD4+T cell subsets.c MP does not attenuate the pSTAT3 signal in neutrophils (signal is increased at 24 h) or cMCs. All boxplots show median values, interquartile range, whiskers of 1.5 times interquartile range (two-sided Wilcoxon rank-sum test, *p < 0.01, **p < 0.001, ***p < 0.0001). Exact p-values are available in Supplementary Table 2.
*** −0.5 0.0 0.5 ArcsinH ratio Pre 1 h 6 h 24 h 48 h 2 week *** *** ** −0.4 0.0 0.4 0.8 ArcsinH ratio Pre 1 h 6 h 24 h 48 h 2 week ** *** *** −0.5 0.0 0.5 1.0 ArcsinH ratio Pre 1 h 6 h 24 h 48 h 2 week 1 h 6 h 24 h Increasing
Control
MP
Neutrophils cMCs *** * −0.5 0.0 0.5 1.0 Pre 1 h 6 h 24 h 48 h 2 week ArcsinH ratio DecreasingInnate cell types
Adaptive cell types
IKB (difference between MP and control groups)
6 3 0 3 6
Sign(r )–log(p value)
a
b
c
NK cMCs B cells mDCs Tregs CD8+T naive γδ T cells ncMCs intMCs pDCs M-MDSCs Tbet+CD4+T CD8+Tmem CD8+Tmem CD4+T naiveCD8+Tnaive cells CD8+Tmem cells
Fig. 5 Alteration of total IκBα by MP. a Immune cell atlas depicting differences in total IκBα (arcsinh ratio) between the control (n = 30 patients) and MP (n = 28 patients) group at 1, 6, and 24 h after surgery. Blue/red cluster colors indicate increased/decreased signaling in the MP group, respectively (two-sided Wilcoxon rank-sum test). MP treatment resulted in increased total IκBα in both the adaptive (CD4+Tmem, CD4+Tnaive, CD8+Tnaiveand CD8+Tmem,
contoured in green) and the innate compartment (CD56loCD16+NK cells, mDCs, cMCs, ncMCs, M-MDSCs and DCs, contoured in orange, which was
most prominent at 6 and 24 h after surgery.b, c Box-plots depict total IκBα in manually gated immune cell subsets corroborating observations contained in the immune atlas. Select immune cell subsets for which MP’s effect on total IκBα was most pronounced (CD8+Tnaiveand CD8+Tmem, cMCs, and
neutrophils) are shown. All boxplots show median values, interquartile range, and whiskers of 1.5 times interquartile range. (Two-sided Wilcoxon rank-sum test, *p < 0.01, **p < 0.001, ***p < 0.0001). Exact p-values are available in Supplementary Table 2.
WOMAC pain scale (0–40)
Days after surgery
Pain
Surgery recovery scale (0–100)
Postoperative fatigue Impairment of hip function
MP (n = 28) Control (n = 30)
WOMAC function scale (0–60)
20 40 60 80 100 0 20 40 60
c
b
a
Pre 1 2 7 14 28Days after surgery
Pre 1 2 7 14 28
Days after surgery 0 10 20 30 40 Pre 1 2 7 14 28
Fig. 6 Clinical recovery outcome measures between control and MP treatment. All boxplots show median values, interquartile range, whiskers of 1.5 times interquartile range of clinical recovery parameters (a) pain, (b) fatigue and daily functioning, and (c) functional impairment of the operated hip over the course of 28 days after surgery between control (n = 30 patients) and MP (n = 28 patients) groups (two-sided Wilcoxon rank sum test). Pain and functional impairment of the hip were assessed with an adapted version of the Western Ontario and McMaster Universities Arthritis Index (pain 0 to 40= none to worst; function 0 to 60= no to most severe impairment). Postoperative fatigue and daily functioning were assessed with the Surgical Recovery Scale (17 to 100= worst to none).
consistent with the
finding that signaling responses previously
reported to strongly correlate with the resolution of pain and
functional recovery (e.g. STAT3 and CREB in MCs) were not
affected by MP
23. In contrast, MP markedly inhibits STAT3 and
STAT5 responses in CD4
+and CD8
+T cell subsets indicating
that the perioperative use of GCs may alter other surgical
recovery processes that specifically depend on JAK/STAT
sig-naling in T cell subsets.
STAT3 and STAT5 are transcription factors that control
multiple aspects of CD4
+T cell differentiation (including Th1,
Th17, and T
regdifferentiation) and CD8
+T cell effector function
implicated
in
adaptive
immune
responses
to
invading
pathogens
44,45and tumor surveillance
46,47. After surgery, these
host defense mechanisms must be balanced with effective wound
healing mechanisms that require immunosuppressive cell activity
exerted by regulatory T cells and myeloid-derived suppressor
cells
48,49. For example, Krall et al.
50demonstrated in a recent
rodent study, elegantly separating immune mechanisms activated
by surgical trauma from mechanisms relevant for cancer
sur-veillance, that immunosuppressive myeloid cells involved in
wound repair also facilitated tumor growth, which is opposed by
tumor-specific T cells
50. Our
finding that MP preferentially
inhibits JAK/STAT signaling in T cells but not in myeloid cells
after surgery raises the possibility that the perioperative use of
GCs may negatively affect the balance between immune
mechanisms required for wound repair and tumor surveillance,
including tumor-specific T-cells. In our study, there was no report
of postoperative infection or adverse wound healing in either
patient group, consistent with the generally low incidence (<1%)
of such adverse events in hip arthroplasty surgery
51. As such,
studies further examining the effects of perioperative GC
administration on surgical outcomes that include wound healing,
postoperative infections, and disease recurrence after cancer
surgery seem warranted
2,13.
Mapping statistical inference information onto individual
clusters of phenotypically defined immune cells complements the
single-cell level characterization of MP’s effect on the surgical
immune response. Aspects of our
findings are in agreement with
prior immune profiling of GC administration in surgical and
non-surgical patients
52,53. For example, MP administration
results in increased neutrophil and NK cell frequencies 6 and 24 h
after surgery. This is consistent with previous reports
doc-umenting demargination and impaired extravasation of
neu-trophils and NK cells after GC treatment, which are partially
mediated by the inhibition of L-selectin expression
52,54,55.
Con-versely, MP administration resulted in decreased CD4
+T cell
frequencies (in particular CD4
+memT cells) 1 and 6 h after
sur-gery, which is consistent with previous observations in surgical
patients receiving GCs and the high sensitivity of T cells to
apoptosis induction by GCs
52,56,57.
Similarly, some MP-mediated alterations of immune signaling
responses echo previous
findings. For example, MP increases total
IκBα in the majority of innate and adaptive immune cells. These
findings are consistent with in vitro
58and in vivo studies,
including a recent transcriptomic analysis of GC administration
in healthy volunteers documenting direct induction of IκBα gene
and protein expression via DNA-binding of the GC receptor
14,59.
Interestingly, MP has little effect on pNF-κB signaling
(phos-pho-S529 on the p65 (RelA) subunit of NF-κB), which increases
in innate immune cells after surgery, particularly in cMCs
(Supplementary Figs. 3, 4). Our
findings suggest that in the
context of surgery, the MP-mediated increase in IκBα may
pri-marily inhibit NF-κB signaling via cytoplasmic sequestration,
rather than inhibiting phosphorylation at S529, a key
phos-phorylation events controlling NF-κB nuclear translocation
in response to inflammatory signals such as IL-1β and TNF
60.
In addition, MP may inhibit NF-κB signaling through
IκB-independent mechanisms, such as direct protein-protein
inter-action at NF-κB DNA binding sites
61,62. However, such
mechanisms would not have been detected with our current mass
cytometry assay. These results emphasize the complexity and
redundancy of NF-κB activation after traumatic injury. They also
highlight the benefits of analytical platforms such as mass
cyto-metry that allow probing multiple elements of the same pathway
to gain a comprehensive understanding of the effect that GCs
exert on immune cell function after surgical trauma.
Remarkably, MP treatment inhibits JAK/STAT signaling
responses to surgery in adaptive immune cells, while minimally
affecting these signaling responses (including inhibition of the
pSTAT3, pSTAT5, and to a lesser extent, pSTAT1 signals) in
innate immune cells. Several mechanisms likely underlie these
findings, as the interaction between the GC receptor and the JAK/
STAT signaling pathways is complex
63. In general, GCs suppress
the transcription of pro-inflammatory cytokines such as 2,
IL-6, Interferons, and GM-CSF, which activate JAK/STAT signaling
after injury. Inhibition of JAK/STAT cytokine production after
trauma may differentially affect innate and adaptive cells as
cytokine
receptor
expression
and
downstream
activation
of STATs is often lineage-dependent
45,64. In vitro studies
have also shown that GCs can stimulate the transcription of
anti-inflammatory JAK/STAT-targeting cytokines such as IL-10,
specifically in MCs but not in T cells
65. As such, increased
autocrine activation of JAK/STAT signaling by cytokines
selec-tively induced by GCs in innate immune cells may account for
observed preservation of JAK/STAT signaling responses in innate
immune cells.
This study has certain limitations. The modest sample size
recruited from a single clinic site and the restriction to THA
surgery limit the generalizability beyond the studied population
and type of surgery. In particular, given that our patient
popu-lation is enriched for elderly patients (over 65-years old) we
cannot conclude that age-related immune dysfunction such as
immunosenescence did not contribute to the pronounced
inhi-bitory effect of MP on adaptive cell signaling responses
66,67.
Similarly, only one single-dose GC regimen is examined. It is
possible that repeated dosing of steroids may alter measured
clinical outcomes. While this is presently not known, additional
safety and efficacy data are warranted
68. Future studies with
larger and younger patient cohorts undergoing a broader array of
surgical procedures and various GC administration regimens will
be required to test the boundaries of the generalizability of our
findings. While applied mass cytometry assays allow measuring
over
fifty parameters per cell, the number of assessed phenotypic
markers and signaling responses is not exhaustive. In particular,
our analysis does not include assessment of cytokine expression,
cell migration, and apoptosis or proliferation, which would have
complemented the functional assessment of proximal immune
cell signaling responses. However, our approach, combined with
emerging statistical methods allowing for integrated and
multi-omic analysis of inflammatory responses, provides an analytical
framework to expand upon in future studies simultaneously
examining how GCs affect a patient’s immunome, proteome, and
transcriptome in the context of surgery.
GCs are commonly administered to patients undergoing
sur-gery, but our understanding of their effect on patients’ immune
response is quite limited. We applied high parameter, single-cell
mass cytometry at the bedside to produce a reasonably
compre-hensive atlas detailing the effects of MP on peripheral immune
cell dynamics in patients undergoing major joint replacement
surgery. MP treatment profoundly alters immunological
trajec-tories after surgery, which is particularly pronounced for the
adaptive immune compartment. However, cell-specific signaling
responses previously associated with critical clinical recovery
parameters, including the resolution of pain and functional
impairment, are spared by the MP treatment. These
findings are
consistent with the observation that MP does not alter these
clinical recovery parameters. However, the pronounced effects of
MP on the adaptive immune compartment call for studies of
clinical outcomes potentially affected by such immune alterations.
A particular intriguing
field includes surgical oncology as GCs
may affect immune mechanisms relevant for tumor surveillance.
Methods
Study design. This double-blind, placebo-controlled, randomized, and prospective clinical study was approved by the Danish Health and Medicine Authority (EudraCT 2015‐000102‐19), the Ethics Committee for the Capital Region of Denmark (H‐ 15007653, protocol approval July 2015), the Danish Data Protection Agency, and registered at ClinicalTrials.gov (NCT02542592). Patients were enrolled after obtaining written informed consent. Inclusion criteria were: age 55–80 years and the ability to speak and understand Danish. Exclusion criteria were: general anesthesia, cancer, autoimmune diseases including rheumatoid arthritis, allergy or intolerance to MP, local or systemic infection, continued systemic treatment with steroids within 30 days before surgery, insulin-dependent diabetes, atrialfibrillation, neurological diseases including Parkinson’s, daily use of hypnotics or sedatives, alcohol use >35 units per week, active treatment of ulcers within 3 months before surgery, pregnancy, and breast-feeding or recent onset of menopause (<1 year) in women.
The manuscript was prepared according to the Consolidated Standards of Reporting Trials (CONSORT) recommendations for reporting randomized, controlled, clinical trials. The CONSORT chart is provided in Supplementary Fig. 1.
Randomization and blinding. A random allocation sequence (1:1 allocation rate, no block randomization) was created, and numbered and sealed envelopes were prepared to determine which arm of the study each patient would fall into. On the day of surgery, the envelopes were opened by a nurse not involved in any other aspect of the study, and either a single dose of 125 mg of methylprednisolone (Solu‐ Medrol®; Pfizer, Ballerup, Denmark) (MP group) or a single dose of isotonic saline (control group) was prepared in a separate room. MP or saline placebo were prepared in masked syringes and administered by one of two blinded investigators immediately after completion of spinal anesthesia. The dose and timing of MP administration were chosen based on a prior study suggesting beneficial effects on pain and recovery40.
Surgical and anesthetic procedure and anesthesia. All patients underwent THA surgery for treatment of osteoarthritis at the Copenhagen University Hospital in Copenhagen, Denmark. Surgical and anesthetic procedures have been previously described in detail36. All surgeries were performed under lumbar spinal anesthesia
with 12.5–17.5 mg isobaric bupivacaine (5 mg/ml, 0.5%). After surgery, patients followed a routine, well‐defined, fast‐track rehabilitation regime, that included fluid therapy, a standard multimodal pain treatment, mobilization on the day of surgery, and well-defined discharge criteria69.
Surgical recovery outcomes. Assessments were made 1 h before and 1, 2, 7, 14, and 28 days after surgery as previously described in detail23. In brief, fatigue and
resulting functional impairment were captured with the Surgical Recovery Scale (SRS; 17–100 = worst/best score), a well validated questionnaire specifically designed for the surgical setting70. Pain and functional impairment of the hip were
assessed with the Western Ontario and McMaster Universities Arthritis Index (WOMAC) adapted to the surgical setting71. Pain scores range from 0–40 (no/
worst pain), and function scores range from 0–60 (no/most severe impairment).
Whole blood sample processing for mass cytometry. Whole blood samples were collected in sodium-heparinized tubes at 6 time points (1 hour before surgery and 1, 6, 24, 48 h, and 2 weeks after surgery). Within 30 minutes of phlebotomy, samples (1 mL) were processed andfixed in Smart Tubes (Smart Tube Inc., San Carlos, CA), and then immediately stored at−80 °C. All samples were shipped on dry ice as a single batch to Stanford University (Stanford, CA) for further pro-cessing and analysis.
After thawing and erythrocyte lysis, samples were barcoded and stained with surface and intracellular antibodies using standardized protocols23,38. In brief, whole
blood samples were subjected to erythrocyte lysis using Thaw-Lyse Buffer (Smart Tube, Inc., San Carlos, CA) and isolated leukocytes from each sample were treated (“barcoded”) with a unique combination of 3 palladium isotopes (Trace Sciences, International, Wilmington, DE) in 0.02% saponin (Millipore-Sigma, St. Louis, MO). After barcoding, cells were pooled and treated in aggregate with 1:100 Human Fc block (Biolegend, San Diego, CA), stained with a custom panel of commercially available antibodies covalently conjugated to a proprietary polymer loaded with lanthanide isotopes (Fluidigm, Inc., South San Francisco, CA), then treated with an iridium-based DNA intercalator (Fluidigm, Inc., South San Francisco, CA)
(Supplementary Table 1). In order to minimize experimental variability, samples corresponding to an entire time series were barcoded, stained, and run simultaneously on the mass cytometry instrument72,73. In order to maximize the sensitivity of the
assay for detection of differences between the MP and control groups, sample time series from patients in the MP group were randomly paired with samples from patients in the control group, and paired sample time series were barcoded and run using the same barcode plate. Barcoded samples were analyzed at aflow rate of ∼600–800 cells/s. The output FCS files were normalized (https://github.com/nolanlab/ bead-normalization/releases) and de-barcoded ( https://github.com/nolanlab/single-cell-debarcoder/releases/tag/v0.2) using MatLab-based software73,74. The resulting
FCSfiles were uploaded to the Cell Engine (https://cellengine.com, Primity Bio, Fremont, CA)flow cytometry analysis platform.
Derivation of immune features. Manual gating was performed using Cell Engine according to a standard gating strategy38,75(Supplementary Fig. 2). The following 21
cell types were included in the analysis: neutrophils, CD27+Bmemcells, CD27−Bnaive
cells, CD56hiCD16−NK cells, CD56loCD16+NK cells, CD4+CD45RA−T
cells (CD4+Tmem), CD4+CD45RA+T cells (CD4+Tnaive), CD4+Tbet+
CD45RA−T cells (Th1), CD4+Tbet+CD45RA+T cells, CD25+FoxP3+CD4+T cells (Tregs), CD8+CD45RA−T cells (CD8+Tmem), CD8+CD45RA+T cells (CD8+Tnaive),
CD8+Tbet+CD45RA−T cells, CD8+Tbet+CD45RA+T cells, TCRγδ T cells, CD14+CD16−classical monocytes (cMCs), CD14−CD16+non-classical monocytes (ncMCs), CD14+CD16+intermediate monocytes (intMCs), monocytic myeloid-derived suppressor cells (M-MDSCs), myeloid dendritic cells (mDCs), and plasmacy-toid dendritic cells (pDCs).
Cell frequencies for mononuclear cells were expressed as a percentage of gated singlet live mononuclear cells (cPARP−CD45+CD66−), while frequencies for neutrophils were expressed as a percentage of gated singlet live cells (cPARP−). Frequencies were calculated at the pre-surgical time point, and at 1, 6, 24, 48 h, and 2 weeks after surgery.
The intracellular expression of the following functional markers was simultaneously quantified per single cell: phospho-(p)STAT1, pSTAT3, pSTAT5, pSTAT6, pNF-κB, pMAPKAPK2, pP38, prpS6, pERK1/2, pCREB, and total IκBα. For each cell type, basal signaling activities were expressed as the median signal intensity (arcsinh transformed value) of each signaling protein. Signaling changes in response to surgery were expressed as the difference in median signal intensity (arcsinh ratio) from baseline signaling.
All p-values calculated from manually gated cells were derived using a two-sided Wilcoxon rank sum test and are contained within Supplementary Table 2.
Visualization of immune system dynamics. To visualize trajectories of the immune system over time, all features extracted using manual gating were divided into“adaptive” and “innate” groups based on prior knowledge. All features were normalized by subtracting the value of the pre-surgical time point. All data points were visualized using two separate dimension-reduction analyses using the Isomap algorithm76. To produce continuous projections between the data points, a linear
transformation was used after dimension reduction.
Bootstrapped clustering methods. To complement the manual gating analysis, an unsupervised clustering approach was used to partition cells into phenotypically distinct subpopulations. State-of-the-art algorithms, such as Citrus77, FlowSOM78,
and PhenoGraph79produce variable results across algorithm runs which lead to
inconsistent cluster-based features that can result in unstable classification results. To address these limitations, we implemented a bootstrapped clustering and classification pipeline enabling us to identify the key cell types and signaling pathways that differ between the control and MP groups. Notably, the clustering approach is downsampling-free and can efficiently integrate all cell events over a large number of samples. This is achieved through a metaclustering strategy where all cells from each sample arefirst clustered independently to define sample-specific clusters. The cluster centers are then integrated to define a set of metaclusters across all samples. This process is computationally efficient and can scale to a large number of samples.
To account for the variability that arises across individual runs of a clustering algorithm, CD45+cells across all 331 samples were subjected to bootstrapped meta-clustering (CD66+/CD45−neutrophils were excluded of the analysis for ease of representation, and examined separately). Each of the refined FCS files corresponding to each sample were then coarsely clustered using k-means based on the 26 phenotypic markers. The number of cluster centers input to k-means for each sample FCSfiles waspffiffiffiffiffiffiffiffiffiN=2, where N is the number of cells in the FCSfile. The resulting cluster centers associated with each FCSfile were then extracted and concatenated to form a new data matrix. This matrix of cluster centers was then repeatedly clustered using k-means into 30 meta-clusters 200 different times to account for the variability between clustering iterations. Features encoding cell frequencies and functional marker expressions were constructed for each individual cluster across all meta-clustering iterations.
To compute the frequency of a cell cluster in a particular sample, we calculate the proportion of that sample’s cells assigned to that cluster as a percent of the total cells in that sample. The frequencies used in downstream bioinformatics analyses are thus normalized by the total number of events in each sample’s FCS file. To
compute signaling responses of individual cell clusters at each post-surgical time point for each cell cluster, the difference in signal intensity of each signaling maker between the postoperative time point and the preoperative time point (Arcsinh ratio) is quantified.
Random Forest analysis. A RF classifier80was trained at each time point using the
cell frequency and signaling-based features constructed for each of the identified meta-clusters. At each individual time point, these features were used in a repeated leave-group-out cross validation approach to predict the probability that each sample came from a patient in the MP group. The leave-group-out cross validation pipeline is an ensemble-based classification approach, where a model training and prediction procedure is repeated over 200 iterations. At each iteration, half of the samples were used to train a RF model and predictions were made on samples in the remaining half of the data. The ultimate predicted value for a sample was the median predicted probability over the predictions from the cross-validation iterations where the sample was included in the test set. The predicted probabilities for each sample were used to construct ROC curves with the associated area under the ROC curve (AUC) using the pROC package in R. The p-value (p) from a Wilcoxon Rank Sum Test was used at each time point to test the null hypothesis that the predicted probabilities for the MP and control were equal.
Visualization of immune cell atlas. The bootstrapped meta-clusters were visua-lized in two dimensions using PCA. Each cluster wasfirst represented by the median expression of its 26 phenotypic markers and then reduced to a two-dimensional representation through PCA. Clusters colored by their median phe-notypic marker expression were used to annotate cell populations. The two-dimensional PCA plot of all identified clusters provided the backbone of a high-resolution immune cell atlas that can be used to communicate statistical infor-mation about cell frequency and signaling differences between control and MP patients.
Best p-value plots provide a visual depiction of the relative effect of MP on individual immune cell clusters at each of the time points. All of the frequency and signaling-based features computed for each of the identified clusters were used to statistically test for differences between control and MP patients. In every cluster and for every frequency and signaling-based feature, a Wilcoxon rank sum two-sided test was used to test the null hypothesis that the mean value of the particular feature was equal between control and MP samples in the cluster. The corresponding−log10p-value was recorded and points (corresponding to clusters)
were ultimately colored by the best−log10p-value across all tested features. A plot
with clusters colored by their best p-value was created for the 1, 6, 24, 48 h, and 2 week time points.
Sign(r)−log10p-values plots were constructed to communicate whether the
mean value of each feature (frequency or signaling feature) was higher among control or MP samples within each cluster. For a given cluster-based feature, f, we computed the mean value of f in the MP and control samples. We defined sign(r) to be 1 if the mean value of the feature was higher in the MP group or−1 if the feature was higher in the control group. We used a Wilcoxon Rank Sum test to test the null hypothesis that the mean of f was the same between MP and control groups in the particular cluster. The Wilcoxon Rank sum test yielded a corresponding p-value for each cluster and each cluster was colored according to the sign(r)-log10p-value. Blue/red colors indicate features that are higher/lower in
the MP compared to the control group.
Reporting summary. Further information on research design is available in the Nature Research Reporting Summary linked to this article.
Data availability
Raw data were uploaded and made publicly available athttps://
flowrepository.org/id/FR-FCM-Z2AT. The source data underlying Figs.3b, c,4b, c,5b, and c are provided as a
source datafile. Source data are provided with this paper.
Code availability
The predictive modeling was performed using the VoPo framework81, available at:
https://nalab.stanford.edu/vopo/. Scripts and processed data for reproduction of the
results are available athttps://github.com/stanleyn/steroid_immune_data. Source data
are provided with this paper.
Received: 21 October 2019; Accepted: 3 July 2020;
References
1. Lunn, T. H. & Kehlet, H. Perioperative glucocorticoids in hip and knee surgery - benefit vs. harm? A review of randomized clinical trials. Acta Anaesthesiol. Scand. 57, 823–834 (2013).
2. Asehnoune, K., Futier, E., Feuillet, F., Roquilly, A. & group, P. PACMAN trial protocol, Perioperative Administration of Corticotherapy on Morbidity and mortality After Non-cardiac major surgery: a randomised, multicentre, double-blind, superiority study. BMJ Open 9, e021262 (2019).
3. Chatham, W. W. & Kimberly, R. P. Treatment of lupus with corticosteroids. Lupus 10, 140–147 (2001).
4. Salerno, A. & Hermann, R. Efficacy and safety of steroid use for postoperative pain relief. Update and review of the medical literature. J. Bone Jt. Surg. Am. 88, 1361–1372 (2006).
5. Clark, A. R. Anti-inflammatory functions of glucocorticoid-induced genes. Mol. Cell Endocrinol. 275, 79–97 (2007).
6. Coutinho, A. E. & Chapman, K. E. The anti-inflammatory and immunosuppressive effects of glucocorticoids, recent developments and mechanistic insights. Mol. Cell Endocrinol. 335, 2–13 (2011).
7. Toner, A. J., Ganeshanathan, V., Chan, M. T., Ho, K. M. & Corcoran, T. B. Safety of perioperative glucocorticoids in elective noncardiac surgery: a systematic review and meta-analysis. Anesthesiology 126, 234–248 (2017). 8. Kehlet, H. & Lindberg-Larsen, V. High-dose glucocorticoid before hip and
knee arthroplasty: To use or not to use-that’s the question. Acta Orthopaedica 89, 477–479 (2018).
9. Ho, C. M., Ho, S. T., Wang, J. J., Tsai, S. K. & Chai, C. Y. Dexamethasone has a central antiemetic mechanism in decerebrated cats. Anesthesia Analgesia 99, 734–739 (2004).
10. De Oliveira, G. S. Jr, Almeida, M. D., Benzon, H. T. & McCarthy, R. J. Perioperative single dose systemic dexamethasone for postoperative pain: a meta-analysis of randomized controlled trials. Anesthesiology 115, 575–588 (2011).
11. Holte, K. & Kehlet, H. Perioperative single-dose glucocorticoid
administration: pathophysiologic effects and clinical implications. J. Am. Coll. Surg. 195, 694–712 (2002).
12. Anstead, G. M. Steroids, retinoids, and wound healing. Adv. Wound Care 11, 277–285 (1998).
13. Freeman, J. et al. Effect of perioperative lidocaine, propofol and steroids on pulmonary metastasis in a murine model of breast cancer surgery. Cancers
https://doi.org/10.3390/cancers11050613(2019).
14. Cain, D. W. & Cidlowski, J. A. Immune regulation by glucocorticoids. Nat. Rev. Immunol. 17, 233–247 (2017).
15. Fillinger, M. P. et al. Glucocorticoid effects on the inflammatory and clinical responses to cardiac surgery. J. Cardiothorac. Vasc. Anesthesia 16, 163–169 (2002).
16. Corcoran, T. et al. Intraoperative dexamethasone alters immune cell populations in patients undergoing elective laparoscopic gynaecological surgery. Br. J. Anaesth. 119, 221–230 (2017).
17. Tanaka, T., Narazaki, M. & Kishimoto, T. IL-6 in inflammation, immunity, and disease. Cold Spring Harb. Perspect. Biol. 6, a016295 (2014).
18. Yue, C., Wei, R. & Liu, Y. Perioperative systemic steroid for rapid recovery in total knee and hip arthroplasty: a systematic review and meta-analysis of randomized trials. J. Orthop. Surg. Res. 12, 100 (2017).
19. Roquilly, A. et al. Hydrocortisone prevents immunosuppression by interleukin-10+ natural killer cells after trauma-hemorrhage. Crit. Care Med. 42, e752–e761 (2014).
20. Seshadri, A. et al. Phenotyping the immune response to trauma: a multiparametric systems immunology approach. Crit. care Med. 45, 1523–1530 (2017).
21. Bendall, S. C., Nolan, G. P., Roederer, M. & Chattopadhyay, P. K. A deep profiler’s guide to cytometry. Trends Immunol. 33, 323–332 (2012). 22. Bjornson, Z. B., Nolan, G. P. & Fantl, W. J. Single-cell mass cytometry for
analysis of immune system functional states. Curr. Opin. Immunol. 25, 484–494 (2013).
23. Gaudilliere, B. et al. Clinical recovery from surgery correlates with single-cell immune signatures. Sci. Transl. Med. 6, 255ra131 (2014).
24. Fragiadakis, G. K. et al. Patient-specific immune states before surgery are strong correlates of surgical recovery. Anesthesiology 123, 1241–1255 (2015). 25. Angele, M. K. & Faist, E. Clinical review: immunodepression in the surgical
patient and increased susceptibility to infection. Crit. Care 6, 298–305 (2002). 26. Stoecklein, V. M., Osuka, A. & Lederer, J. A. Trauma equals danger–damage
control by the immune system. J. Leukoc. Biol. 92, 539–551 (2012). 27. Hall, G. M., Peerbhoy, D., Shenkin, A., Parker, C. J. & Salmon, P. Relationship
of the functional recovery after hip arthroplasty to the neuroendocrine and inflammatory responses. Br. J. Anaesth. 87, 537–542 (2001).
28. Kehlet, H. & Wilmore, D. W. Evidence-based surgical care and the evolution of fast-track surgery. Ann. Surg. 248, 189–198 (2008).
29. Ni Choileain, N. & Redmond, H. P. Cell response to surgery. Arch. Surg. 141, 1132–1140 (2006).
30. Giannoudis, P. V., Dinopoulos, H., Chalidis, B. & Hall, G. M. Surgical stress response. Injury 37(Suppl 5), S3–S9 (2006).
31. Marik, P. E. & Flemmer, M. The immune response to surgery and trauma: implications for treatment. J. Trauma Acute Care Surg. 73, 801–808 (2012).