HAL Id: tel-02961871
https://hal.univ-lorraine.fr/tel-02961871
Submitted on 8 Oct 2020HAL is a multi-disciplinary open access archive for the deposit and dissemination of sci-entific research documents, whether they are pub-lished or not. The documents may come from teaching and research institutions in France or abroad, or from public or private research centers.
L’archive ouverte pluridisciplinaire HAL, est destinée au dépôt et à la diffusion de documents scientifiques de niveau recherche, publiés ou non, émanant des établissements d’enseignement et de recherche français ou étrangers, des laboratoires publics ou privés.
interactions for a better understanding of the growth
mechanisms within the PEO process
Vitalios Ntomprougkidis
To cite this version:
Vitalios Ntomprougkidis. Study of the micro-discharges / metallic surfaces interactions for a better understanding of the growth mechanisms within the PEO process. Plasma Physics [physics.plasm-ph]. Université de Lorraine, 2020. English. �NNT : 2020LORR0077�. �tel-02961871�
AVERTISSEMENT
Ce document est le fruit d'un long travail approuvé par le jury de
soutenance et mis à disposition de l'ensemble de la
communauté universitaire élargie.
Il est soumis à la propriété intellectuelle de l'auteur. Ceci
implique une obligation de citation et de référencement lors de
l’utilisation de ce document.
D'autre part, toute contrefaçon, plagiat, reproduction illicite
encourt une poursuite pénale.
Contact : ddoc-theses-contact@univ-lorraine.fr
LIENS
Code de la Propriété Intellectuelle. articles L 122. 4
Code de la Propriété Intellectuelle. articles L 335.2- L 335.10
http://www.cfcopies.com/V2/leg/leg_droi.php
UNIVERSITE DE LORRAINE
Ecole Doctorale : Chimie – Mécanique – Matériaux - Physique
Institut Jean Lamour
Département Chimie et Physique des Solides et des Surface
THESE
Soutenue le 15 Juillet 2020
Pour obtenir le grade de Docteur de l’Université de Lorraine Spécialité : Physique – Physique des plasmas et applications
par
Vitalios NTOMPROUGKIDIS
Etude de l'interaction micro-décharges / surfaces métalliques pour une
meilleure compréhension des mécanismes de croissance lors du procédé PEO
(Titre en anglais)
Study of the micro-discharges / metallic surfaces interactions for a better
understanding of the growth mechanisms within the PEO process
Jury
Rapporteurs ARURAULT Laurent Professeur, CIRIMAT, Université de Toulouse
LAVISSE Luc Maître de conférences, ICB, Université de Bourgogne
Examinateurs CHAMPEAUX Corinne Professeure, IRCER, Université de Limoges
BESLAND Marie-Paule Directrice de recherche, IMN, Université de Nantes
VEYS-RENAUX Delphine Maître de conférences, IJL, Université de Lorraine
Directeur de thèse HENRION Gérard Directeur de recherche, IJL, Université de Lorraine
I
Acknowledgements
First of all, I would like to express my sincere gratitude to my supervisor, Gérard Henrion, for accepting me in this project, for putting his trust and belief in my capability to carry out this research. I am grateful for his guidance, mentorship and support during these three years, from which I have learned a lot. One could not ask for a better supervisor. Thank you very much.
I would also like to thank my co-supervisor, Julien Martin, with whom we had an excellent collaboration conducting all the experiments of this work. For his guidance and tutoring on experimental procedures, for all our discussions analysing our results and all the advices he provided on multiple occasions.
A very special thanks to Alexandre Nominé for all the work we have done together, particularly for the discussions we had and his scientific advices and help. It was a real pleasure to share an office in a very friendly and enjoying environment both professionally and personally.
I would like to acknowledge the members of the CC3M competence cluster for their contributions in this work. I am thankful to Sandrine Mathieu and Christine Gendarme for their tutoring and their advices on the SEM microscope, to Stéphanie Bruyère and Sylvie Migot for their contributions with the TEM analysis, Erwan Etienne for his help in metallurgical post-treatments. For their help and advices on XRD measurements and analysis, I would like also to thank Pascal Boulet and Sebastien Diliberto from the x-gamma competence cluster. I would like to thank Ilya Bardin from MISIS university of Moscow, with whom I had the pleasure to work in person, discuss and learn from.
A great amount of this work involved people from within the Institute Jean Lamour as well as outside the laboratory. I would like to thank Pauline Haraux, Komlan Akoda, Alexandre Bastien, Pascal Brenot, Guillaume Ezo’o, A. Maizeray, O. Ferry and Julien Jourdan for their contributions in this thesis. Charles Roux-Pertus for his help in thickness and porosity calculations.
I would very much like to thank all the colleagues of the laboratory for their help, each one in their own way. Vincent Guigoz, Stephane Cuynet, Thierry Czerwiec, Mohammed Belmahi, Maike Thal for their input in my work with occasional discussions to resolve some of the problematics concerning this research. A great thanks to Cédric Noël for his tutoring, support and constant availability on spectroscopic measurements and analysis methods and to Régis Reigner for his technical support.
I would like to express my appreciation to Christine Sartori, Georges Billant, Martine Tailleur, Nathalie Niclas, Valerie Frank and Anne-Marie Airault for their help in administrative procedures.
II
These three years would have not been the same without the friends I met and from whom I received a warm welcome in and outside the laboratory. Fahad, Joseph, Christophe, Alejandro, Claudia at first and later on Alexis, Marianna, Feriel, Agathe, Shantanu. Thank you guys for all the wonderful moments we have spent. I would like also to thank the Greek community of Nancy, Katerina Cael, Ortho Salomon, Alexandros Petrelis, for their help and support from the very moment of my arrival to Nancy.
I am grateful to LabEx DAMAS (Laboratoire d’ Exellence Design of Alloy Metals for low-mAs Structures) for financing this doctoral scholarship.
Finally, I would like to thank my family in Greece, my brother and particularly my parents. Their constant support, encouragement, love and care was invaluable during all this period.
III
Table of Contents
General Introduction ... 1
Chapter I - State of the art ... 5
I.1 Introduction ... 5
I.2 Plasma Electrolytic Oxidation ... 5
I.2.1 Historical development of PEO ... 5
I.2.2 Processing principle ... 6
I.2.3 Supplying modes ... 7
I.2.4 Influence of PEO processing parameters ... 8
I.2.4a Effect of the electrolyte ... 9
I.2.4b Influence of the electrical parameters ... 12
I.3 “Soft” regime ... 14
I.4 Properties of micro-discharges ... 16
I.4.1 Spatial characteristics ... 17
I.4.2 Temporal characteristics ... 17
I.4.3 Physical properties of the micro-discharges ... 19
I.5 Structural properties of PEO oxide coatings ... 21
I.6 Growth mechanisms ... 24
I.7 Conclusions of Chapter I ... 26
Chapter II - Experimental considerations ... 29
II.1 Introduction of the chapter II ... 29
II.2 Experimental installation ... 29
II.2.1 The electrical generator ... 29
II.2.2 The electrolytic cell... 31
II.2.3 The electrodes ... 32
II.3 In situ diagnostic of the PEO process ... 33
II.3.1 Electrical time-response ... 33
IV
II.3.2a Photomultiplier ... 34
II.3.2b Optical emission spectroscopy (OES) ... 35
II.3.2c Fast video imaging ... 36
II.4 Ex situ characterisation of the PEO coatings ... 37
II.4.1 Scanning electron microscopy (SEM) and EDX measurements ... 37
II.4.2 X-ray Diffraction (XRD) and grazing incidence X-ray diffraction (GIXRD) ... 37
II.4.3 Transmission Electron Microscopy (TEM) and Scanning (STEM) ... 38
Chapter III - Sequential run of the PEO process ... 39
III.1 Introduction of the chapter III ... 39
III.2 Specific experimental procedure ... 39
III.2.1 Material and electrolyte ... 39
III.2.2 Variation of the electrical conditions ... 39
III.2.3 In situ diagnostic of the PEO process ... 40
III.2.4 Ex-situ characterization of the PEO coatings ... 41
III.3 Results on the in-situ diagnostic of the PEO process ... 41
III.3.1 Establishment of the “soft” regime ... 41
III.3.2 Delay in the micro-discharges appearance ... 43
III.3.3 Time constant of the anodic voltage-time response ... 46
III.3.4 Properties of the micro-discharges ... 48
III.4 Results on the ex-situ characterization of the PEO coatings ... 50
III.4.1 Morphology of the PEO coatings ... 50
III.4.2 Crystallographic phases in PEO coatings ... 52
III.4.3 Element distribution in PEO coatings ... 53
III.5 Discussion of the results ... 55
III.5.1 Discussion about a mechanism of charge accumulation ... 55
III.5.2 Discussion about coatings improvement using sequenced PEO treatments ... 59
III.5.3 Discussion about energy efficiency using sequential PEO treatments ... 60
III.6 Conclusions of Chapter III ... 61
V
IV.1 Introduction of the chapter IV ... 63
IV.2 Specific experimental conditions ... 63
IV.2.1 Materials and electrolytes ... 63
IV.2.2 PEO processing conditions ... 64
IV.2.3 In situ characterisation of the PEO process ... 64
IV.2.4 Ex situ characterisation of the PEO coatings ... 65
IV.3 Effect of the electrolyte on the PEO process ... 65
IV.3.1 Effect of the electrolyte on the voltage-time response ... 66
IV 3.2 Effect of the electrolyte on the PEO coatings ... 68
IV.4 Specific effect of the aluminium alloy on the PEO process in “soft” regime ... 70
IV.4.1 Fast video imaging ... 70
IV.4.2 In situ characterisation by optical emission spectroscopy ... 71
IV.4.2a Presence of broad emission continuum ... 72
IV.4.2b Electron (Te). rotational (Trot) and gas (Tgas) temperatures... 75
IV.4.2c Electron density Te ... 78
IV.5 Ex-situ characterisation of the PEO coatings ... 83
IV.5.1 X-ray diffraction measurements ... 83
IV.5.2 Morphology and elemental composition of the PEO coatings ... 84
IV.6 Interaction of MDs with the surrounding environment ... 88
IV.6 Phenomenological interpretation ... 93
IV.7 Conclusions of Chapter IV ... 97
Chapter V - Formation of PEO coatings in the “soft” regime conditions ... 99
V.1 Introduction of the chapter V ... 99
V.2 Specific experimental conditions ... 100
V. 2.1 Elaboration of specific samples in the PEO “soft” regime conditions ... 100
V.2.2 Ex situ characterisation of the PEO coatings ... 101
V.2.3 In situ characterisation of the PEO process ... 101
V.3 Results on the ex situ characterisation of the PEO coatings ... 102
VI
V.3.2 Characterisation at the sub-micrometre scale ... 105
V.4 Results on the in situ characterisation of the PEO process ... 110
V.4.1 Estimation of the electron temperature in the plasma of the micro-discharges ... 110
V.4.2 Estimation of the rotational temperature in the plasma of the micro-discharges ... 112
V.5 Discussion ... 113
V.5.1 Estimation of the heating rate (HR) ... 114
V.5.2 Estimation of the crystallisation temperature (Tc) ... 115
V.5.3 Estimation of the cooling rate (CR) ... 117
V.5.4 Mechanism of melting and metastable solidification route ... 117
V.6 Conclusions of Chapter V ... 120
Chapter VI - New opportunities for the Plasma Electrolytic Oxidation process ... 121
VI.1 Introduction of the chapter VI ... 121
VI.2 Formation of metallic oxide particles using the PEO process ... 121
VI.2.1 Introduction ... 121
VI.2.2 Specific experimental conditions ... 122
VI.2.3 Results and discussion ... 124
VI.2.3a Morphology of the particles ... 124
VI.2.2b Chemical composition of the particles ... 126
VI.2.2c Crystallographic phases of the particles ... 128
VI.2.2d Discussion about the formation mechanism of the particles ... 131
VI.2.4 Intermediate conclusion ... 134
VI. 3 Duplex surface treatment using cold-spray and PEO processes... 135
VI.3.1 Introduction ... 135
VI.3.2 Specific experimental conditions ... 136
VI.3.2a Metallic substrates ... 136
VI.3.2b Cold-spray processing conditions ... 137
VI.3.2c PEO processing conditions ... 138
VI.3.2.d Ex-situ characterization of the coatings ... 139
VII
VI.3.3a Establishment of the “soft” sparking regime ... 139
VI.3.3b Morphology and growth kinetic of the coatings ... 140
VI.3.3c Chemical and crystallographic compositions of the duplex coatings ... 143
VI.3.3d Discussion about the growth mechanism of the duplex coatings ... 148
VI.3.4 Intermediate conclusion ... 152
VI.4 Conclusions of Chapter VI ... 153
General conclusions ... 155
1
General Introduction
Lightweight structures have always been of a particular interest to the manufacturing industry, especially in the domains of aeronautic and automotive. Nowadays, more than ever, the need of reduction in weight, and consequently, in fuel consumption and exhaust emissions, imposes the implementation of lightweight metallic alloys, such as the aluminium, titanium and magnesium. When exposed to atmospheric conditions, specifically in contact with oxygen, these materials form a thin oxide layer that protects themselves against corrosion. In their pure form, they exhibit relatively good anti-corrosion properties. However, in order to improve the mechanical properties, alloying elements are usually added to these light-weight meals which in turn degrade their corrosion resistance. Indeed, the incorporation of these alloying elements into the aluminium matrix creates defects which act as nucleation centres for corrosion. Thus, with the aim to combine good mechanical properties in bulk as well as good corrosion resistance at the surface, surface treatments are usually applied in order to produce protective coatings on aluminium, magnesium and titanium alloys.
For decades, anodising processes (mild or hard anodising) have been used to grow protective oxide ceramic coatings on Al, Mg and Ti based alloys. This leads to significant improvement of corrosion resistance, but limited changes of mechanical properties. In addition, conventional anodising technologies face serious environmental and health issues since, in some cases, they involve the use of hazardous carcinogenic, mutagenic and reprotoxic (CMR) compounds (acids, borates, heavy metals and hexavalent chromium), which are forbidden in EU [1,2]. Although surface treatments in gas phase, such as physical vapour deposition (PVD) and chemical vapour deposition (CVD), could overcome this problem, their application is limited in small scales and cannot satisfy the needs of the industry in processing large surfaces. Thus the need for an alternative process in accordance with the European regulations and the requirements of the modern industry is required.
A solution to the aforementioned issues can be provided by the plasma electrolytic oxidation (PEO). PEO is a surface engineering process suitable for lightweight metals (Al, Mg, Ti) and their alloys to form protective ceramic coatings [3]. It is historically related to anodising as it shares similarities in experimental installations, such as the liquid processing environment (electrolyte) and the application of electrical potential between two electrodes, one of which is the treated element. However, major differences separate conventional anodising and the PEO process. Firstly, PEO processing is run in diluted alkaline electrolytes free of toxic substances and CMR compounds, that meets the recent EU regulations concerning health and environment. Secondly, PEO operates in much higher voltage and current density (hundreds of volts and tens of A⸳dm-2, respectively) than anodising,
2
allowing a higher growth rate (~100 µm⸳h-1) of the final coatings in the range of hundreds of
micrometres. Moreover, the application of high voltage leads to dielectric breakdown phenomena of the growing oxide layer and the appearance of micro-discharges (MDs) over the processed surface, which promote the coating growth. Hence, the oxide growth takes place in highly non-equilibrium plasma conditions.
From the resulting coating point of view, the oxide layers produced by PEO exhibit superior thickness, hardness and better adhesion to the substrate. Moreover, the well crystallised oxide phase offers improved thermal, wear and corrosion resistance [4–8].
However, and contrary to conventional anodising processes, one of the drawbacks of PEO is still the limited knowledge of the fundamental mechanisms that govern the process. Despite the fact that discharge phenomena have been first observed more than a century ago by Sluginov, they were systematically studied during the 1960s and 1970s mainly by research teams in the former USSR [3]. In the recent years, the interest in PEO processing has been constantly increasing and great effort has been done to understand and provide a descriptive model of the growing mechanism. However, its wider industrial application is still restricted due to high energy consumption and lack of understanding of the interrelationship between processing conditions, discharge characteristics and resulting coating microstructure.
This thesis aims to contribute to a better understanding of the physico-chemical reactions and the growth mechanisms that govern the process. To achieve this, the adopted experimental approaches consisted mainly in studying the behaviour and properties of micro-discharges with respect to the applied electrical parameters in order to correlate them with the resulting oxide coatings and provide a descriptive model of the process. This thesis is organised in six chapters as follows:
In chapter I, a short review of the plasma electrolytic oxidation process is presented. After a brief presentation of the history and evolution of the PEO process, the main features and principles are described to facilitate the comprehension of the following chapters. The progress in the field of PEO is presented through recent work of international research groups, regarding various physical properties of the micro-discharges (spatial, temporal) and the associated resulting oxide layers (microstructure).
Chapter II briefly describes all the technical details related to this work, including the processed materials, the experimental installation, as well as the characterisation techniques used.
Chapter III focuses on both the behaviour of micro-discharges and the morphology of the produced PEO coatings with the sudden change of the applied electrical parameters. Switching from one
3 condition to another in the course of treatments, reveal particular and interesting behaviour of MDs in terms of size, distribution and their appearance. These results are correlated with the grown oxide layers. A synergetic effect is observed under certain combinations which is beneficial to the growing oxide in terms of total thickness and microstructure. Lastly, the specific energy consumption of these sequential treatments is considered and compared to their single-sequenced counterparts.
In chapter IV a comparative study of the process between two different alloys and under different types of electrolyte composition is presented at first. The results clearly show the effect of the electrolyte composition and concentration on the distribution of the micro-discharges over the processed surface, and consequently on the resulting oxide coating, as well as the anodic voltage. The results also show that the light emission during a particular “soft” regime is also affected by the processed substrate. To understand this, further studies were conducted by means of optical emission spectroscopy and high speed video recording. Observations of the interactions between the micro-discharges and gas bubbles located at the vicinity of the processed surface indicate that the source of light emission during “soft” regime is localised deep in the inner parts of the growing oxide layer.
Chapter V is focused on the structural study of the particular “pancake” morphology which appears during “soft” regime. The PEO coatings were investigated mainly at the sub-micrometre scale revealing a peculiar nanometre sized lamellar arrangement, consisting of Al2O3 lamellae alternating
periodically with metastable 1:1 mullite lamellae. Along with results from optical emission spectroscopy during the transition to “soft” regime and based on the phase diagram for the Al2O3
-SiO2 binary system, a growth mechanism is proposed which explains the formation of this particular
arrangement.
The final chapter VI focuses on potential new opportunities for the PEO process. The chapter is divided into two parts. The first part describes the feasibility of producing metal oxide particles during PEO treatment. The second part investigates the possibility to elaborate protective coatings on materials that are difficult or even impossible to produce (e.g. magnesium and steel, respectively). This is done by implementing a duplex treatment which involves a first treatment by the cold-spray technique followed by a second one by plasma electrolytic oxidation.
5
Chapter I - State of the art
I.1 Introduction
Almost in every application of lightweight materials, such as aluminium, magnesium and titanium, surface treatment is necessary to modify its properties in accordance with the specific needs of their use. This is particularly evident in the aerospace industry, where the parts of the aircraft are exposed to extreme conditions. As stated previously, to this day this modification is mainly performed by anodising processes, which, besides the restrictions imposed by the EU, has reach also some technical limits, such as low growth rate and overall coating thickness.
Plasma electrolytic oxidation, although similar in some basic experimental principles to the anodising, exhibits many differences in growing mechanisms, kinetics, as well as the microstructure of the resulting oxide layers. Despite the fact that plasma electrolytic oxidation is known for more than a century, it remains still not completely understood and thus, not yet implemented in large scale industrial applications. Despite the fact that in the past decades great progress has been achieved and various models have been proposed, the relationship between the processing conditions, the discharge characteristics and the microstructure of the resulting oxide layer are still not clear.
The objective of the following chapter is to provide an overview of the recent achievements in the PEO process. After a brief presentation of the historical development of PEO, followed by the description of basic principles regarding the processing conditions, a particular attention will be paid to the so called “soft” regime. Description of both the physical properties of the micro-discharges and the microstructural characteristics of the elaborated coatings under different conditions will be given. Finally, some of the proposed growth mechanisms in the literature will be described.
I.2 Plasma Electrolytic Oxidation
I.2.1 Historical development of PEO
The first observation of luminescent phenomena that are associated with electrolysis were observed in 1880 by N. Sluginov [3]. However, it took almost another 50 years until Günterschultze and Betz studied the phenomenon in detail and observed sparking on the anode by anodising in high voltage [9] and called the process as “anodic spark deposition”. The next stage of research in this direction came in the 1960s when W. McNeil and L. Gruss deposited cadmium niobate (Cd2Nb2O7)
6
from components of substrate and electrolyte. From 1970s research has been conducted by many groups from USSR [11], Germany [12], England [13] and USA [14]. However, the research was mainly focused on optimising parameters to improve the resulting coatings and their structural properties. Since the 1990s and with the wide spread of the researches conducted internationally, PEO attracted much attention and the number of works in this field increased, particularly focused to the understanding of the growth mechanisms. A tenfold increase in the number of publications is noted between 2000 and 20191.
Many terminologies are used to name this surface treatment technology: “anodic spark deposition” [14], “micro-arc discharge oxidation (MDO)” [15], “anodic oxidation by spark discharge (ANOF)” [12], “micro-arc oxidation” [4,16,17]and “plasma electrolytic oxidation (PEO)” [18–22], the latter being most broadly used.
I.2.2 Processing principle
As mentioned previously, PEO shares similarities with anodising technologies. From a technical point of view, it involves two electrodes, i.e. a working electrode that faces one or more counter-electrodes, an electrolytic cell in which the electrodes are immersed and a power supply. A cooling system is also integrated to the electrochemical cell in order to keep the temperature constant and to ensure homogeneity of the electrolyte.
As depicted in Fig. I-1, four typical stages can be identified during plasma electrolytic oxidation process [23]. When processing in galvanostatic mode, current is applied between the electrodes. At the beginning, the potential gradually increases and an initial insulating thin oxide layer is formed at the metal surface, commonly called “barrier layer”. This is associated with the release of gaseous oxygen at the anode. When the potential reaches the dielectric breakdown voltage of the oxide, the stage II starts with the ignition of numerous tiny micro-discharges that move rapidly over the whole processed surface. Additionally, Fig.I-2 illustrates the physical appearance of the micro-discharges at different processing stages. This second stage is also characterised by a sharp drop of the voltage slope. As the process continues, the slope of the voltage decreases even more (stage III) due to gradual thickening of the oxide layer and the increase in its impedance. The micro-discharges become larger in size and more persistent at same locations. Stage IV is characterised by even smaller variation of the voltage and intensification of the micro-discharges which decrease in number, but become even larger and long lasting.
1 Data based on search in Science Direct containing the terms “Plasma electrolytic oxidation” and “Micro-arc
7
Figure I- 1. Voltage evolution with processing time for J = 0.1 A⸳cm2. The inset depicts the beginning time (min) and voltage (V) of each stage for different current densities. [23]
Figure I- 2. Evolution of visual aspect of micro-discharges with PEO processing time [19].
I.2.3 Supplying modes
Generally, PEO can be conducted under either potentiostatic [10,14] or galvanostatic [13,24] mode. Within the potentionstatic supplying mode, an overall voltage is applied to the electrolyser system while the current is controlled within the galvanostatic mode. By using a potentiostatic mode, S. D. Brown et al. [14] showed that under constant voltage, as the coating thickness increases, and hence its electrical resistance, the current gradually decays, leading to quenching of the discharges and termination of the process (shown in Fig. I-3). Thus, to ensure continuation of the oxide growth under a spark regime, a constant increase of voltage is needed [10]. However, this can be avoided by
8
using a galvanostatic supplying mode where the voltage is continuously adjusted to maintain the desired current value.
Figure I- 3. Current variation under potentiostatic supplying mode where a constant voltage is applied during the process [14].
PEO process within DC mode was firstly proposed bu it presents the major drawback to promote the appearance of strong micro-discharges that lead to highly porous coatings with poor end-use properties. [3,25]. This issue was partially solved with the use of pulsed DC supplies, which allow the control over the heat conditions during the treatment, thus, changing the coating composition and structure. However, this can lead to additional surface polarisation by the electrical double layer created at the solid/liquid interface [3]. To overcome this problem, AC power supplies can be employed. It has been shown that treatment in alternating mode offers better processing conditions which are more beneficial and lead to improvement of the coating microstructure [26]. In the recent years, pulsed bipolar current mode is preferred, as it offers the flexibility to control the pulse waveforms by adjusting their amplitudes and durations [3].
I.2.4 Influence of PEO processing parameters
The processing parameters of the PEO process have a significant effect on the discharge phenomena and, consequently, on the resulting oxide layers. Indeed, besides the supplying modes described previously, crucial other parameters such as the nature of electrolyte and the electrical conditions play an important role in the PEO process [19,27–34].
9 The geometry of the PEO electrochemical cell, more specifically, the distance between the working electrode and the counter-electrode has also been found to have an influence on the elaborated coatings [35,36]. Melhem et al. [35] showed that, within given electrical conditions, the total thickness and density of the coating can be increased by the proper adjustment of the distance between the electrodes (Fig. I-4). They found that considerable improvement can be achieved within “soft” sparking (as will be described later) conditions (compact symbols in Fig. I-4). However, by applying intense “arcing” conditions, the resulting coatings seems to be unaffected by the distance of the electrodes (open symbols in Fig. I-4). Additionally, investigation of the geometry of the system by implementing rectangular processed sample, faced by two counter-electrodes opposite both surfaces, they illustrated an inhomogeneity of discharge distribution during the process which leads to higher growth at the edges compared to the centre of the sample.
Figure I- 4. Coating thickness variation with inter-electrode distance for two different electrical conditions (open and compact symbols). Squares represent the total thickness, while stars correspond to the dense layer. [35]
I.2.4a Effect of the electrolyte
Among many parameters, the proper choice of the electrolyte is of great importance for the PEO process, as a careful matching is necessary between the metal and the electrolyte. A large variety of electrolytes can be used in PEO, from alkaline electrolyte containing mainly species such as potassium hydroxide (KOH) and sodium silicate (Na2SiO3) [5,19,29,30,37–39] to acidic electrolytes,
such as phosphoric and citric acids, particularly used for the PEO processing of Ti and Zr [40–42]. The composition of the electrolyte affects the total thickness as well as the surface morphology and microstructure of the coatings [43–46]. Kai Wang et al. [44] showed that treatment in aluminate
10
electrolyte results in smoother surface, while the addition of silicate leads to an increased surface roughness. Moreover, the addition of sodium hexafluorosilicate (Na2SiF6) in the solution in both cases
significantly enhanced the thickness and the microhardness of the coatings.
Additives in electrolytic solutions are common practice to incorporate elements into the coating for surface modifications, improved performance or new properties for biomedical use [47–53]. One of the main purposes of particle addition, especially in PEO of magnesium is sealing and waterproofing. Chen et al. [54] incorporated PTFE particles in coatings formed on Mg alloy and showed that the resulting layers exhibited high sealing degree and ultra-low friction coefficient. Similar results were demonstrated by Mohedano et al. [55] and Mashtalyar et al. [56] who added CeO2 and TiN particles in the electrolyte, respectively. Duan et al. [49] performed PEO treatments
on magnesium substrates adding phosphate, fluoride or borate in typical alkaline electrolytes and demonstrated their effect in enhancing the corrosion protection of magnesium against corrosive artificial seawater (3.5% NaCl). Figure I-5 the morphological changes induced to the resulting coating made on magnesium substrate by the addition of TiN particles in various concentrations.
Furthermore, reactive incorporation of particles can lead to the formation of new phases in the coating resulting to composite-like structures [57]. Other fields of interest lie in the enhancement of the photocatalytic properties of the surface [52], surface coloration [53], dental and orthopaedic implants [58].
Figure I- 5. SEM surface and cross-section images of coating obtained without (a, b) and with addition of TiN nanpoarticles in the electrolyte for concentrations of 1 g⸳L-1 (c,d), 2 g⸳L-1 (e, f), 3 g⸳L-1 (g, h), 4 g⸳L-1 (i, j). [56]
11 The concentration of a given electrolyte can also influence both the growth rate of the oxide layer and its mechanical properties. As shown by A. A. Voevodin et al. [4], the increase in concentration of Na2SiO3 leads to the enhancement of the overall thickness, but decrease of the hardness, due to the
formation of larger amounts of alumina-silicate phase (Table I-1). On the other hand, Khan et al. [43] illustrated that higher concentration of potassium hydroxide leads to coating dissolution at the surface and, hence, lower growth rate (Fig. I-6).
Table I- 1. Al-O-Si stoichiometry, ratio of Si/Al content, ratio of alumina and aluminasilicate phases, and Vickers hardness of the PEO coatings produced at different concentrations of sodium silicate in the electrolyte. Table reproduced from [4].
Na2SiO3
concentration (g⸳L-1)
Al–Si–O stoichiometry
Si/Al ratio Ratio of Aland Al-Si-O 2O3 phases Vickers hardness (GPa) 2 Al0.26Si0.08O0.66 0.3 1.0 17 ± 2.5 4 Al0.23Si0.10O0.67 0.4 0.6 14 ± 2.5 6 Al0.22Si0.12O0.67 0.5 0.4 11 ± 2.0 10 Al0.20Si0.14O0.65 0.7 0.2 12 ± 2.0 20 Al0.13Si0.19O0.68 1.5 0.1 6 ± 1.5
Figure I- 6. Thickness dependence on current density and KOH concentration in DC PEO treatments of 6082 aluminium alloy. [43]
Another factor to account for is the ageing of the electrolyte, as it has been demonstrated by Martin et al. [28]. They have shown that ageing of the electrolyte occurs approximately after 2-3 hours of processing, leading to depletion of ionic species in the electrolyte and decrease of its electrical
12
conductivity, which in turn affects the characteristics of micro-discharges and consequently the forming oxide layer.
I.2.4b Influence of the electrical parameters
As mentioned in the previous section, it has been established that the use of pulsed bipolar current (PBC) to supply the electrodes results in a better control of the PEO process, resulting in a higher quality of the coatings in terms of thickness and compactness [20,31,59]. According to Snizhko et al. [32] and Khan et al. [43] the thickness of the coating is increasing with current density. Moreover, in the case of aluminium processing, the increased current density can lead to higher local temperatures and induce transformation to the stable α-alumina phase, which exhibits superior hardness.
In AC or pulsed mode processes, a typical parameter that can be adjusted is also the pulse frequency. Various studies have been conducted on the effect of the input frequency on PEO processing and the resulting coatings [20,34,60,61]. By performing PEO treatments on magnesium samples in pulsed DC mode, Lv et al. [34] and Srinivasan et al. [60] illustrated that the increase in frequency leads to reduction of the surface roughness and improvement of the coating microstructure. However, within low frequencies, the longer pulse duration increases the lifetime of the micro-discharges, leading to higher temperatures which provide better sintering conditions for formation of phases that are not observed in high frequencies. On the other hand, these long lasting micro-discharges are usually detrimental for the coating since they tend to generate large pores throughout the oxide coating. Additionally, they supported that in these conditions, the growth rate is rather increased compared to higher frequencies. Similar result were observed by Zhang et al. [61] on titanium oxide coatings prepared by PEO in DC pulsed mode.
On the other hand, in processes involving aluminium as treated material, Martin et al. [20] investigating the frequency influence within the range of 100 – 900 Hz, showed that the growth rate increases with frequency. Figure I-7 illustrates the effect of the pulse frequency and the current density on the microstructure of the oxide layers at two different locations, the centre and the edge of the sample. Moreover, as can be seen from Fig. I-8, the surface roughness decreases with frequency and increases with current density. This is typically more pronounced at the edges of the sample.
13
Figure I- 7. Cross-section micrographs of aluminium oxide coatings elaborated in various processing conditions: a), b) with j = 12.5 A⸳dm2, f = 100 Hz, t = 100 min, at the centre and edge of the sample respectively, c), d) with Jp = 75.5 A⸳dm2, f = 100 Hz, t = 40 min, at the centre and edge of the sample respectively and e), f) with j = 75.5 A⸳dm2, f = 900 Hz, t = 40 min, at the centre and edge of the sample respectively. [20]
Figure I- 8. Dependence of the roughness of the oxide layer at the centre and the edge of PEO processed samples on a) the current density Jp (for samples processed at f = 100 Hz for t = 70 min and b) the current pulse frequency f (for samples processed with Jp = 75.5 A⸳dm2 for t = 40 min). [20]
14
However, it is worth mentioning that these results were obtained under pulsed bipolar current mode (PBC), in which the negative (cathodic) pulse plays a significant role in the process development. Rogov et al. [62] highlighted the role of the cathodic current in PEO by associating its effect on the electrical double layer (EDL) formed at the oxide-electrolyte interface. By considering the process in terms of potential barriers in the metal-oxide (active zone) and the oxide-electrolyte interfaces, they suggested that the cathodic polarisation could decrease the EDL potential barrier through local acidification of the surface. According to Lukes et al. [63], the potential barrier of the EDL strongly depends on the pH of the electrolyte with respect to the isoelectric point of the surface. This can lead to promotion of discharges during either anodic or cathodic polarisation. More recently, investigation of Nominé et al. [33] in pulsed bipolar mode showed that cathodic discharges can be induced, alongside with the anodic ones, at high frequencies. The nature of these MDs was put in question, as no delamination effect was observed (which is typical of cathodic MDs). However, a potential contribution to the growth rate or facilitation of energy transfer to promote high temperature phases was assumed.
I.3 “Soft” regime
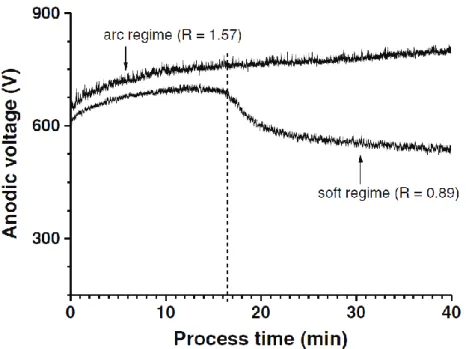
Generally, PEO was associated with micro-discharges which gradually decrease in number and increase in size and with the processing time. This is accompanied with intensification of the MDs and strong acoustic emission, as well as gradual increase of the anodic voltage. However, when operating in PBC mode, it was found that the suitable adjustment of the waveforms of the current pulses, that is the anodic and cathodic amplitudes, the pulse duration and the frequency, can affect significantly the behaviour of the process. Particularly, Mécuson et al. [19] showed that the right control of the ratio of the applied positive to negative charge (RCQ = Qp/Qn) can induces drastic
changes to the process leading to what they called “soft” regime (mentioned also as “soft” sparking regime). The appearance of this regime is mainly conditioned by maintaining the RCQ in the range between 0.8 and 1 and it typically occurs after a certain initial period of time following the conventional PEO “arc” regime. One significant observation that was made is the gradual decrease of the anodic voltage after a certain period of processing time and its stabilisation at lower values (up to 200V lower) (Fig. I-9). In their work, Martin et al. [28] showed that transition to this “soft” regime appears earlier by using higher current density and frequency.
15
Figure I- 9. Variation of anodic voltage amplitude with processing time for two different electrical conditions applied, RCQ = 1.57 and RCQ = 0.89. [35]
Transition to “soft” regime is also accompanied with disappearance of visible MDs that in turn is associated with a decrease in acoustic and light emissions. Indeed, bright MDs tend to disappear and only small dots remains visible in deep darkness. This is particularly obvious in Fig. I-10 that shows the visual aspect of the MDs before (at 30 min) and after (at 45 min) the “soft” regime occurrence. Note that the camera integration time for the last image (Fig. I-10d) is 200 times higher than the previous ones. Moreover, from optical emission spectroscopy, the transition to “soft” regime is also accompanied with the disappearance of all atomic emission lines.
Figure I- 10. Visual aspect of micro-discharges during PEO processing of aluminiun under "soft" regime conditions. [19]
16
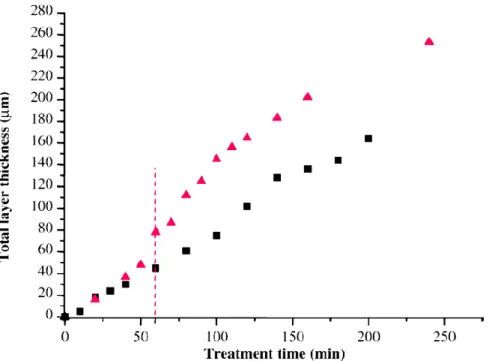
Despite these observations, Mécuson et al. [19] showed that the growth kinetic is enhanced after the transition to “soft” regime. Figure I-11 depicts the thickness dependence on processing time for two conditions: arcing (RCQ = 1.57) and “soft” regime (RCQ = 0.89). At the beginning of the process and until the transition occurs, the growth rate is identical for both electrical conditions and it increases right after the transition, in a rather parabolic way, for “soft” regime conditioned treatment. The “softening” of the micro-discharges has also a beneficial impact on the growing oxide layer, to its microstructure and phase composition, which improve its structural properties, as will be described later in this chapter.
Figure I- 11. Variation of the thickness of aluminium oxide coating with PEO processing time treated in “arcing” (RCQ = 1.57) and "soft" regime conditions. [Reproduction from [19] ]
I.4 Properties of micro-discharges
As the growth of the oxide layers is defined by the nature of the micro-discharges and their properties, it is clear that their characterisation is of paramount importance to understand and optimise the PEO process. Thus, many research teams have focused on studies regarding the physical properties of the micro-discharges, such as electron density and temperature in the plasma, as well as macroscopic characteristics related to their size, lifetime and distribution over the surface. The appearance of micro-discharges on the treated surface is a phenomenon that is constantly evolving during the treatment, as can be seen from Fig. I-2 and Fig. I-10.
17
I.4.1 Spatial characteristics
The spatial characteristics of micro-discharges have been extensively studies by various research teams [20,22,64–67]. Regarding the size of the MDs, in the literature, values have been reported to vary between 35-800 µm in diameter. One should consider that this is strongly affected by the operating mode and the applied electrical conditions. For example, Fig. I-12b illustrates the size evolution with processing time for five different values of charge quantity ratio (RCQ) operated in PBC mode. Similarly, their density is also affected the imposed parameters, as seen in Fig. I-12a. One can notice that although at the beginning of the process all the cases exhibit similar characteristics, the one that is conditioned by a very high ratio (RCQ = 6.0) undergoes drastic changes in the course of the process. The micro-discharges decrease rapidly in number and increase in size.
Figure I- 12. Evolution of a) Surface density and b) average size of the micro-discharges with processing time for PEO treatments with various values of charge quantity ratio (RCQ = Qp/Qn). [67]
I.4.2 Temporal characteristics
Physical observations of the PEO process, typically give the impression that the micro-discharges appear continuously. However, processing in AC mode, time-resolved studies have shown that the appearance of MDs occurs only during the anodic half period [21,68]. Of course this applies to most common PEO treatments in usual electrolytes. Under certain conditions, cathodic discharges may also be present [33,63,69].
Regarding the appearance of the micro-discharges which is accompanied with light emission from the processing surface, Martin et al. [67] conducted a systematic study by synchronised recording of the emitted light with the applied current pulses. They showed that the appearance of MDs is delayed with respect to the rise of the anodic current pulse (Fig. I-13). Moreover, it increases with processing time and is higher for lower values of charge quantity ratio (RCQ) (Fig. I-14).
18
Figure I- 13. Light emission and voltage response to the applied current pulse at various moments of the PEO process. [67]
Figure I- 14. Evolution of delay in the appearance of micro-discharges with processing time for various electrical conditions applied. [67]
Regarding the lifetime of the micro-discharges, time-resolved investigations result in a broad range of values reported in the literature, spanning from few microseconds to some hundreds of milliseconds [20,65,68,70,71]. Mehlem [70], conducting PEO experiments in pulsed bipolar mode at a frequency of 100 Hz, reported MDs duration as low as 8 µs, while Matykina et al. [65] found values as high as 800 ms when operating in DC mode. Typically, at the beginning of the process, the majority of MDs are shorted lived (less than 200 µs), with a very small percentage exceeding a lifetime of 300 µs, as shown in Fig. I-16. However, it should be noted that the detection of very short-lived discharges might be limited by the temporal resolution of the detectors, while in cases of AC operating mode, the micro-discharges are limited by the imposed frequency.
19
Figure I- 15. Distribution of duration of micro-discharges in PEO at processing time t = 1 min in PBC mode at f = 100 Hz and “soft” regime conditions (RCQ = 0.89). [70]
I.4.3 Physical properties of the micro-discharges
Optical emission spectroscopy is a common diagnostic tool that provides information related to the species that are present in the plasma, their (excitation?) state, as well as the electron density and temperature.
Typically, an emission spectrum reveals the presence of species that originate from the processed material and the electrolyte. The elements from the material are present in the plasma in atomic or ionised state. The electrolyte species generally decompose when diluted and provide ions such as oxygen (O+) or hydroxyl radicals (OH). Atomic hydrogen (H) and oxygen (O) are also present
[21,23,38,42,66,72–75]. Fig. I-16 shows a typical emission spectrum obtained at 110 s of oxidation time during PEO process of aluminium 7075 alloy in alkaline electrolyte consisting of potassium hydroxide and sodium metasilicate [75]. Al, Zn, Cu and Mg originate from the substrate, while O, H, Na and OH come from the electrolyte.
Besides the identification of species, optical emission spectroscopy can also give access to quantitative information in the plasma, such as electron density and excitation temperature (Texc).
Moreover, analysis of molecular emission lines can provide values on rotational (Trot) and vibrational
20
equilibrium (TE) or at least in local thermodynamic equilibrium (LTE). Under these conditions, the excitation temperature is considered to be representative of the electron temperature (Te).
The reported values of electron temperature in literature range between Te = 3500 – 33000 K
[38,70]. For example, Jovovic et al. [38] conducting PEO processing on aluminium alloy, determined the electron temperature of Te ≈ 4000 K using Mg I lines, while the corresponding value from O II
lines was found to be Te ≈ 33000 K. Yang et al. [75] investigated the variation of electron temperature
with PEO processing time by measuring the relative intensities of Al I lines and found it to range between Te = 3000 – 15000 K. Stojadinovic et al. [73] calculated the rotational temperature using the
emission lines of MgO, AlO and OH and reported the values of Trot = 11000 K , Trot = 8000 K and
Trot = 3500 K, respectively.
Figure I- 16. Typical emission spectrum during PEO of aluminium alloy. [38]
Such discrepancies in the reported values, reflects a probable deviation from the thermodynamic equilibrium and can, at best, correspond to partial local thermodynamic equilibrium limited to each species.
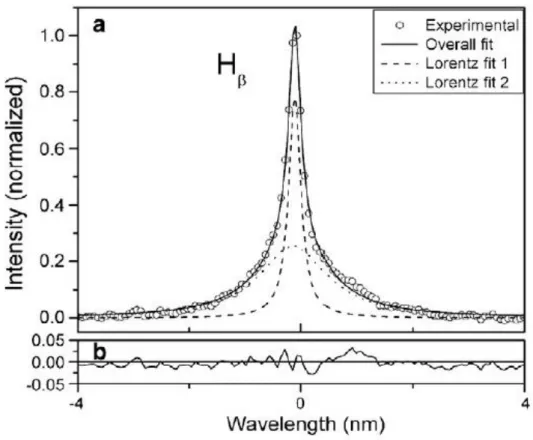
The electron density is determined by the analysis of the broadening of a given emission line, particularly from the contribution of the Stark broadening. This is done by interpolation of the
21 experimental profile with a mathematical function (Gauss, Lorentz, Voigt) and extraction of the component due to Stark effect.
Among others, hydrogen is the most frequent element used to determine the electron density [21,38,72,76]. However, interpolation of the experimental profile of these lines is done by using two functions, as it was found that adjustment with one single function is not satisfactory. This leads to two different values of FWHM, resulting to corresponding two values of electron densities (Fig. I-17). Non-hydrogenic species (e.g. Al, Al+) originating from the substrate can be also used for the determination of electron density. In this case the fitting process does not involve such issues and can be resolved by the use of only one function. In the literature, the reported values of electron density range between Ne = 1⸳1015 - 5⸳1017 cm-3 [21,23,38,42,66,72–74,76].
Figure I- 17. Interpolation of Hβ emission line from PEO processing of tantalum with two lorentian functions. [66]
I.5 Structural properties of PEO oxide coatings
The oxide coatings that are formed with PEO processing typically exhibit a multilayer structure consisting of 3 distinct sublayers. A porous outer layer, which consist usually of low temperature phases, a dense inner layer, formed by high temperature modifications, and a thin oxide layer of few hundred nanometres that is formed at the interface with the metal substrate below the dense layer
22
[3,7,77]. This is usually called “barrier” layer. Figure I-18 illustrates cross-section image of typical PEO coating depicting the multi-layered structure. The relative size of the dense and porous region is generally affected by the substrate and electrolyte composition and the applied electrical conditions [3].
Figure I- 18. Cross-section SEM micrograph of PEO coating produced on Al substrate, depicting a) the two main sublayers [19] and b) the barrier layer located at the oxide/substrate interface [78].
Depending on the processing conditions, a variety of surface morphologies can be observed. Fast solidification processes lead to the so-called “pancake”-like structures [44,79] (Fig. I-19a, b) on the surface. These can be either completely closed or exhibiting open cavities in the centre of the pancake. According to Sundararajan et al. [79], they are the result of discharges that took place at this location and as the molten alumina was ejected through the discharge channel, it was solidified around it, forming the pancake-like structure. Usually micro-cracks appear on these “pancakes”, as a result of internal stresses [80–83]. Moreover, nodular structures of various sizes can be present (Fig.I-19c, d). Intense micro-discharges, can also sometimes lead to crater-like structures. The surface roughness reported for aluminium oxide coatings ranges between Ra = 0.75 – 7 µm [20,31,84] and depends on
processing conditions (AC/DC mode, frequency, electrolyte composition) and also on the geometry of the sample, as edge effects can lead to preferential discharge-sites and inhomogeneous growth [35].
23
Figure I- 19. SEM micrographs of the surface morphology of aluminium oxide coatings PEO processed in four different electrolytes depicting various morphological characteristics of the surface. [44]
Typically, aluminium oxide coatings produced by PEO exhibit complex microstructure. Due to rapid solidification processes, some regions may be quenched by the electrolyte at very high rates, producing amorphous phases, while others, at the vicinity of the discharges may have effectively been heat treated, leading to high crystallisation. This leads to formation of transition phases, such as γ-, η- or δ-Al2O3 and α-Al2O3 phase [3,4,7,85,86]. The α-alumina is more desirable since it is the most
stable phase and it exhibits increased hardness compared to the other phases. In coatings formed from coper rich aluminium alloys, the content of the α-phase can reach up to 60% [3]. Tillous et al. [7] showed that the α-phase of alumina is mainly located at the intermediate dense layer of the coating, where it reaches its maximum content. In addition, some complex phases might be also present in the outmost porous layer, due to incorporation of elements from the electrolyte, such as silicon, potassium, sodium. In silicate rich electrolytes this usually leads to the formation of various mullite (Al-Si-O) phases, which can serve as thermal barriers as they exhibit much lower thermal conductivity compared to the bulk crystalline material [6,87].
24
PEO coating are considered generally porous. However, their overall porosity levels may range from less than 5% to more than 30% [88–90], depending on the elaboration parameters. As seen in Fig. I-18a and Fig. I-19, these pores are typically within the micrometre scale and located mainly at the outer sublayer. Fig. I-20 illustrates the porosity distribution obtained from X-ray microtomography for two coating produced on pure aluminium and on the 2214-T6 aluminium alloy [84]. Nevertheless, Curran et al. have reported the existence of nanometre size surface connected network of porosities that reaches until the substrate/oxide interface [91]. Galvis et al. [92] and Han et al. [93] investigated highly porous titania coatings, reporting an average pores size of 1-1.7 µm in diameter.
Figure I- 20. Porosity distribution in PEO coatings of a) pure aluminium and b) 2214-T6 aluminium alloy produced in PBC mode at f = 100 Hz.[84]
I.6 Growth mechanisms
The growth of oxide layers during PEO is the result of complex and concomitant mechanisms involving matter in plasma state which is confined in very small volumes, high pressure and temperature conditions and interactions with liquid environment. Besides PEO, discharges in and in contact with liquids are of interest to many other domains (e.g. medical use and chemical analysis of liquids) and their rather complex ignition mechanisms are studied intensively [94–96]. However, in PEO processing, clear relationship between the process parameters, the properties of the micro-discharges and the coating growth has not yet been established.
Generally, the suggested mechanisms can be divided in to two groups: those that describe the oxidation process of the metal under electrical discharge conditions [18,79,97–100] and those that describe the dielectric breakdown processes of the insulating coating when surrounded with conductive liquid and under electric polarisation [23,64,101–105].
In the first group, based on the gas steam vial model, Klapkiv [98] suggested a single discharge model with a core-shell structure (Fig. I-21). According to this model, the plasma temperature and
25 electronic density exhibit a gradient. Consequently, the elements that constitute the plasma vary depending on the different zones and thus, different reactions take place for the formation of aluminium oxide. Under such conditions of high temperature and pressure, Sundararajan et al. [79] showed that the molten material is ejected through the discharge channel, oxidised, rapidly solidified and deposited on the surface, promoting the growth of the oxide layer.
Figure I- 21. Schematic representation of the alumina formation in the discharge channel. [98]
For Yerokhin et al. [18], two simultaneous mechanisms of the metal oxidation take place through the discharge channels including a plasma-assisted oxidation and an electrochemical-assisted oxidation. More recently, by using 18O isotope tracers through PEO coatings, Matykina et al. [100]
concluded that migration of oxygen is the result of two concomitant mechanisms, i.e. one by the solid-state diffusion of oxygen and another due to water molecules trapped in cavities which, within the plasma, decompose and form ions and radicals.
For the second group of mechanisms, Hussein et al. [23] suggested a multi-discharge model including three types of discharges igniting at several locations and at different times through the coating thickness:
A-type discharges that appear on the fine impurities located on the top surface of the coating
B-type discharges that cross the overall thickness of the coating
26
Based on optical emission spectroscopy measurements, Jovović et al. [102] were able to confirm these three types of discharges. Using a silicate-based electrolyte, Dehnavi et al. [103] established that A-type discharges are caused by the presence of silicon anions adsorbed on the topmost surface of the growing oxide layer.
Figure I- 22. Schematic representation of the multi-discharge model.[104]
Later, Cheng et al. [104] enriched Hussein’s model (Fig. I-22) by including D- and E-type discharges in order to explain the typical morphology of the PEO coatings, i.e. the presence of an outer porous sublayer filled with electrolyte and an inner dense sublayer, as will be described in next section. D-type discharges are assumed to take place in large cavities inside the growing oxide layer and are considered to be responsible for the formation of the compact inner layer, while the E-type traverse partially the outer porous sublayer of the coating. Recent work of Wu et al. [78], investigating the coating/substrate interface, illustrate the formation of protrusions on the oxide that develop towards the substrate, suggesting an inward growth during the PEO process.
I.7 Conclusions of Chapter I
This chapter introduced the main principles of the plasma electrolytic process, highlighting its advantages over the conventional processes used until now. A brief documentation of the work and progress that has been done to the present day was summarised. As described, PEO is a complex procedure, in which a multitude of reactions and phenomena take place under high potential. Although great progress has been achieved, the knowledge regarding the fundamental principles that drive the process and define the coating growth is still limited. The “soft” regime, though commonly
27 admitted to enhance and improve the resulting coating, is still not well understood in terms of what are the factors that induce the transition into this regime and how does this alter the growth of the coating. A deeper understanding is necessary for both the optimisation of the process as well as the reduction in energy consumption to facilitate a potential large scale industrial use.
The work of this thesis aims to contribute to a better understanding of the PEO process by:
investigating the nature and behaviour of the micro-discharges under various electrical regimes, particularly in connection to their appearance during the anodic pulse and establish a correlation between the electrical parameters, the coating’s micro-structure and the ignition of micro-discharges.
studying of the micro-discharges during the “soft” regime and investigating their interactions with the surrounding environment above the discharge channel by means of high speed video.
Experimenting with various parameters, such as the substrate and the electrolyte composition, and their influence on the processing characteristics (electrical and optical).
Regarding the micro-structural properties of the PEO coatings elaborated in “soft” regime conditions, a detailed and in depth multi-scale investigation of the “pancake” cavity structure is performed to explain the presence of a particular lamellar arrangement.
Finally, new opportunities and possibilities are sought through the investigation of potential metallic oxide micro- and nano-particles production during PEO processing. Additionally, an attempt for a duplex procedure involving the combination of cold spray and the PEO process is made to elaborate protective coatings on unconventional substrates.
29
Chapter II - Experimental considerations
II.1 Introduction of the chapter II
This chapter provides a description of the experimental set-up used in this study, as well as details about the different techniques used to in situ characterise the PEO process and to ex situ characterise the microstructure of the produced coatings.
II.2 Experimental installation
As illustrated in Fig. II-1, the PEO treatment unit mainly consists of an electrolytic cell, an electrical generator controlled by a computer and the electrodes. In addition, Fig. II-1b provides a schematic illustration of the set-up with the main equipment used for the in situ characterisation of the PEO process. These main parts are detailed in the following sections.
Figure II-1. a) Picture of the PEO treatment unit and b) schematic illustration depicting the set-up with the equipement used for the in situ characterisation.
II.2.1 The electrical generator
The electrodes are supplied by using a current generator (Ceratronic®) working in a current-controlled galvanostatic mode and operated via Cockpit Ceratronic v.1.5 software. In this mode, the current is applied to the electrodes while the voltage is continuously adapted according to the oxide growth. In addition, the generator provides the possibility to supply the electrodes with a pulsed bipolar current where all the waveform parameters over one pulse period can be adjusted in a wide range [106]. Indeed, by using a computer-controlled environment, this can be done by not only
30
adjusting the amplitude and the frequency of the current pulses, but also all the temporal parameters related to the bipolar waveforms (Ti). A schematic description of the bipolar waveform is depicted in
Fig. II-2. All time and amplitude parameters are adjustable within ranges according to Table II-1. By this way, the anodic and the cathodic charge quantities (Qi in fig. II-2) that are delivered to the
electrodes, and thus, their ratio (RCQ = Qp/ Qn) can be controlled. As previously reported in the
literature, this ratio of the charge quantities is crucial for both the growth kinetics and the microstructure of the producing oxide layer [19].
Figure II-2. Schematic illustration of a current waveform applied in the present study.
Mainly, the amplitude of the anodic and the cathodic currents is provided in the range of [5 – 35 A] and the available pulse frequencies are in the range of [100 – 1000 Hz] [107]. For the different investigations conducted in this work, various electrical conditions were used. In order to avoid confusion, details on the different electrical parameters used will be given at the beginning of each chapter.
31
Table II-1. Technical specifications of the electrical generator CERATRONIC®.
Parameter Definition Min Max
Ip (A) Amplitude of positive current 5 35
In (A) Amplitude of negative current (defined by R) 5 35
R (%) Ratio of In/Ip 1 250
F (Hz) Frequency 100 1000
T1 (µs) Current rising duration of positive pulse 300 T = ΣTi
T2 (µs) Duration of maximum current of the positive pulse 100 T = ΣTi
T3 (µs) Current decrease duration of positive pulse 100 T = ΣTi
T4 (µs) Dead time 100 T = ΣTi
T5 (µs) Current rising duration of negative pulse 100 T = ΣTi
T6 (µs) Duration of maximum current of the negative pulse 100 T = ΣTi
T7 (µs) Current decrease duration of negative pulse 100 T = ΣTi
T8 (µs) Dead time 100 T = ΣTi
II.2.2 The electrolytic cell
The PEO experiments were conducted in a rectangular tank made of a PVC polymeric material Dimensions of the tank were 300 mm 400 mm 300 mm which represents a volume capacity less than 36 L. Two glass windows located on opposite sides allow the observation and the study of the processed samples using different optical diagnostic techniques. As illustrated in Fig. II-1, a cooling system allows maintaining the electrolyte temperature at a constant value of 27 °C 3 °C. By using a hydraulic pump, the electrolyte is circulated in a closed circuit through a heat exchanger. In turn, the heat exchanger is connected to a secondary closed cooling water circuit of the laboratory where the temperature is maintained below 15 °C. The circulation of the electrolyte also allows agitating the electrolyte which ensures its chemical homogeneity during the process. PEO treatments were performed in alkaline conductive electrolytes (pH in the range of [12 - 12.5] and conductivity in the range of [2.5 - 6.5] mS⸱m-1 depending on the chemical species dissolved). These electrolytes were prepared by using various chemical components dissolved in deionised water. For the present study, the following chemical compounds were mainly used in different concentration:
Potassium hydroxide [KOH], [1 - 2] g⸱L-1 = [17.8 - 35.6] mMol⸳L-1
Anhydrous sodium silicate [Na2SiO3], [1.65 - 10] g⸱L-1 = [13.5 - 82] mMol⸳L-1
32
From a practical point of view, each electrolyte was prepared by mixing the deionised water with the required chemical compounds in a 4 litre beaker and applying magnetic stirring until the salts were completely dissolved and the mixture was homogeneous. A total of 25 litres was used to fill the electrolytic tank. To ensure reproducibility of the results and to avoid any ageing effect, the electrolyte was frequently replaced with a fresh one. Finally, details on the different electrolytes used in this study will be given at the beginning of each chapter.
II.2.3 The electrodes
The electrodes used in the PEO process consist of a working electrode and two counter electrodes. The working electrode is made of the metal to be protected by the growth of a PEO oxide layer and located between two metallic counter electrodes. In the present study, various substrates were used as working electrodes. Alloys of aluminium Al 2024 and Al 1050 were mainly used. Their chemical composition is reported in Table II-2. All the samples were cut in rectangular shapes (50×30×5 mm) providing a processing surface of ~0.38 dm2. Additionally, some other materials were also processed such as zirconium (M5), pure titanium and in specific case a low carbon steel (presented in chapter VI). The detailed composition of these materials as well as their geometry will be given in the dedicated chapter.
Table II - 2. Chemical composition of aluminium alloys employed in the current study.
Elements (wt%) Cu Mg Mn Si Fe, Ti, Zn Al
Al 1050 0.05 0.05 max 0.05 max 0.25 max <0.5 Balance
Al 2024 3.8-4,9 1.3-1.5 0.5-0.6 0.5 max <0.5 Balance
Concerning the counter-electrodes, and whatever the different treatment conducted in this study, two rectangular titanium plates of 200 mm × 200 mm × 1 mm in dimensions are used. The two plates are symmetrically set to face both sides of the processed sample at an adjustable distance and maximize the homogeneity of the electric field at the surface of the working electrode. For all the experiments, the distance between the counter electrodes and the working electrode was fixed at 90 mm.
![Figure I- 2. Evolution of visual aspect of micro-discharges with PEO processing time [19]](https://thumb-eu.123doks.com/thumbv2/123doknet/14721242.751191/19.892.217.669.120.483/figure-evolution-visual-aspect-micro-discharges-peo-processing.webp)
![Figure I- 3. Current variation under potentiostatic supplying mode where a constant voltage is applied during the process [14]](https://thumb-eu.123doks.com/thumbv2/123doknet/14721242.751191/20.892.178.705.217.507/figure-current-variation-potentiostatic-supplying-constant-voltage-applied.webp)


![Figure I- 18. Cross-section SEM micrograph of PEO coating produced on Al substrate, depicting a) the two main sublayers [19] and b) the barrier layer located at the oxide/substrate interface [78]](https://thumb-eu.123doks.com/thumbv2/123doknet/14721242.751191/34.892.96.808.257.524/figure-micrograph-produced-substrate-depicting-sublayers-substrate-interface.webp)
![Figure I- 20. Porosity distribution in PEO coatings of a) pure aluminium and b) 2214-T6 aluminium alloy produced in PBC mode at f = 100 Hz.[84]](https://thumb-eu.123doks.com/thumbv2/123doknet/14721242.751191/36.892.100.797.414.593/figure-porosity-distribution-coatings-aluminium-aluminium-alloy-produced.webp)