Choreo: network-aware task placement for cloud applications
The MIT Faculty has made this article openly available.
Please share
how this access benefits you. Your story matters.
Citation
Katrina LaCurts, Shuo Deng, Ameesh Goyal, and Hari Balakrishnan.
2013. Choreo: network-aware task placement for cloud applications.
In Proceedings of the 2013 conference on Internet measurement
conference (IMC '13). ACM, New York, NY, USA, 191-204.
As Published
http://dx.doi.org/10.1145/2504730.2504744
Publisher
Association for Computing Machinery (ACM)
Version
Author's final manuscript
Citable link
http://hdl.handle.net/1721.1/85949
Terms of Use
Creative Commons Attribution-Noncommercial-Share Alike
Choreo: Network-Aware Task Placement for Cloud
Applications
Katrina LaCurts, Shuo Deng, Ameesh Goyal, Hari Balakrishnan
MIT Computer Science and Artificial Intelligence Lab Cambridge, Massachusetts, U.S.A.
{katrina, shuodeng, ameesh, hari}@csail.mit.edu
ABSTRACT
Cloud computing infrastructures are increasingly being used by network-intensive applications that transfer significant amounts of data between the nodes on which they run. This paper shows that tenants can do a better job placing applications by understanding the underlying cloud network as well as the demands of the appli-cations. To do so, tenants must be able to quickly and accurately measure the cloud network and profile their applications, and then use a network-aware placement method to place applications. This paper describes Choreo, a system that solves these problems. Our experiments measure Amazon’s EC2 and Rackspace networks and use three weeks of network data from applications running on the HP Cloud network [15]. We find that Choreo reduces application completion time by an average of 8%–14% (max improvement: 61%) when applications are placed all at once, and 22%–43% (max improvement: 79%) when they arrive in real-time, compared to alternative placement schemes.
C
ATEGORIES ANDS
UBJECTD
ESCRIPTORS C.4 [Performance of Systems]: Measurement TechniquesK
EYWORDSApplication Placement, Bottlenecks, Cloud Computing, Cross Traf-fic, Datacenters, Measurement, Throughput
1.
I
NTRODUCTIONA significant number of applications that run on cloud computing infrastructures are network-intensive, transferring large amounts of data between machines. Examples include Hadoop jobs [12], analytic database workloads, storage/backup services, and scientific or numerical computations (see http://aws.amazon.com/ hpc-applications). Such applications operate across dozens of machines [31], and are deployed on both public cloud providers such as Amazon EC2 and Rackspace, as well as enterprise datacen-ters (“private clouds”).
The performance of such applications depends not just on com-putational and disk resources, but also on the network throughput between the machines on which they are deployed. Previous re-search [4, 11] has shown that the datacenter network is the limiting
Permission to make digital or hard copies of all or part of this work for personal or classroom use is granted without fee provided that copies are not made or distributed for profit or commercial advantage and that copies bear this notice and the full cita-tion on the first page. Copyrights for components of this work owned by others than ACM must be honored. Abstracting with credit is permitted. To copy otherwise, or re-publish, to post on servers or to redistribute to lists, requires prior specific permission and/or a fee. Request permissions from [email protected].
IMC’13,October 23–25, 2013, Barcelona, Spain. Copyright 2013 ACM 978-1-4503-1953-9/13/10 ...$15.00. http://dx.doi.org/10.1145/2504730.2504744.
factor for many applications. For example, the VL2 paper reports that “the demand for bandwidth between servers inside a datacenter is growing faster than the demand for bandwidth to external hosts,” and that “the network is a bottleneck to computation” with top-of-rack (ToR) switches frequently experiencing link utilizations above 80% [11].
Much previous work has focused on better ways to design data-center networks to avoid hot spots and bottlenecks. In this paper, we take a different approach and ask the converse question: given a network architecture, what is the impact of a network-aware task placement method on end-to-end performance (e.g., application completion time)? Our hypothesis is that by measuring the inter-node rates and bottlenecks in a datacenter network, and by profiling applications to understand their data transfer characteristics, it is possible to improve the performance of a mix of applications.
A concrete context for our work is a tenant (an organization paying for computing resources) of a cloud computing provider with a set of network-intensive cloud applications. To run these applications, the tenant requests a set of virtual machine (VM) instances from the cloud provider; to contain costs, the tenant is thrifty about how many VMs or instances it requests. When it gets access to the VMs, the tenant now has a decision to make: how should the different applications be placed on these VMs to maximize application performance? A common tenant goal is to minimize the run-time of the application.
For network-intensive applications, an ideal solution is to map an application’s tasks to the VMs taking the inter-task network demands as well as the inter-VM network rates into consideration. We use “tasks” as an intuitive term: a task may map to a collection of processes in an application, for instance a map or reduce task during a MapReduce job. As a simple example, suppose an application has three tasks, S, A, and B, where A and B communicate often with S, but not much with each other. If we are given three VMs (in general on different physical machines) and measure the network rates between them to be different—say, two of them were higher than the third—then the best solution would be to place S on the VM with the highest network rates to the other two VMs. By not taking the performance of the underlying network into account, applications can end up sending large amounts of data across slow paths, while faster, more reliable paths remain under-utilized. Our goal is to build on this insight and develop a scalable system that works well on current cloud providers.
This paper makes two contributions. The first is a network-aware placement system, called Choreo, which tenants can use to place a mix of applications on a cloud infrastructure. Choreo has three sub-systems: a low-overhead measurement component to obtain inter-VM network rates, a component to profile the data transfer characteristics of a distributed application, and an algorithm to
map application tasks to VMs so that tasks that communicate often are placed on VMs with higher rates between them. These sub-systems must overcome four challenges: first, inter-VM network rates are not constant [6]; second, cloud providers often use a “hose model” to control the maximum output rate from any VM; third, any practical measurement or profiling method must not introduce much extra traffic; and fourth, placing a subset of tasks changes the network rates available for subsequent tasks. Moreover, an optimal placement method given the network rates and application profile is computationally intractable, so any practical approach can only be approximate. To the best of our knowledge, the problem of matching compute tasks to nodes while taking inter-VM network properties into account has not received much prior attention.
The second contribution is an evaluation of how well Choreo performs compared to other placement methods that do not consider network rates or inter-task communication patterns. We collect network performance data from Amazon’s EC2 and Rackspace, as well as application profiles from the HP Cloud [15], to evaluate Choreo. We find that it is possible to use packet trains to estimate TCP throughput within a few minutes for 90 VM pairs. We find that Choreo can reduce the average running time of applications by 8%–14% (max improvement: 61%) when applications are placed all at once, and 22%–43% (max improvement: 79%) when applica-tions arrive in real-time, compared to alternative placement methods on a variety of workloads. These results validate our hypothesis that task mapping using network measurements and application communication profiles are worthwhile in practice.
2.
C
HOREOChoreo has three sub-systems, which perform three distinct jobs: (1) profile the tenant’s application tasks, (2) measure the perfor-mance of the network between the VMs allotted by the cloud provider, and (3) place and monitor application tasks.
2.1 Profiling Applications
Choreo uses a network monitoring tool such as sFlow or tcpdumpto gather application communication patterns. Choreo assumes that by profiling an application offline (during a testing phase or in production for long-running services), it will have rea-sonably accurate knowledge of the application’s communication pattern online. For batch computations, this assumption may be rea-sonable because the relative amounts of data sent between different application tasks might not change dramatically between testing and production; on an encouraging note, some previous work suggests that application traffic patterns are predictable [4]. The dataset we use for our evaluation (see Section 6.1) justifies this assumption; in this dataset, we found that data from the previous hour and the time-of-day are good predictors of the number of bytes transferred in the next hour.
Choreo models the inter-task network needs of an application by profiling the number of bytes sent, rather than the rate observed. The reason is that the network rate achieved depends on what else is going on in the network, whereas the number of bytes is usually independent of cross-traffic in cloud applications.
The output of the application profiling step is a matrix whose rows and columns are the application’s tasks, where each entry Ai j
is a value proportional to the number of bytes sent from task i to task j.
2.2 Measuring the Network
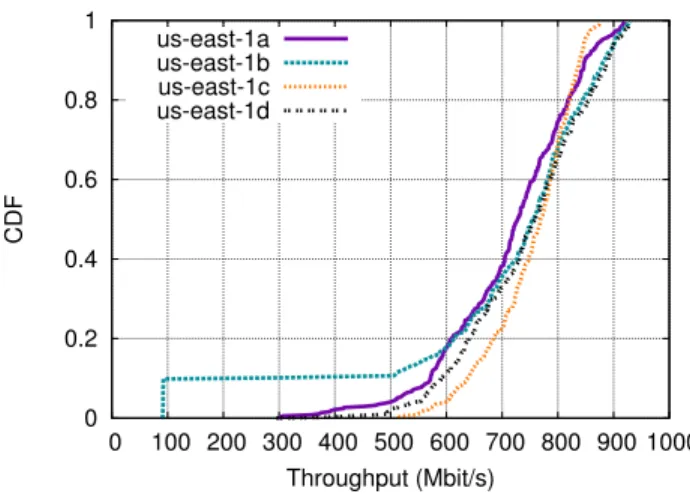
Choreo measures the network path between each pair of VMs to infer the TCP throughput between them. When we started this project over a year ago, we found that the TCP throughput between the VMs obtained on Amazon’s EC2 was highly variable, as shown
0 0.2 0.4 0.6 0.8 1 0 100 200 300 400 500 600 700 800 900 1000 CDF Throughput (Mbit/s) us-east-1a us-east-1b us-east-1c us-east-1d
Figure 1: TCP throughput measurements on Amazon EC2 taken roughly one year ago, in May, 2012. Each line represents data from a different availability zone in the US East datacen-ter. Path throughputs vary from as low as 100 Mbit/s to almost 1 Gbit/s.
in Figure 1. Over the past few months, however, we have observed a significant change in how EC2 (and Rackspace) manage their internal bandwidth.
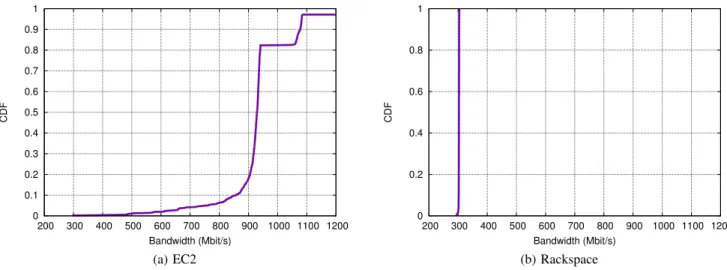
To measure spatial stability, we used 19 10-instance topologies made up of medium Amazon EC2 instances, and 4 10-instance topologies made up of 8-GByte Rackspace instances. For each of the paths in a given topology, we measured the TCP throughput on the path by running netperf for 10 seconds. This method gives us 1710 data points in total across the 19 topologies for EC2, and 360 data points for Rackspace. Figure 2 shows a CDF of the throughputs we observed on the instances in both networks. In EC2 (Figure 2(a)), although the CDF shows a large range of spatial variability, with throughputs ranging from 296 Mbit/s to 4405 Mbit/s, most paths (roughly 80%) have throughputs between 900 Mbit/s and 1100 Mbit/s (the mean throughput is 957 Mbit/s and the median is 929 Mbit/s). Not shown on the CDF are 18 paths that had extremely high throughput (near 4 Gbit/s). We believe that most of these paths were on the same physical server (see Section 4.2). Because all of these measurements were taken at roughly the same time, we can conclude that the variability in 20% of the paths is not strictly a function of the time of day.
Another interesting feature of Figure 2(a) is the distinct knees around 950 Mbit/s and 1100 Mbit/s. We suspect that this is partly due to a correlation between path throughput and path length; see Section 4.2.
In Rackspace (Figure2(b), there is very little spatial variation. In fact, every path has a throughput of almost exactly 300 Mbit/s, which is the advertised internal network rate for the 8 GByte Rackspace instances.1 This implies that if a tenant were placing a single ap-plication on the Rackspace network, there would be virtually no variation for Choreo to exploit. However, Choreo is still effective in this type of network when a tenant is placing multiple applications in sequence, as traffic from existing applications causes variations in available throughput (Section 6.3).
In all our experiments, we have found that both of these networks are rate-limited and implement a hose model [10] to set a maximum outgoing rate for each VM. Figures 2(a) and 2(b) give evidence for such rate-limiting, as the typical throughput for a path remains close
0 0.1 0.2 0.3 0.4 0.5 0.6 0.7 0.8 0.9 1 200 300 400 500 600 700 800 900 1000 1100 1200 CDF Bandwidth (Mbit/s) (a) EC2 0 0.2 0.4 0.6 0.8 1 200 300 400 500 600 700 800 900 1000 1100 1200 CDF Bandwidth (Mbit/s) (b) Rackspace
Figure 2: TCP throughput measured in May, 2013 on 1710 paths for EC2 and 360 paths for Rackspace. We see some variation on EC2, but less than in Figure 1. Rackspace exhibits almost no spatial variation in throughput.
to a particular value for each network (1 Gbit/s for EC2, 300 Mbit/s for Rackspace). We develop techniques to confirm both of these hypotheses in Section 3, and verify them on EC2 and Rackspace in Section 4.3.
Our approach to estimating TCP throughput in these figures was to use netperf, but this approach induces significant overhead for online use. Choreo must also measure the network quickly, so that applications can be placed in a timely manner. Moreover, if Choreo’s measurement phase takes too long, there is a chance the network could change between measurement time and placement (we discuss the temporal stability of public cloud networks in Section 4.1).
To overcome this issue, Choreo uses packet trains to measure available throughput. We discuss this method, as well as Choreo’s methods for assessing rate limits and bottlenecks, in Section 3. Briefly, packet trains allow Choreo to get a snapshot of the network within just a few minutes for a ten-node topology, including the overhead of retrieving throughput measurements from each machine back to a centralized server.
2.3 Placing Applications
Once the network has been measured and the application profiled, Choreo must place each application’s tasks on the network. In the Appendix, we show how to formulate the problem of task placement as an integer linear program (ILP). Because solving ILPs can be slow in practice, we develop a greedy placement algorithm that takes far less time to run, and in practice gives near-optimal results (see Section 5).
2.4 Handling Multiple Applications
A tenant may not know all of the applications it needs to run ahead of time, or may want to start some applications after others have begun. To run a new application while existing ones are running, Choreo re-measures the network, and places its tasks as it would normally (presumably there is more variation in the network in this case, because existing applications create cross traffic). It is possible, however, that placing applications in sequence in this manner will result in a sub-optimal placement compared to knowing their demands all at once. For that reason, every T minutes, Choreo re-evaluates its placement of the existing applications, and migrates tasks if necessary. T can be chosen to reflect the cost of migration; if migration is cheap, T should be smaller. This re-evaluation also allows Choreo to react to major changes in the network.
3.
M
EASUREMENTT
ECHNIQUESChoreo’s primary function is placing application tasks on a set of VMs. To do this, it needs to know three things. First, the available throughput on each path, which tells Choreo what the throughput of a single connection on that path is. Second, the amount of cross traffic in the network, which tells Choreo how multiple connections on the same path will be affected by each other. For instance, if one connection gets a throughput of 600 Mbit/s on a path, it is possible that two connections on that path will each see 300 Mbit/s—if they are the only connections on a path with link speed of 600 Mbit/s— or that they will each see 400 Mbit/s—if there is one background TCP connection on a path with a link speed of 1200 Mbit/s. Third, which paths share bottlenecks, which tells Choreo how connections between different pairs of VMs will be affected by each other. For instance, knowing that A; B shares a bottlenecks with C ; D informs Choreo’s estimated rate of a new connection on A; B when connections exist on C; D.
3.1 Measuring Pair-Wise Throughput
The first measurement that Choreo does is to estimate the pairwise TCP throughput between the cloud VMs, to understand what the throughput of a single connection will be. Estimating the pairwise TCP throughput between N VMs by running bulk TCP transfers takes a long time for even modest values of N. Packet trains, orig-inally proposed in [18] and also used in [7], have been adapted in various ways, but with only varying success over Internet paths [27, 28]. The question is whether more homogeneous and higher-rate cloud infrastructures permit the method to be more successful.2
Choreo’s measurement module sends K bursts of P-byte UDP packets, each burst made up of a sequence of B back-to-back packets. Bursts are separated by δ milliseconds to avoid causing persistent congestion. This collection of K bursts is one packet train; to estimate throughput on a path, we send only one packet train on that path.
At the receiver, the measurement module observes the kernel-level timestamps at which the first and last packet of each burst biwas
received using the SO_TIMESTAMPNS socket option, and records this time difference, ti. If either the first or last packet of a burst is 2In our experiments, “packet pairs”, in which only two packets
are sent, were not very accurate on any cloud environment, and so Choreo does not use that method.
S1 S2 S10 R1 R2 R10
...
...
(a) Simple topology. All links are 1 Gbit/s.
S1 S2
...
S10 ToRR1 R2
...
R10 ToR A(b) Cloud topology. Links between sender/receiver nodes and ToR switches are 1 Gbit/s, and links between ToR switches and the aggregate switch (labeled “A”) are 10 Gbit/s.
Figure 3: ns-2 simulation topologies for our cross traffic method. The dashed lines are bottlenecks where cross traffic will interfere.
lost (which we can determine via the sequence numbers we inserted into the UDP payload), we adjust tito take into account what the
time difference should have been, by calculating the average time it took to transfer one packet and adjusting for the number of packets missing from the beginning or end of the burst. We also record the number of packets received in each burst, ni≤ B.
Using this data, we estimate the bulk TCP throughput as
P·∑K
i=1ni
∑Ki=1ti .
This throughput estimate is equivalent to estimating the through-put asP(N−1)(1−`)T , where N is the number of packets sent, ` is the packet loss rate, and T is the time between the receipt of the first packet and the last packet. An alternative method for estimating TCP throughput is to use the formula MSS·C
RT T·√`, where C is the
con-stant of proportionality, roughlyp
3/2[23]. This formula, however, is an upper-bound on the actual throughput, and departs from the true value when ` is small, and is not always useful in datacenter networks with low packet loss rates. Our estimator combines these two expressions and estimates the throughput as:
min {P(N−1)(1−`)/T,MSS·C/RT T·√`}.
Section 4.1 evaluates this method on EC2 and Rackspace.
3.2 Estimating Cross Traffic
The second measurement that Choreo makes is to estimate cross traffic on the network, to understand how multiple connections on the same path will be affected. As part of this task, Choreo also needs to understand how the cross traffic on a path varies over time; e.g., does the number of other connections on a path remain stable, or does it vary significantly with time?
To estimate the “equivalent” number of concurrent bulk TCP connections along a path between two VMs, we send one bulk TCP connection between two instances (e.g., using netperf), run it for ten seconds, and log the timestamp of each receiving packet at
0 5 10 15 20 0 2 4 6 8 10 c Time (sec) Actual Estimated
(a) Simulation results for c < 10 on a simple topology.
0 5 10 15 20 0 2 4 6 8 10 c Time (sec) Actual Estimated
(b) Simulation results for c ≥ 10 on a more realistic cloud topology.
Figure 4: ns-2 simulation results for our cross traffic method. We are able to quickly and accurately determine the number of background connections, particularly for small values of c, even when the number of background connections changes rapidly.
the receiver. This method allows us to measure the throughput of the connection every 10 milliseconds. Given the maximum path rate, the throughput of our connection should indicate how many other connections there are. For instance, if the path rate is 1 Gbit/s, and our connection sees 250 Mbit/s of throughput, then there is the equivalent of three other bulk TCP connections on the path. In general, if the path rate is c1, and our connection gets a throughput
of c2≤ c1, then there are c =c1/c2− 1 other bulk connections on the
path. We measure the throughput frequently to account for the fact that background connections may come and go.
In this method, we have made a few assumptions: first, that we know the maximum rate of the path; second, that TCP divides the bottleneck rate equally between bulk connections in cloud networks; and third, that the background connections are backlogged, sending as fast as possible. In public clouds, it is not hard to obtain a maximum link rate (e.g.., it is usually 1 Gbit/s today on EC2) using simple measurements or because the provider advertises it (e.g., Rackspace). If the maximum rate is unknown, however, then we can solve this problem by sending one connection on the path, and then two connections; the change in the throughputs will allow us to estimate c.
For the second assumption, we ran netperf on the EC2 network and observed that when one connection could obtain 1 Gbit/s of bandwidth (the maximum rate), the rate did decrease by roughly 50% when we added a second connection. This result is unsurprising, given the homogeneity of cloud networks, and the fact that both connections were capable of sending at the maximum rate.
As for the third assumption, our method of estimating c also gives us a reasonable estimate of how throughput will be affected in many cases even when the other connections are not backlogged. For instance, if there is one background connection on a 1Gbit/s link that has an offered load of only 100 Mbit/s, our measured throughput will be 900 Mbit/s, and our estimated throughput of two connections on that link will be 450 Mbit/s. Although Choreo will incorrectly assume that there is no background traffic, it will not be a problem in terms of throughput estimates until Choreo tries to place a significant
number of connections on the path (10, in this example—enough to decrease the rate of the initial 100 Mbit/s connection).
The quantity c is an estimate of the cross traffic on the bottleneck link, measured in terms of the equivalent number of concurrent bulk transport connections. We should interpret the quantity c as a mea-sure of load, not a meamea-sure of how many discrete connections exist. A value of c that corresponds to there being one other connection on the network simply means that there is load on the network equiva-lent to one TCP connection with a continuously backlogged sender; the load itself could be the result of multiple smaller connections.
To test this method, we used ns-2 simulations. First, we simulated a simple topology where 10 sender-receiver pairs share one 1 Gbit/s link, as shown in Figure 3(a). In this simulation, the pair S1; R1 serves as the foreground connection, which transmits for 10 seconds, and the rest (S2; R2,..., S10 ; R10) serve as the background connections, and follow an ON-OFF model [2] whose transition time follows an exponential distribution with µ = 5s. Figure 4(a) shows the actual number of current flows and the estimated value using c. Here, c1= 1 Gbit/s. Second, we simulated a more realistic
cloud topology, shown in Figure 3(b). Figure 4(b) shows the actual and estimated number of cross traffic flows. In this cloud topology, the links shared by cross traffic are links between ToR switches and an aggregate switch, A. Because these links have a rate of 10 Gbit/s each, compared to the 1 Gbit/s links between sender/receiver nodes and their ToR switches, the cross traffic throughput will decrease only when more than 10 flows transfer at the same time. Thus, in Figure 4(b), the smallest estimated value is 10.
The difference in accuracy between Figure 4(a) and Figure 4(b) comes from the possible throughputs when c is large. For instance, given a 1 Gbit/s link, if we see a connection of 450 Mbit/s, we can be relatively certain that there is one existing background connection; the expected throughput was 500 Mbit/s, and 450 Mbit/s is not far off. However, if we see a connection of 90 Mbit/s, multiple values of c (e.g., c = 10, c = 11) are plausible.
Section 4.2 describes the results of this method running on EC2 and Rackspace.
3.3 Locating Bottlenecks
Choreo’s final measurement is to determine what paths share bot-tlenecks, which it can use to determine how connections on one path will be affected by connections on a different path. There is a long-standing body of work on measuring Internet topologies [19, 33, 35]. Typically, these works use traceroute to gain some knowledge of the topology, and then use various clever techniques to overcome the limitations of traceroute. Datacenter topologies, however, are more manageable than the Internet topology; typically they have a structured, hierarchical form. In this section, we explore how traceroute measurements combined with topological assumptions can allow us to discover features of datacenter networks that we typically cannot discover in the Internet at-large.
3.3.1
Typical Datacenter Topologies
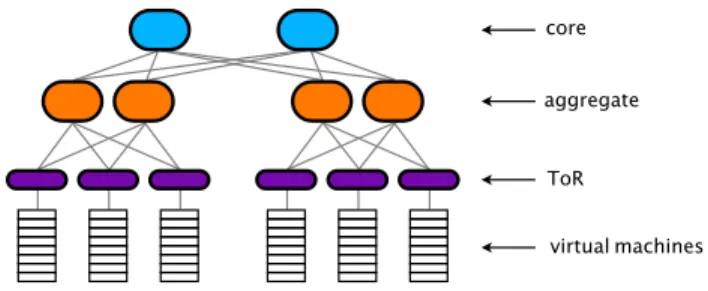
Datacenter topologies are often multi-rooted trees, as shown in Figure 5 and described in [9]. In these topologies, virtual ma-chines lie on physical mama-chines, which connect to top-of-rack (ToR) switches. These switches connect to aggregate switches above them, and core switches above those. To route between virtual machines on the same physical machine, traffic need travel only one hop. To route between two physical machines on the same rack, two hops are needed: up to the ToR switch and back down. To route to a different rack in Figure 5, either four or six hops are needed, depending on whether traffic needs to go all the way to the core. In general, all paths in this type of topology should use an even number of hops (or one hop). If we assume that a datacenter topology conforms to
core aggregate
ToR
virtual machines
Figure 5: Typical multi-tier datacenter topology.
this structure, inferring where machines are placed in the topology is easier; in some sense, we can make the same measurements as traditional techniques, and “fit” a multi-rooted tree onto it.
3.3.2
Locating Bottlenecks
With this knowledge of the topology, we turn our attention to determining whether two paths share a bottleneck link, and where that bottleneck link occurs: at the link to the ToR switch, the link from the ToR switch to the aggregate layer, or the link to the core layer. One way to determine whether two paths share a bottleneck is by sending traffic on both paths concurrently. To determine whether path A; B shares a bottleneck with C ; D, we send netperf traffic on both paths concurrently. If the throughput on A; B decreases significantly compared to its original value, we say that A; B shares a bottleneck with C ; D.
We are interested in whether a connection from A; B will inter-fere with one from C; D. We note the following rules:
1. If the bottleneck is on the link out of the ToR switch, the two connections will interfere if either of the following occur:
(a) they come from the same source, i.e., A = C.
(b) A and C are on the same rack, and neither B nor D is on that rack.
2. If the bottleneck is on the link out of the aggregate layer and into the core, the two connections will potentially interfere if they both originate from the same subtree and must leave it, i.e., if A and C are on the same subtree, and neither B nor Dis also located on that subtree. Note that even in this case, the connections may not interfere; A; B may not get routed through the same aggregate switch as C; D.
These rules allow Choreo to estimate bottlenecks more efficiently than a brute force method that measures all pairs of paths. Because we can cluster VMs by rack, in many cases, Choreo can generalize one measurement to the entire rack of machines. For instance, if there is a bottleneck link on the ToR switch out of rack R, then any two connections out of that rack will share a bottleneck; Choreo does not need to measure each of those connections separately.
Choreo’s bottleneck-finding technique can also determine what type of rate-limiting a cloud provider may be imposing. For in-stance, if the datacenter uses a hose model, and rate-limits the hose out of each source, our algorithm will discover bottlenecks at the end-points—indicating rate-limiting—and that the sum of the con-nections out of a particular source remains constant—indicating a hose model.
Section 4.3 evaluates this method on EC2 and Rackspace.
4.
M
EASUREMENTR
ESULTSWe evaluated the techniques described in Section 3 on EC2 and Rackspace to validate the techniques and measure how these two cloud networks perform.
4.1 Packet Train Accuracy and Temporal Stability
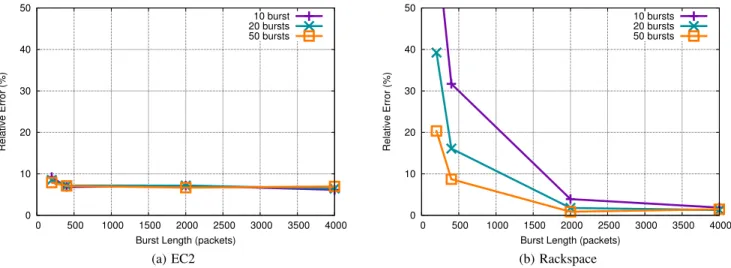
The packet train method from Section 3.1 is parameterized by the packet size, P, the number of bursts, K, and the length of each burst, B. To tune these parameters, we compared the accuracy of various packet sizes, burst lengths, and number of bursts, against the through-puts estimated by netperf on 90 paths in EC2 and Rackspace (we use the netperf throughputs as the “ground truth” for this experiment). Each path gives us one datapoint (one netperf measurement and one packet train estimate). Figure 6 displays the accuracy of estimating throughputs via packet trains averaged over all paths, for a packet size of 1472 bytes and a time δ of 1 millisecond.
In general, we see from Figure 6 that the accuracy improves with the burst length and number of bursts, as expected. Beyond a point, however, the accuracy does not improve (diminishing returns). We found that 10 bursts of 200 packets works well on EC2, with only 9% error, and sending 10 bursts of 2000 packets worked well on Rackspace, with only 4% error (this configuration also works well on EC2). In our measurements, an individual train takes less than one second to send, compared to the ten seconds used by netperf (in our experiments, we found that using netperf for a shorter amount of time did not produce a stable throughput estimate). To measure a network of ten VMs (i.e., 90 VM pairs) takes less than three minutes in our implementation, including the overhead of setting up and tearing down tenants/servers for measurement, and transferring throughput data to a centralized server outside the cloud. Because the best packet train parameters for EC2 and Rackspace differ, before using a cloud network, a tenant should calibrate their packet train parameters using an approach similar to the one pro-posed above. This phase takes longer than running only packet trains, but only needs to be done once.
Although Choreo can get an accurate snapshot of the network quickly using packet trains, such a snapshot will not be useful if the network changes rapidly, i.e., has low temporal stability. In this case, Choreo will have trouble choosing the “best” VMs on which to place tasks. To measure temporal stability, we used 258 distinct paths in Amazon EC2, and 90 in Rackspace. On each of these paths, we continuously measured the throughput using 10-second netperf transfers for a period of 30 minutes, giving us one throughput sample every ten seconds for each path.
We analyze temporal throughput stability by determining how well a TCP throughput measurement from τ minutes ago predicts the current throughput. Given the current throughput measurement, λc, and the throughput τ minutes ago, λc−τ, Figure 7 plots a CDF of
the magnitude of the relative error, i.e., |λc− λc−τ|/λc, for various
values of τ (1, 5, 10, and 30 minutes). In EC2, for every value of τ , at least 95% of the paths have 6% error or less; the median error varies between .4% and .5%, while the mean varies between 1.4% and 3%. As suspected from Figure 2(b), the error in Rackspace is even lower: at least 95% of the paths have 0.62% error or less; the median varies between 0.18% and 0.27%, while the mean varies between 0.27% and 0.39%.
Thus, we find that although some path throughputs vary spatially, they exhibit good temporal stability. Hence, Choreo can measure path throughputs infrequently to gather useful results for making decisions about application placement. The temporal stability result is somewhat surprising because EC2 and Rackspace are popular cloud infrastructures, and one would expect significant amounts of cross traffic. In the next section, we measure the amount of cross traffic on these networks, finding that it is small. We then explore the locations of the bottlenecks, finding that the hose model provides a good explanation of the currently observed network performance on EC2 and Rackspace.
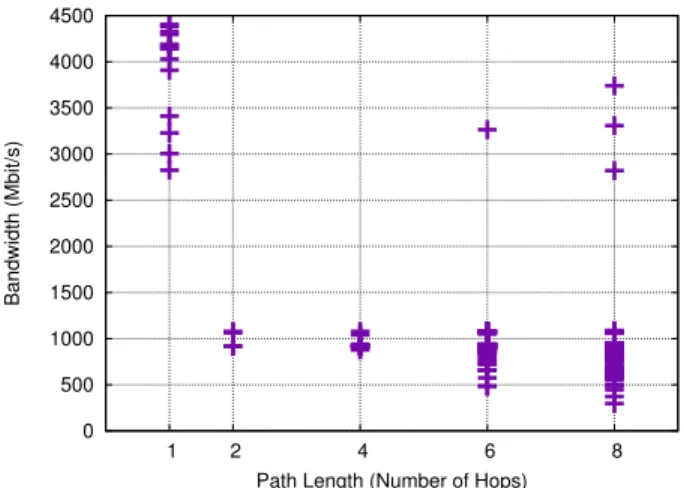
0 500 1000 1500 2000 2500 3000 3500 4000 4500 1 2 4 6 8 Bandwidth (Mbit/s)
Path Length (Number of Hops)
Figure 8: Comparison of path length with bandwidth. Path length is not entirely correlated with throughput, as evidenced by the eight-hop paths with throughput over 2500Mbit/s.
4.2 Cross Traffic
We first return to a result from Section 2.2, shown in Figure 2(a). Initially, we expected that path throughput would be correlated with path length, in part because it should correlate with physical topology: the longer the paths, the more likely they are traversing the middle of the network, and thus cross traffic there would be to interfere and lower the throughput.
Figure 8 plots the various path lengths observed over a collection of 1710 paths in EC2; these are the same paths that we used in Section 2.2. The first thing to note from this figure is that the path lengths are only in the set {1, 2, 4, 6, 8}. These lengths are consistent with a multi-rooted tree topology. Second, many of the paths are more than one or two hops, indicating that a significant number of VMs are not located on the same rack. In the Rackspace network (not shown in the picture), we saw paths of only 1 or 4 hops. Because the throughputs in the Rackspace network are all approximately 300 Mbits/s, there is no correlation with path length. It is also curious that we do not see paths of any other lengths (e.g., 2); we suspect that Rackspace’s traceroute results may hide certain aspects of their topology, although we cannot confirm that.
From Figure 8, we see that there is little correlation between path length and throughput. In general, we find that the highest throughput pairs are one hop apart, an unsurprising result as we would expect the highest-throughput pairs to be on the same physical machine. However, there are four high-throughput paths that are six or eight hops away. Moreover, although we see that the lower throughputs tend to be on longer paths, we also see that a “typical” throughput close to 1 Gbit/s appears on all path lengths. This result leads us to believe that there is very little cross traffic that affects connections on the EC2 network, so we did not run our cross traffic algorithm from Section 3.2 on it; instead, we turned our attention towards locating bottlenecks, speculating that the bottlenecks may be at the source. This result would imply that Choreo can determine how multiple connections on one path are affected by each other simply by knowing the throughput of that path.
4.3 Bottleneck Locations and Cross Traffic
From Figure 8, we hypothesized that Amazon rate-limits at the source, and that cross traffic in the middle of the network has very little effect on connections (and thus the bottleneck link is the first hop). To test this hypothesis, we ran Choreo’s bottleneck-finding al-gorithm from Section 3.3. We ran an experiment on twenty pairs of
0 10 20 30 40 50 0 500 1000 1500 2000 2500 3000 3500 4000 Relative Error (%)
Burst Length (packets)
10 burst 20 bursts 50 bursts (a) EC2 0 10 20 30 40 50 0 500 1000 1500 2000 2500 3000 3500 4000 Relative Error (%)
Burst Length (packets)
10 bursts 20 bursts 50 bursts
(b) Rackspace
Figure 6: Percent error for packet train measurements using different burst lengths and sizes. EC2 displays a consistently low error rate over all configurations, while Rackspace’s error rate improves dramatically once the burst length is at least 2000.
0 0.1 0.2 0.3 0.4 0.5 0.6 0.7 0.8 0.9 1 0 2 4 6 8 10 CDF Percent Error 1min 5min 10min 30min
(a) EC2. More recent measurements are more accurate, but even with values of τ = 30min, over 90% of paths see 4% error or less.
0 0.2 0.4 0.6 0.8 1 0 2 4 6 8 10 CDF Percent Error 1min 5min 10min 30min
(b) Rackspace. The results for Rackspace are virtually the same for all values of τ, hence the appearance of only one line on the graph.
Figure 7: Percent error when a measurement from τ minutes ago is used to predict the current path bandwidth.
connections between four distinct VMs, and twenty pairs of connec-tions from the same source. We found that concurrent connecconnec-tions among four unique endpoints never interfered with each other, while concurrent connections from the same source always did. This result indicates that EC2 bottlenecks occur on the first hops of the paths. Figure 7 also supports this conclusion, as paths with little cross traffic tend to be relatively stable over time.
We also hypothesized that rate-limiting at the source was preva-lent on Rackspace, since most path throughputs are so close to 300Mbit/s. Additionally, we verified that connections out of the same source always interfered. These results imply that connections placed on a particular path are affected by other connections out of the source, not just other connections on the path. However, they are not affected by connections emanating from a different source.
4.4 Discussion
In summary, these results suggest that the EC2 and Rackspace networks are both rate-limited and use the hose model. Rackspace has very little spatial variability in throughput; EC2 has some, but the overwhelming majority of paths see similar throughputs near
1Gbit/s.
Despite this lack of a lot of natural variation in the two public cloud networks, Choreo is still able to exploit variation that comes with a tenant running multiple applications at once (see Section 6.3), and to avoid the few paths in EC2 that do see low throughput. More-over, paths on these networks are temporally stable, indicating that Choreo does not need to update its measurements very frequently to take into account high-variance paths.
We also note that cloud networks can change over time. In fact, our results from Figure 1 indicated a larger range of spatial variation. For that reason, we believe that Choreo’s measurement techniques are worthwhile beyond simply measuring a tenant’s own applica-tions, because higher network variation could appear in other cloud networks, or in EC2 and Rackspace in the future.
5.
C
HOREO’
SP
LACEMENTM
ETHODHere, we discuss the placement of one application’s tasks; the placement of a sequence of applications follows naturally. Our goal is to minimize application completion time. This goal can be for-mulated as an integer linear program (ILP), which we detail in the
Appendix. In practice, we found that this ILP occasionally took a very long time to solve, hampering our ability to place applica-tions quickly. Moreover, the larger the number of machines in the network and the number of tasks in the application, the longer the mathematical optimization will take.
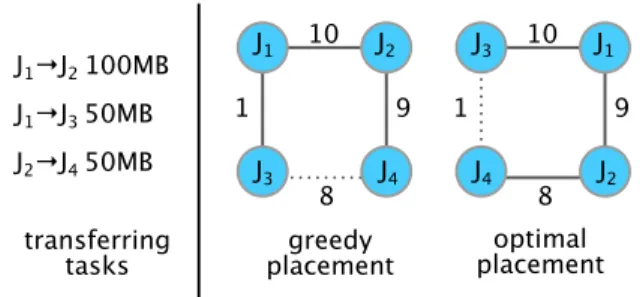
As a result, Choreo uses an alternate network-aware placement algorithm, shown in Algorithm 1 below. This algorithm works by trying to place the pairs of tasks that transfer the most data on the fastest paths. Because intra-machine links are modeled as paths with (essentially) infinite rate, the algorithm captures the heuristic of placing pairs of transferring tasks on the same machines. Though not guaranteed to result in a globally optimal placement (see Figure 9), this method scales better to larger topologies. We compared our greedy algorithm to the optimal algorithm on 111 different applications, and found that the median completion time with the greedy algorithm was only 13% more than the completion time with the optimal algorithm.
It is possible that an application may have other goals, such as minimizing latency or increasing fault tolerance, or even goals unrelated to the network, such as minimizing the monetary cost to the user. Users may also want to impose more constraints on CPU or storage systems. The basic principles of Choreo can be extended to all of these types of goals; we refer readers to our technical report on the subject [20]. In general, Choreo can support any goal that can be expressed as an ILP (all of the previous examples can be); it is not clear, though, whether every goal has a corresponding greedy heuristic, as minimizing completion time does. We have also not evaluated Choreo’s performance improvements for these additional goals; we leave this to future work.
Algorithm 1 Greedy Network-aware Placement
1: transfers = a list of hi, j, bi tuples, ordered in descending order of rates, b. hi, j, bi means Task i transfers b bytes to Task j. 2: for hi, j, bi in transfers do
3: if i has already been placed on machine k then 4: P= set of paths k; N ∀ nodes N
5: if j has already been placed on machine ` then 6: P= set of paths M; ` ∀ nodes M
7: if neither i nor j have been placed then
8: P= set of paths M; N ∀ nodes M and ∀ nodes N 9: for path m; n in P do
10: if placing i on m or j on n would exceed the CPU con-straints of m or n then
11: Remove m; n from P 12: for path m; n in P do
13: rate(m, n) = the rate that the transfer from i to j would see if placed on m; n. This rate takes into account all other task pairs already placed on m; n for a “pipe” model, or all other connections out of m for a “hose” model. 14: Place i and j on path m; n ∈ P such that rate(m,n) is
maximized.
6.
E
VALUATIONWe evaluate two different scenarios with Choreo. First, a case where a tenant wants to run multiple applications all at once, and second, a case where a tenant wants to run multiple applications, the entire sequence of which is not known up front. In each case, we compare Choreo’s placement to three alternate existing placement algorithms: Random, Round-robin, and Minimum Machines.
Random: Tasks are assigned to random VMs. This assignment makes sure that CPU constraints are satisfied, but does not take the network into account. This type of placement acts as a baseline for
A B 10Mb/s T1 T2 10 A B M N X Y J1→J2 100MB J1→J3 50MB J2→J4 50MB 10 9 8 1 J3 J1 J4 J2 10 9 8 1 J1 J2 J3 J4 transferring
tasks placementgreedy placementoptimal
Figure 9: An example topology where the greedy network-aware placement is sub-optimal. Because the greedy placement algorithm first places tasks J1and J2on the path with rate 10,
it must also use the path with rate 1 to place J1 and J3. The
optimal placement avoids this path by placing J1and J2on the
path with rate 9.
comparison.
Round-robin: This algorithm assigns tasks in a round-robin order to VMs; a particular task is assigned to the next machine in the list that has enough available CPU. As before, CPU constraints are satisfied, but the network is not taken into account. This placement is similar to one that tries to load balance, and minimize the amount of CPU used on any particular VM.
Minimum Machines: This algorithm attempts to minimize the number of machines used. If possible (given CPU constraints), a task will be placed onto a VM that is already used by another task; a new VM will be used only when no existing machine has enough available CPU. This algorithm may be of interest to cloud customers who aim to save money; the fewer machines they use, the lower the cost (at, perhaps, the expense of longer-running applications).
6.1 Dataset and Experimental Set-up
To evaluate Choreo, we ran experiments on EC2. In each experi-ment, we measure an EC2 topology, and then place an application or sequence of applications on that topology. The applications are composed from the real traffic matrices gathered using sFlow at the ToR and aggregation switches in the HP Cloud network [15]. For each application, we know the observed start time on the cloud as well as its traffic matrix. From this data, we can accurately model sequences of applications. We model each component of an appli-cation as using between 0.5 and four CPU cores, and each cloud machine as having four available cores (the actual CPU data was not available in our dataset).
Once the applications are placed, we transfer data as specified by the placement algorithm and the traffic matrix. Note that these experiments transfer real traffic on EC2; we do not merely calculate what the application completion time would have been based on the measured network, placement, and traffic matrix. Thus, these experiments are susceptible to any changes in the network, as well as the effects of any cross traffic.
6.2 All Applications at Once
For our first set of experiments, we modeled a tenant with multiple applications, whose network demands (amount of data transferred between tasks) are known a priori. We randomly chose between one and three applications and made one combined application out of them, combining each application’s traffic demand matrix and CPU vector in the obvious way. Then, we placed this combined application and ran it, using each of the four placement algorithms in turn. Our CDFs do not explicitly account for measurement time, because it is the same (approximately three minutes for a ten-node
0 0.1 0.2 0.3 0.4 0.5 0.6 0.7 0.8 0.9 1 -60 -40 -20 0 20 40 60 80 CDF Relative Speed-Up (%) min machines random round robin
(a) All applications at once
0 0.1 0.2 0.3 0.4 0.5 0.6 0.7 0.8 0.9 1 -40 -20 0 20 40 60 80 CDF Relative Speed-Up (%) min machines random round robin (b) Sequences of applications
Figure 10: Relative speed-up for applications using Choreo vs. alternate placement algorithms.
topology) regardless of the length of an application’s run. We note that Choreo is not meant for short-lived applications where the three-minute time-to-measure will exceed any reductions in the completion time from Choreo.
Figure 10(a) shows the results from this experiment. Each line in the CDF compares Choreo to one of the alternate placement algorithms. The x-axis plots the relative speed-up, defined as the amount of time that Choreo saved (or added) to the completion time of an application. For instance, if an application took five hours with the random placement algorithm, and four hours using Choreo, the relative speed-up would be (5 − 4)/5 = 20%.
From Figure 10(a), we can see that in roughly 70% of the appli-cations, Choreo improves performance, with improvements as large as 60%. The mean improvement over other approaches in all cases is between 8% and 14%, while the median improvement is between 7% and 15%; restricted to the 70% of applications that show im-provement, these values rise to 20%–27% (mean) and 13%–28% (median). In the other 30% of applications, Choreo reduces perfor-mance; in these cases, the median slow-down is (only) between 8% and 13%.
These numbers imply that, if we could predict the types of ap-plications where Choreo typically provides improvement, it would improve performance by roughly 13%–28%. We leave this type of prediction to future work.
6.3 Applications in Sequence
For our second set of experiments, we modeled a tenant wishing to run multiple applications whose demands are not all known a priori. Instead, the applications arrive one-by-one, and are placed as they arrive. We randomly chose between two and four applications and ordered them by their observed start times. We placed the applications in sequence according to these start times. Applications may overlap in time in this scenario.
Because multiple applications arrive in sequence, it does not make sense to measure the entire sequence’s completion time. Instead, we determine the total running time of each application, and compare the sum of these running times for each placement algorithm.
Figure 10(b) shows the results from this experiment. As in Fig-ure 10(a), each line in the CDF compares Choreo to one of our alter-nate placement algorithms. We see similar results as in Figure 10(a), in that for most applications, Choreo provides an improvement over all other placement schemes. With sequences of applications, we see
an improvement in 85%–90% of all applications, with a maximum observed improvement of 79%. Over all applications, the mean improvement ranges from 22%–43%; the median from 19%–51% across different alternative algorithms. Restricted to the applications that show improvement, the mean rises slightly to 26%–47% and the median to 23%–53%. For the applications whose performance degraded, the median slow-down was only 10%.
In general, Choreo performs better when applications arrive in sequence than when all demands are known up front and applications can be placed at once. This result is likely due to the fact that applications arriving in sequence allows us to spread their network demands out more; placing multiple applications at once will use more network resources than placing the applications as they arrive, in general.
In cases where an in-sequence placement seems to be going poorly, however, Choreo can re-evaluate its placement during a run, and migrate applications if the tenant deems that worthwhile (as men-tioned in Section 2.4). However, we can see from Figure 10(b) that even without this behavior, Choreo’s relative performance improve-ment over the other schemes when constrained to no re-evaluations is significant.
7.
D
ISCUSSIONAlthough Choreo can improve the completion time of many cloud applications, it is not appropriate for every application nor for every cloud environment. Here, we discuss some use-cases that are not particularly well-served by Choreo, as well as how we expect Choreo to fare as cloud networks evolve.
7.1 Limitations of Choreo
Choreo was designed with network-intensive applications in mind. Though it is a general framework, there are certain applications for which it likely will not provide any improvement. For example, for applications that only need a few minutes to run, the cost of Choreo’s measurement phase would cancel out any improvement. Applications that have relatively uniform bandwidth-usage also would not see much improvement from Choreo, because there is not a lot of room for improvement. Here, because every pair of VMs uses roughly the same amount of bandwidth, it does not help to put the “largest” pair on the fastest link. We observed this traffic pattern in some map-reduce applications.
improvement from Choreo, in part because the current version of Choreo does not model how applications change over time. Even if it did, the interactive phases would likely be difficult to model, although Choreo could potentially re-evaluate its placement after every interactive phase for some applications.
Choreo is also only appropriate for certain cloud environments. For instance, Choreo will not offer a great deal of improvement in cloud environments with an abundance of network bandwidth. After all, if the cloud provider can afford to give every pair of tasks a dedicated path, for instance, there is not much need to optimize task placement. Choreo will offer more improvement as cloud networks become more utilized. Although we do not believe that today’s cloud networks are blessed with an excess of network bandwidth, they also may not be as heavily utilized as they could be; thus, Choreo may offer more more substantial improvements as cloud networks evolve and become more heavily utilized.
7.2 Future Work
Currently, Choreo models an application with one traffic matrix that captures the total number of bytes transferred between each task. Notably, Choreo loses information about how an application changes over time. Choreo could capture that information by modeling applications as a time series of traffic matrices; this method will naturally lead to a more complicated task placement algorithm. A straw-man approach is to determine the “major” phases of an application’s bandwidth usage, and use Choreo as-is at the beginning of each phase. We leave an evaluation of this method, as well as a more involved approach as future work.
We also leave a study of how Choreo performs with multiple users as future work. In general, we believe that Choreo would succeed in this case, because each user would measure the network individually (and so would be able to place their application with the knowledge of how the network was being affected by the other Choreo users). How this approach compares to using a centralized Choreo controller to orchestrate all users remains to be seen.
The final piece of future work is studying how the accuracy of Choreo’s measurements trades off with its improvement. Though Choreo’s measurement phase does not require much overhead (tak-ing only three minutes to measure 90 VM-pairs), it is possible that the system would still be able to improve performance with even less accurate measurements. For instance, if Choreo’s measurements were only 75% accurate, as opposed to approximately 90% accurate (as in Section 4.1), would the performance improvement also fall by 15%, or only by a few percent?
7.3 Longevity of Choreo
Cloud networks are an evolving environment. The way providers manage their network, including enforcing rate-limits, or migrating VMs, could change, and it is difficult to predict how Choreo will be affected by these changes. However, because Choreo starts by measuring the cloud network, we believe that it could provide improvement—or, at the very least, not be detrimental—in the face of some of these changes. For example, if rate limits are enforced, Choreo should be able to pick up on that when it explicitly measures the links. If VMs are migrated during an application’s run, Choreo will account for that, as it measures periodically. Determining the correct frequency for these measurements would likely require some fine-tuning.
Today’s cloud providers offer little in the way of network QoS or SLAs to their customers. In the future, these types of guarantees may become commonplace; a customer may be able to pay for a particular level of bandwidth in their network. We believe that Choreo could be complementary in this scenario, determining the best placement for an application within the guaranteed network.
However, for some customers, Choreo may provide diminishing returns; the provider’s SLA may be “good enough” on its own.
Today’s version of Choreo may not be appropriate for cloud networks years from now. But we believe that the general approach of measuring the network and adapting to it will remain useful, and that future versions of Choreo could be built under the same principles to adapt to future cloud networks.
8.
R
ELATEDW
ORKWe break related work into two sections: work related to improv-ing various aspects of cloud performance, and work related to the measurement of public cloud networks and datacenters.
8.1 Improving Cloud Performance
Previous papers on network virtualization and optimization for cloud computing systems and datacenters address one of two prob-lems: how to choose paths between fixed machines or how to choose machines given a fixed network. Choreo falls into the second cate-gory, as work in the first generally assumes a level of control over the network that public cloud tenants do not have.
How to choose paths: Given a fixed network, there are many ways to choose paths in the network to route from one machine to another. Many datacenters choose paths with load balancing in mind. A popular method is Equal-Cost Multi-Path forwarding [9], where a flow’s path is selected based on a hash of various header fields. VL2 [11] uses Valiant Load Balancing on a Clos network as a means for selecting routes. Hedera [3] designed a dynamic flow scheduling system, which can move flows in a network to efficiently utilize all network resources. Other approaches to load balancing in datacenters include software-defined networking, as in [13].
Other schemes, such as Seawall [34] and NetShare [21], focus on choosing routes for performance isolation, ensuring that network bandwidth is shared among tenants based on some weight function. All of these systems differ from Choreo in that they have control, at a minimum, of the routing protocol in the network. Tenants of public cloud infrastructures do not have this type of control.
How to choose machines: Now we turn our attention to the fol-lowing problem: Given a large network of machines, how do we pick which machines to run a particular workload on? Here we assume that the routes between machines are fixed. Oktopus [4] uses a virtual topology to place tenant VMs such that they meet bandwidth and oversubscription requirements. This system must be deployed by cloud providers rather than tenants, but offers more stable workload completion times (the goal of Oktopus is to improve the accuracy of predicted completion times, rather than to focus on finding an optimal placement). Researchers have also designed an algorithm to place VMs on physical machines with the goal of mini-mizing the number of physical machines used while also meeting the VMs’ requirements for CPU, memory, and bandwidth [24]. Unlike our work, they model network requirements as the percentage of network I/O required, rather than amount of data to be transferred between tasks, which limits the speed of a particular transfer even if the network capacity is available. It is not clear whether virtual machines are allowed to transfer data to multiple machines, nor is it clear how this system would operate in general; the only simulation is done on an extremely small topology with a highly structured workload. Purlieus [26] reduces MapReduce job execution times by placing Map/Reduce nodes in a locality-aware manner. This method requires information about the network topology, which is usually not provided by public cloud providers.
The largest difference between Choreo and these works is that we present network-aware placement schemes that run with no changes to the network; imposing no virtual topologies, assuming no knowledge of the topology is assumed, and not introducing a new
routing protocol. Although there are features of Choreo that cloud providers can take advantage of (such as incorporating network topology knowledge), Choreo can be run entirely by tenants.
Our idea of network-aware placement is in contrast to workload placement systems that only take CPU constraints into account [1, 29]. These systems generally attempt to load balance across ma-chines or minimize the number of physical mama-chines used.
8.2 Measurement
In accordance with the popularity of datacenters, there have been many recent measurement studies in this environment [5, 6, 22]. These studies corroborate the assumptions in this paper, for example the typical datacenter topology used in Section 3.3.1. However, these studies are not focused on the performance of the network and how it varies, which can affect the performance of network-intensive applications. There have been a few efforts to understand the network performance of Amazon EC2 [25], though only at a very small scale.
In [8], Butler conducts measurement for network performances for five major cloud providers, focusing on the throughputs when cloud users upload/download files from outside the cloud, while Choreo focuses on measuring the throughputs between VMs inside the cloud. CloudTalk [30] measures EC2 topology to help optimize latency sensitive applications such as web search. As we show in Section 4.2, the topology information, i.e, hop-count from tracer-oute, has no strong correlation with throughput. Thus, compared to CloudTalk, Choreo’s throughput measurement techniques are more helpful to big data applications whose performance depends more on throughput instead of latency. Schad, et al [32] measured network throughput between Amazon EC2 instances using iperf. They observed similar throughput variation results as ours in both US and European zones. Wang, et al [36] measured TCP/UDP throughput between VMs in EC2. Similarly, they observed spatial variation in both Small and Medium instances, and they observed temporal variation over a 150-hour period, which is a much larger time scale than we discussed in this paper.
We borrow the basis of many of our measurement techniques from existing techniques, such as the early work by Bolot [7] and Jain [18] on packet trains. Further related work in this area [27, 28] has indicated that packet trains are not always an accurate measure of path throughput due to their susceptibility to cross traffic. Packet trains are also similar to the “history-based” methods in He, et al [14], but requires significantly less data (He’s method requires 10-20 TCP transfers to make a throughput prediction on a path). We did not consider methods that estimate the available bandwidth of a path [16, 17], as that is not equivalent to the TCP throughput.
9.
C
ONCLUSIONIn this paper, we motivated the need for network-aware applica-tion placement on cloud computing infrastructures. As applicaapplica-tions become more network-intensive, they can become bottlenecked by the network, even in well-provisioned clouds. Without a network-aware system for placing workloads, poor paths can be chosen while faster, more reliable paths go unused. By placing applications with the goal of minimizing the total completion time, Choreo is able to improve application-level performance. Choreo’s placement also tends to place tasks that transfer large amount of data on the same machines if possible, avoiding any network transmission time, as well as avoiding slow paths in the network.
Our experiments on Amazon EC2 showed that Choreo improves application completion time by an average of 8%–14% (max im-provement: 61%) when applications are placed all at once, and 22%–43% (max improvement: 79%) when they arrive in real-time, compared to alternative placement schemes studied on realistic
workloads.
We also note that tenants may be interested in adding other re-quirements to their workload; some of the tasks could be specified as “latency-constrained”, or certain tasks could be specified as being placed “far apart” for fault tolerance purposes. We believe that all of these types of constraints are reasonable and would be benefi-cial to tenants. Moreover, they can be formulated as part of our optimization problem, as shown in [20].
In addition to our results from Choreo, we also developed and tested techniques for measuring public cloud networks quickly and accurately. We found that packet trains could be used to measure public cloud networks, with a mean error of only 9% on EC2, and a mean error of 4% on Rackspace. Choreo uses these measurements to quickly place applications, and they are accurate enough that applications see improvement over existing placement methods.
A
CKNOWLEDGMENTSWe are indebted to Jeff Mogul for help with data collection and for discussions on this work, and to Gavin Pratt and Sujata Banerjee for permitting us to analyze Choreo with data collected from HP. We thank our shepherd, Morley Mao, and the IMC reviewers for their insightful comments. This work was supported in part by the National Science Foundation under grants 0645960, 1065219, and 1040072.
10.
R
EFERENCES[1] A. Aboulnaga, K. Salem, A. A. Soror, U. F. Minhas, P. Kokosielis, and S. Kamath. Deploying Database Appliances in the Cloud. In Bulletin of the IEEE Computer Society Technical Committee on Data Engineering, 2009. [2] A. Adas. Traffic Models in Broadband Networks.
Communications Magazine, IEEE, 35(7):82–89, 1997. [3] M. Al-Fares, S. Radhakrishnan, B. Raghavan, N. Huang, and
A. Vahdat. Hedera: Dynamic Flow Scheduling for Data Center Networks. In NSDI, 2010.
[4] H. Ballani, P. Costa, T. Karagiannis, and A. Rowstron. Towards Predictable Datacenter Networks. In SIGCOMM, 2011.
[5] T. Benson, A. Akella, and D. A. Maltz. Network Traffic Characteristics of Data Centers in the Wild. In IMC, 2010. [6] T. Benson, A. Anand, A. Akella, and M. Zhang.
Understanding Data Center Traffic Characteristics. In WREN, 2009.
[7] J.-C. Bolot. Characterizing End-to-End Packet Delay and Loss in the Internet. Journal of High Speed Networks,
2(3):289–298, 1993.
[8] B. Butler. Microsoft Azure Overtakes Amazon’s Cloud in Performance Test. http://www.networkworld.com/ news/2013/021913-azure-aws-266831.html. [9] Cisco Data Center Infrastructure 2.5 Design Guide.
http://www.cisco.com/univercd/cc/td/doc/ solution/dcidg21.pdf.
[10] N. Duffield, P. Goyal, A. Greenberg, P. Mishra,
K. Ramakrishnan, and J. E. van der Merwe. A Flexible Model for Resource Management in Virtual Private Networks. In SIGCOMM, 1999.
[11] A. Greenberg, J. R. Hamilton, N. Jain, S. Kandula, C. Kim, P. Lahiri, D. A. Maltz, P. Patel, and S. Sengupta. VL2: A Scalable and Flexible Data Center Network. In SIGCOMM, 2009.
[12] Apache Hadoop. http://hadoop.apache.org. [13] N. Handigol, M. Flagslik, S. Seetharaman, R. Johari, and
N. McKeown. Aster*x: Load-Balancing as a Network Primitive. In ACLD (Poster), 2010.
[14] Q. He, C. Dovrolis, and M. Ammar. On the Predictability of Large Transfer TCP Throughput. In SIGCOMM, 2005. [15] HP Cloud Services. http://hpcloud.com/. [16] M. Jain and C. Dovrolis. Ten Fallacies and Pitfalls on
End-to-End Available Bandwidth Estimation. In IMC, 2004. [17] M. Jain and C. Dovrolis. End-to-end Estimation of the
Available Bandwidth Variation Range. In Sigmetrics, 2005. [18] R. Jain and S. A. Routhier. Packet Trains: Measurements and
a New Model for Computer Network Traffic. IEEE Journal on Selected Areas in Communications, 4:986–995, 1986. [19] E. Katz-Bassett, H. V. Madhyastha, V. K. Adhikari, C. Scott,
J. Sherry, P. van Wesep, T. Anderson, and A. Krishnamurthy. Reverse Traceroute. In NSDI, 2010.
[20] K. LaCurts, S. Deng, and H. Balakrishnan. A Plan for Optimizing Network-Intensive Cloud Applications. Technical Report MIT-CSAIL-TR-2013-003, MIT CSAIL, 2013. [21] T. Lam, S. Radhakrishnan, A. Vahdat, and G. Varghese.
NetShare: Virtualizing Data Center Networks Across Services. In Technical Report CSS2010-0957, University of California, San Diego, 2010.
[22] A. Li, X. Yang, S. Kandula, and M. Zhang. CloudCmp: Comparing Public Cloud Providers. In IMC, 2010. [23] M. Mathis, J. Semke, J. Mahdavi, and T. Ott. The
Macroscopic Behavior of the TCP Congestion Avoidance Algorithm. SIGCOMM CCR, 27(3), 1997.
[24] E. Mohammadi, M. Karimi, and S. R. Heikalabad. A Novel Virtual Machine Placement in Cloud Computing. Australian Journal of Basic and Applied Sciences, 2011.
[25] Network Performance Within Amazon EC2 and to Amazon S3. http://blog.rightscale.com/
2007/10/28/network-performance-within-amazon-ec2-and-to-amazon-s3. [26] B. Palanisamy, A. Singh, L. Liu, and B. Jain. Purlieus:
Locality-aware Resource Allocation for MapReduce in a Cloud. In International Conference for High Performance Computing, Networking, Storage and Analysis, 2011. [27] V. Paxson. End-to-End Internet Packet Dynamics. In
SIGCOMM, 1997.
[28] R. S. Prasad, M. Murray, C. Dovrolis, and K. Claffy. Bandwidth Estimation: Metrics, Measurement Techniques, and Tools. IEEE Network, 17:27–35, 2003.
[29] A. Quiroz, H. Kim, M. Parashar, N. Gnanasambandam, and N. Sharma. Towards Automatic Workload Provisioning for Enterprise Grids and Clouds. In IEEE/ACM International Conference on Grid Computing, 2009.
[30] C. Raiciu, M. Ionescu, and D. Niculescu. Opening Up Black Box Networks with CloudTalk. In Hotcloud, 2012.
[31] Scaling Hadoop to 4000 Nodes at Yahoo! http:
//developer.yahoo.net/blogs/hadoop/2008/ 09/scaling_hadoop_to_4000_nodes_a.html. [32] J. Schad, J. Dittrich, and J.-A. Quiané-Ruiz. Runtime
Measurements in the Cloud: Observing, Analyzing, and Reducing Variance. Proceedings of the VLDB Endowment, 3(1-2):460–471, 2010.
[33] R. Sherwood, A. Bender, and N. Spring. DisCarte: A Disjunctive Internet Cartographer. In SIGCOMM, 2008. [34] A. Shieh, S. Kandula, A. Greenberg, C. Kim, and B. Saha.
Sharing the Data Center Network. In NSDI, 2011. [35] N. Spring, R. Mahajan, and D. Wetherall. Measuring ISP
Topologies with Rocketfuel. In SIGCOMM, 2002. [36] G. Wang and T. E. Ng. The Impact of Virtualization on
Network Performance of Amazon EC2 Data Center. In INFOCOM, 2010.
APPENDIX
The problem of minimizing application completion time can be modeled as a quadratic optimization problem. In our formulation, we assume that there is no unknown cross-traffic in the network. We show in Section 4.2 that this assumption generally holds in the Amazon EC2 and Rackspace networks, and also discuss how we could change our formulation if the assumption were not true.
To describe the existing network of M machines, we require two matrices:
• CM×1, the CPU constraint vector. Cmis the CPU resource
available on machine m, i.e., the number of cores on the ma-chine.
• RM×M, the network constraint matrix. Rmnis the bulk TCP
throughput of the path from Machine m to n, assuming no one else is sending traffic on the path.
To describe the J tasks:
• CRJ, the CPU demand vector. CRjis the CPU demand for
Task j, i.e., the number of cores required for Task j. • BJ×J, the network demand matrix. Bi jis the amount of data
Task i needs to transfer to Task j.
• XJ×M, the task assignment matrix. Xjm= 1 if Task j is placed
on Machine m, and 0 otherwise.
A placement of the J tasks onto the M machines is an X such that: ∑Mm=1Xjm= 1, ∀ j ∈ [1, J]
That is, each task must be placed on exactly one machine. In addition, the placement of tasks on each machine must obey CPU constraints, i.e.,
∑Jj=1CRj· Xjm≤ Cm, ∀m ∈ [1, M]
Given a particular placement of tasks, we need to calculate how long an application running with this placement will take to com-plete. By definition, this completion time is equal to the time taken to complete the longest-running flow.
Let f1, . . . , fkbe a set of flows that share a bottleneck link ` with
rate R. The flows transmit b1≤, . . . , ≤ bkbytes of data, respectively.
The amount of data traversing link ` is then ∑i=ki=1bi. Since there is
no cross traffic (by our assumption), the total amount of time these flows take is ∑i=ki=1bi/R. The total completion time for the workload
placement, then, is max ∑i=ki=1bi/R over all sets of flows that share
a bottleneck link. Choreo’s goal is to minimize that time over all possible placements.
To formulate this objective so that it can be solved by quadratic program solvers, we need to express it using matrices. In particular, we need a way to define whether two flows will share a bottleneck link. Let S be an M2× M2matrix such that S
mn,ab= 1 if the path
m; n shares a bottleneck link with path a ; b. Let Dmnbe the M ×
Mmatrix expressing the amount of data to be transferred between machines m and n (D = XTBX). Let Emn= ∑m
0=M,n0=M
m0=1,n0=1 Dm0n0×
Smn,m0n0.
Emnexpresses the amount of data traveling on m; n’s bottleneck
link. Note that the rate of that path is, by definition, Rmn. Our
objective, then, is min maxm,n Emn/Rmn, such that all CPU constraints
are still satisfied. In Section 4.4, we show that VMs in both EC2 and Rackspace cloud follow a hose model: the outgoing bandwidth for each VM is limited by a certain threshold. We can model this type of rate-limiting with the following: Smi,m j= 1 (m 6= i, m 6= j).
What happens if a tenant does not know the physical topology of the network, i.e., does not know the correct values for S? In this case, Choreo assumes that every entry in S is zero, i.e., there are
noshared bottlenecks in the network (effectively, this S models a network with unique paths between every pair of machines). If this value is incorrect, i.e., there are certain paths that share bottlenecks, our formulation will likely calculate the workload completion time incorrectly. However, we show in Section 6 that in practice, sig-nificant performance gains can still be seen without knowledge of S.
It turns out that our problem can be converted into a linear pro-gramming problem. For each quadratic term in above constraints, Xim· Xjn, i < j, we define a new variable, zim jn(i < j forces Xim· Xjn
and Xjn· Ximto be equal). Now the problem is as follows:
minimize: z subject to: z− ∑J i=1∑Jj=1 Bi j·zim jn Rmn ≥ 0 ∀ m, n ∈ [1, M] Cm− ∑Ji=1CRi· Xim≥ 0 ∀ m ∈ [1, M] ∑Mm=1Xim= 1 ∀ i ∈ [1, J] zim jn− Xim≤ 0, and zim jn− Xjn≤ 0 ∀ i, j ∈ [1, J]
∑n,m∑Jj=i+1zim jn+ ∑n,m∑i−1j=1zjnim= J − 1 ∀ i ∈ [1, J]
z≥ 0 binaries:
Xim, zim jn(i < j, i, j ∈ [1, J], m, n ∈ [1, M])
The constraints serve the following purposes, in order: To force z to represent the maximum amount of data transferred between two machines, to make sure the computation capability of any machine is not exceeded, to make sure each task is placed on exactly one machine, to force zim jn≤ Xim· Xjn, and to force zim jn≤ Xim· Xjn.