HAL Id: hal-01208877
https://hal.archives-ouvertes.fr/hal-01208877 Submitted on 5 Jun 2020
HAL is a multi-disciplinary open access archive for the deposit and dissemination of sci-entific research documents, whether they are pub-lished or not. The documents may come from teaching and research institutions in France or abroad, or from public or private research centers.
L’archive ouverte pluridisciplinaire HAL, est destinée au dépôt et à la diffusion de documents scientifiques de niveau recherche, publiés ou non, émanant des établissements d’enseignement et de recherche français ou étrangers, des laboratoires publics ou privés.
Urbanisation et sécurité alimentaire
Carl Gaigné
To cite this version:
Carl Gaigné. Urbanisation et sécurité alimentaire. Urbanisation et sécurité alimentaire, United Na-tions Educational Scientific and Cultural Organization (UNESCO). INT., 2013, Montpellier, France. 27 p. �hal-01208877�
U
RBANISATION ET
S
ÉCURITÉ
A
LIMENTAIRE
Carl Gaigné
INRA, UMR SMART, Rennes & Université Laval (Québec)
F
OOD
S
ECURITY
&
U
RBANIZATION
:
OLD CHALLENGE
Food security for a city means access by its residents to enough food for an active, healthy life.
Since ancient times, the cities need food security to build its growth.
First cities have been nearness to fertile agricultural land in order to secure the food supply
Large-scale urbanization has been induced by economies of scale in the
production of manufactured products and services and in the production of public good (a necessary condition but not a sufficient condition)
Large-scale urbanization has been also allowed by structural changes
in agriculture
(when the food supply was mainly in the land around the cities)New agricultural products (ex: the introduction of potatoes: provide more calories, vitamins, and nutrients per unit of land than other pre-existing staple crops = potatoes require less land to produce the same amount of calories
New agricultural technologies induce productivity gains (reduce the “food problem” and releases labor for the urban sectors)
AND
allowed by the fall in (agricultural/food) transportation cost and
time
The food supply was mainly in the land around the cities; Today, the means of transport have been greatly improved and the system of logistics has been developed, leading to
More exports and imports of agricultural and food products More big food companies
⇒ INTERNATIONALIZATION AND SPATIAL DISPERSION OF FOOD SUPPLY WHILE
S
USTAINABLY FEEDING LARGE CITIES
:
B
IG CHALLENGES
1. Large quantities of food need to be imported each day to feed the major
cities. Indeed, about 6000 (14000) tonnes of food (beverage) need to be imported each day into cities of at least 10 million inhabitants
2. According to our calculations, about 0.18 hectares of crops and 0.12
hectares of permanent grassland are necessary to feed one person in
France. In other words, about 3 million hectares of agricultural land are needed to feed the 10 million inhabitants.
3. Urbanization may also give rise to spatial and "nutritional" exclusion,
insufficient access to a satisfactory diet that can achieve a nutritional status that is
The food demand is more and more agglomerated
More than half of the global population now lives in urban areas
Even if a strict definition of a city is used, nearly 40% of the global population lives in a metropolitan area of more than one million inhabitants.
More big cities
The number of cities with more than 1 million inhabitants has more than doubled between 1950 and 2007, rising from 181 to 414.
High-speed urbanization in Africa and Asia
The proportion of the urban population in Africa increased at an average rate of 4.3% per year.
Dhaka in Bangladesh, with a population of about 9 million inhabitants, is growing at an annual rate of 5%, which means 1300 additional people each day
Spatial extension of cities (
urban sprawl
) to the
detriment of agricultural land.
Spatial extension of a city increases
more than proportionally with its population size
The land allocated to residential areas increased by 48% between 1976 and 1992 in the USA, while the urban population increased by 18%
Urbanization in the European Union: lost 30 million hectares of agricultural land between 1961 and 2003
Urbanization in China: Between 1996 and 2005, 8 million hectares of arable land was lost (around 30% of arable land in France)
A growing spatial dispersion of food supply
An increase in the average distances travelled by food products…
The transport distances of foods and agricultural products have risen by 17% and 32% respectively, since 1975 in France (similar rises in Germany and in the UK)
The international transport of agricultural and food products by French carriers almost tripled between 1975 and 1995.
…and an increase in the mean distances covered by road transport
The average distances travelled by truck have also risen since 1975, by around 50%
An increase in household mobility within cities
(due to a growing dissociation between places of residence, workplaces, places of food suppliers )For example, retail outlets are unevenly spread throughout the Île-de-France Region
WHY? Several reasons can be put forward to explain the increase in the average distances travelled by goods.
Changes in food consumption behaviours
As spatial concentration of the population (food demand) increases, more food needs to be transported to meet the needs of urban households,
Urbanisation, with a rise in income for a large share of the urban population, increases the food demand and the proportion of processed food products.
The economic geography has also evolved, because of: (i) scale economies and low transport costs
(ii) emergence of multinationals
(iii) change in logistical management.
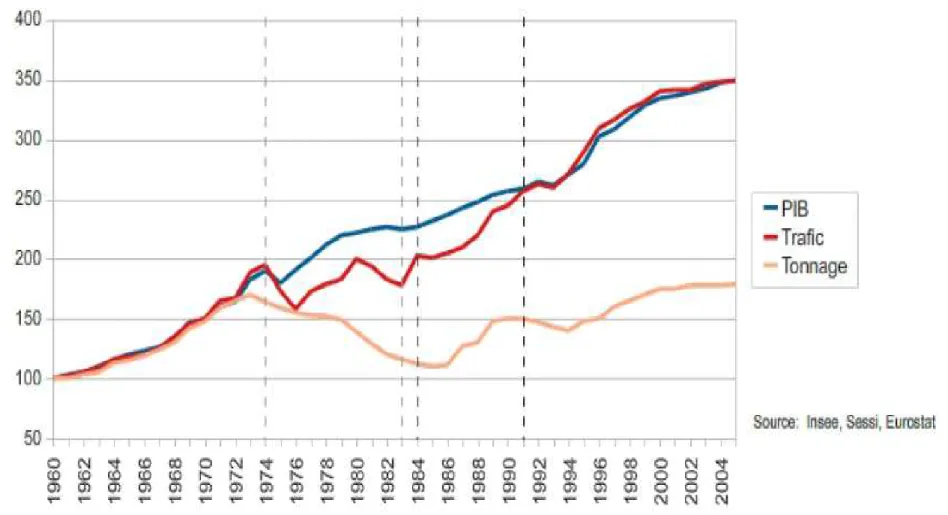
Illustration du poids des changements organisationnels (industriels et logistique) dans la hausse des distances parcourues
S
USTAINABLY FEEDING LARGE CITIES
:
N
EW
C
HALLENGES
Reducing greenhouse gas emissions
The transport of the yoghurt consumed in Paris accounts for one-third of the GHG emissions of this product (Rizet and Keita, 2005).
According to a report by the London Development Agency (2006), more than 40% of the city's carbon footprint can be attributed to its food system).
Managing rare resources (agricultural land, energy, water) Food and the health of the inhabitants of large cities
U
RBANIZATION
,
F
OOD AND
H
EALTH
Large cities are in the front line
Not only because they host the majority of the world's population. But also because many large cities (such as New York, London, San Francisco) have developed full-fledged food strategies,
WHY?
Development of unhealthy diets in large cities
Possible connection between patterns of urban land development, physical activity and weight
Empirical evidence
High obesity rates are correlated with low food prices and job-related
exercise, low time cost of food preparation, the prevalence of fast-food restaurants, ....
and to
urban sprawl
(Low density and distance to jobs)WHY? Urban sprawl
people drive more, exercise less, and gain weight
lead to traffic congestion and the diversion of time from activities such as exercising
RESULTS
Controlling for gender, age, race, education, smoking, and diet, several
empirical studies show that BMI is positively and significantly related to urban sprawl index (density and distance to jobs)
However, a positive
correlation
between sprawl and obesity does notnecessarily imply that sprawl
causes
obesity because people predisposed to obesity prefer living in sprawling neighborhoods (spatial sorting).A recent study show, after controlling this endogeneity bias, the changes in
neighborhood do not lead to changes in weight of individuals who choose a new place of residence.
Even if the size and the spatial structure of cities have no effect on the BMI of individuals,
large cities have allowed the development of unhealthy food
An example: The urbanization has induced the development of supermarkets.
A recent study published in Journal of Urban Economics, shows that, all things being equal, an additional Wallmart Supercenter per 100,000 residents
increases the obesity rate by 2.3%.
⇒ the proliferation of Walmart Supercenters explains 10.5% of the rise in obesity since the late 1980s.
Vers une régionalisation des systèmes
alimentaires ?
Facteurs favorables
Décentralisation de la politique alimentaire/agricole (Ville, quelle que soit la taille : de Lons-le-Saunier à New York City)
Mal/sur/sous-Nutrition Pollution locale et globale Sécurité Alimentaire
« valorisation » des produits locaux par les consommateurs « Meilleure » information/traçabilité
Hausse des prix de l’énergie
Couts de transport élevés = moins d’échange sur longue distance Valorisation des déchets
⇒
économie urbaine circulaireBilans écologique et énergétique contrastés
food miles vs modes de transport
food miles et conflits d’usage (foncier, eau, …)
⇒ intensification des
terres à proximité des villes
food miles vs. technologies plus ou moins polluante selon les
conditions locales de production (variant avec les changements
climatiques)
food miles au sein des bassins de production vs food miles entre les
bassins de production et de consommation
Flux de transport sont essentiellement sur des distances courtes (au
Travail « feeding the cities and the transport-related GHG emissions » en révision pour AJAE
Modèle d’économie géographique d’un système hiérarchique de ville avec du transport au sein des bassins de production agricole et entre bassin de production et bassin de conso (système dit « hub & spoke »).
Il est optimal (d’un point de vue écologique) de faire co-exister deux types de filières (local et global) ssi
-Le système local est adopté par les villes intermédiaires -Les rendements agricoles sont suffisamment élevés
-
Intérêt limité pour les « grandes » collectivités
locales
En France: Pour nourrir une personne : 0.33 ha en moy.
IDF: Environ 3 millions d’hectare de terre agricole sont nécessaires
SAU de IdF ~ 1/6ième des besoins en terre pour nourrir les franciliens
Diversifier leurs sources d’approvisionnement (local et global).
Favoriser l’agriculture locale pour une meilleure maîtrise de la qualité
vs capacité à mettre en place des filières locales Lons-Le-Saunier : env. 2760 repas par jr dans la rest. coll. IDF : Plus d’un million de repas par jour