HAL Id: hal-01224184
https://hal.archives-ouvertes.fr/hal-01224184
Submitted on 4 Nov 2015
HAL is a multi-disciplinary open access
archive for the deposit and dissemination of
sci-entific research documents, whether they are
pub-lished or not. The documents may come from
teaching and research institutions in France or
abroad, or from public or private research centers.
L’archive ouverte pluridisciplinaire HAL, est
destinée au dépôt et à la diffusion de documents
scientifiques de niveau recherche, publiés ou non,
émanant des établissements d’enseignement et de
recherche français ou étrangers, des laboratoires
publics ou privés.
The graph windowed Fourier transform: a tool to
quantify the gyrification of the cerebral cortex
Hamed Rabiei, Frédéric Richard, Muriel Roth, Jean-Luc Anton, Olivier
Coulon, Julien Lefèvre
To cite this version:
Hamed Rabiei, Frédéric Richard, Muriel Roth, Jean-Luc Anton, Olivier Coulon, et al.. The graph
windowed Fourier transform: a tool to quantify the gyrification of the cerebral cortex. Workshop on
Spectral Analysis in Medical Imaging (SAMI), Hervé Lombaert, Martin Reuter, Christian Wachinger,
Oct 2015, Münich, Germany. �hal-01224184�
The graph windowed Fourier transform: a tool to
quantify the gyrification of the cerebral cortex
H. Rabiei1,2,3, F. Richard3, M. Roth2, J.-L. Anton2, O. Coulon1,2, and J.
Lef`evre1,2
1 Aix-Marseille Universit´e, CNRS, LSIS, UMR7296, Marseille, France 2
Institut de Neurosciences de la Timone, UMR7289, Aix-Marseille Universit´e, CRNS, Marseille, France
3
Aix-Marseille Universit´e, CNRS, Centrale Marseille, I2M, UMR7373, 13453 Marseille, France
{hamed.rabiei;frederic.richard;muriel.roth}@univ-amu.fr {jean-luc.anton;olivier.coulon;julien.lefevre}@univ-amu.fr
Abstract. The Gyrification Index (GI) quantifies the amount of folding
of a cortical surface. In this paper, we show the efficiency of spectral analysis to perform such a task, and in particular we explain how the graph windowed Fourier transform can be used as a tool to define new GIs with multiscale properties. We propose two different GIs and study their effect on a set of subjects whose cortical surfaces are modeled with triangular meshes.
Keywords: gyrification index, spectral analysis, windowed Fourier transform,
Laplace-Beltrami operator, computational anatomy
1
Introduction
The human cerebral cortex, as a geometric object, has a highly convoluted shape. The study of this shape and its complexity is of great interest in order to under-stand normal and pathological cortical development but is made difficult by the very large inter-subject variability. Much research has been aimed to quantify the complexity of human cerebral cortex. To our best knowledge, the first quan-titative study [1] has been presented in 1961 in which the cortical folding was measured by using a surface ratio of the cortical surface area over the perimeter of the brain, measured on two-dimensional coronal sections. Zilles et al. [2] com-puted a global 2D gyrification index (GI) via the ratio of pial surface perimeter in a given coronal slice and the perimeter of its convex hull in that slice. Using 2D sections may cause a bias in perimeter mesurements because of slice orientation and some buried sulci might be ignored. Schaer et al. [3] argued that in addi-tion to slice orientaaddi-tion sensitivity, the standard deviaaddi-tion of results obtained by Zilles’s GI is too high to reveal group differences. By using 3D triangulated surfaces of the cerebral cortex, they extended the Zilles’s GI to a global 3D GI based on the area of cortical mesh and that of its convex hull. They also defined
a local version as the ratio between the area of regions of interest on the convex hull and that of corresponding regions on the pial surface. At the same time, Toro et al. [4] introduced a local measure of cortical folding through computing the surface ratio between a part of cerebral cortex contained in a sphere and the great circle of that sphere. Schaer’s and Toro’s GIs are conceptually similar and yielded similar results.
Nevertheless, these GIs based on comparing the surface areas may sometime fail in measuring the amount of folding. Indeed, by using these techniques, deep folds and a set of more shallow but oscillating folds with equal surface areas have an equal degree of folding while the latter is intuitively more folded (See Fig. 1(a)).
Another natural way to quantify the quantity of folding of a surface is its mean curvature. Normal curvatures measure the local bending of a surface in all directions and the mean curvature is the average of all these quantities. Mean curvature maps, however, are too local to deliver a helpful insight into the sur-face foldedness. Luders et al. [5] used a heat kernel smoothing filter to smooth the absolute mean curvature of the cerebral cortex in order to define a localized degree of folding but the resulting maps give a very low frequency information. Instead, in [6], a Fourier-like analysis was applied to the mean curvature of trian-gulated cortical surfaces. By binning the global frequency distribution in several frequency bounds and computing the dominant and the determinant bands, they derived two metrics of folding that can discriminate primary, secondary and ter-tiary folds.
In this paper, we pursue the same line of research and adapt a local spectral method, called graph windowed Fourier transform, to quantify the degree of folding of the cerebral cortex. In the following section, we present the windowed Fourier transform on graphs and show how it can be used to define relevant GIs. In Section 3, we present experiments on a set of 20 subjects.
2
Method
The surface of the cerebral cortex is a highly folded closed surface in IR3 which can be approximated by triangulation. The triangulated surface can be analyzed by the spectral theory which is based on the spectrum of the discretized Laplace-Beltrami operator associated with the triangle mesh.
Formally, let G ={V, E, w} be a triangulation where V is the set of vertices with V ={P1, P2, . . . , PN}, |V | = N < ∞, E is the set of edges and w : E → IR+
is the weight function which assigns a positive weight to each edge. Meyer et al. [7] established a discretization of Laplace-Beltrami operator based on linear finite element formula/finite volume method (Voronoi cell) on the triangulation:
(Lf )(Pi) = ∑ Pj∈N(Pi) −1 2A(Pi) ( cot(αij) + cot(βij) )( f (Pi)− f(Pj) ) , (1)
where N (Pi) is the set of vertices which are connected directly to vertex Pi,
Fig. 1. (a) Cross–section of deep folds (red curve) and wavy folds (green curve) with
equal areas in a neighborhood (black circle). By using the methods based on the ratio of areas, these deep and wavy folds have equal GIs! (b) Second row, right: a wavy rect-angle; from left to right, it becomes more folded. The color map represents the mean curvature of this surface. First row: frequency distributions of two vertices located in less and more folded regions (blue and red points, respectively). Second row, left: pro-posed gyrification indices (TP and TWP) for the vertices lie on the middle longitudinal line of the wavy rectangle
the angles opposite to the edge PiPj in two triangles sharing this edge. There
are also other discretization of the Laplaca-Beltrami operator on the mesh [8]. The discretized Laplace-Beltrami operator L is a positive semi-definite ma-trix with real eigenvalues 0 = λ1 < λ2 ≤ . . . ≤ λN and complete orthonormal
eigenvectors{χj}Nj=1in IR N
which serves as Fourier atoms on triangulation. In-deed, if f is a function defined on vertices of the triangulation, Fourier transform of this function is computed by ˆf (l) =⟨f, χl⟩ where the inner product is in IRN.
It gives global information about frequency distribution of the function i.e. it is local in frequency domain but global in spatial domain.
To have local information in time domain, in 1946, Gabor [9] introduced windowed Fourier transform to find the frequency distribution of sounds. Shu-man et al. [10] extended this transform to the graph setting by defining the generalized translation and modulation operators. In this method, a function is localized around a point in spatial domain by a window function and then the Fourier transform of this localized function is computed. The windowed Fourier transform on graph enables us to do a ”vertex-frequency” analysis. Specially, for analyzing highly complicated surfaces like human cerebral cortex, local analysis would be more reasonable to get useful morphometric information about the gyri and sulci in different scales.
The generalized translation operator Ti from IRN to itself of a function f ∈ IRN is defined as: (Tif )(n) := √ N N ∑ l=1 ˆ f (l)χl(i)χl(n), (2)
and the generalized modulation operator Mk from IRN to itself of a function
f ∈ IRN is defined as:
(Mkf )(n) :=
√
N f (n)χk(n). (3)
If g∈ IRN is a window function, then the windowed graph Fourier atom is
gi,k(n) := (MkTig)(n) = N χk(n) N ∑ l=1 ˆ g(l)χl(i)χl(n), i, k = 1, 2, . . . , N, (4)
and the windowed graph Fourier transform of a function f ∈ IRN is defined as Sf (i, k) := ⟨f, gi,k⟩ where i is the index of vertex and k is the index of
frequency. Inspired by classical windowed Fourier transform [11, section 4.2], the spectrogram |Sf(i, k)|2 explains the structure of graph function f in a vertex-frequency neighborhood of (i, k) characterized by Heisenberg box of gik. For
each vertex, the frequency distribution|Sf(i, k)|2vs. k delivers local information
about the function defined on the triangulation. We plan to extract some indices from these distributions to measure the amount of folding of a surface at different scales.
Given the mean curvature function on vertices of triangulation, the absolute value and variation of this function are increased in more folded regions. It increases the frequency powers [10, Theorem 2] and some higher frequencies appear in frequency distribution of this function (see Fig. 1(b)). Based on these observations, we propose two local indices of folding and explain why they can be potentially good representation of degree of folding.
1. Total Power (TP) of each vertex:
TP(i) =
N
∑
k=1
Sf (i, k)2. (5)
Thanks to Parseval’s identity, Shuman et al. [10, proof of Theorem 2] showed that
N
∑
k=1
Sf (i, k)2=√N∥f(Tig)∥22. (6)
In the above formula, Tig translates the window g to vertex Pi. So, based on the
property of window g, f (Tig), the component-wise multiplication of vectors f
and Tig, gives more weights to function value of vertices closer to Pi. It means
norm of f around Pj, then TP(i) > TP(j). Since in more folded regions the
norm of f (mean curvature) is increased, TP can be a good measure of folding. This measure, however, is blind to frequencies. In other words, TP does not discriminate general increase in frequency powers from local increase in higher frequency powers as they appear in frequency distributions of more folded regions. So we define a measure which gives more weights to higher frequencies.
2. Total Weighted Power (TWP) of each vertex:
TWP(i) = N ∑ k=1 ( λ k ∥Λ∥2 )2 Sf (i, k)2, (7)
in which, the weights are the Laplacian eigenvalues that are normalized by norm-2 of Laplacian spectrum Λ = (λ1, λ2, . . . , λN)T. This normalization is used to
remove the effect of size of the surface on weighting. In definition of TWP (7), both Laplacian eigenvalues and eigenvectors are involved. By investigating the above total weighted power of frequencies at vertex Pi we have
N ∑ k=1 ( λ k ∥Λ∥2 )2 Sf (i, k)2= ( 1 ∥Λ∥2 )2∑N k=1 λ2k|⟨f(Tig), √ N χk⟩|2 (8) = ( √N ∥Λ∥2 )2 ∥Lf(Tig)∥22, (9)
where (8) and (9) are obtained by definition of generalized modulation operator
Mk and Parseval’s identity respectively. Since Laplacian operator measures how
much a function differs at a point from its average value at neighbor points, (Lf Tig)(Pm) measures the variation of localized f at vertex Pmand so, TWP(i)
sums up all of these variations of localized f around vertex Pi.
One important feature of this method is existence of a free parameter, called
window size, which causes a locality tradeoff between frequency and spatial
do-mains. Actually, by utilizing a wider window in spatial domain, the function
f is localized in a larger neighborhood of each vertex and on the other hand,
the more local frequency distribution of the function in that neighborhood is obtained. Based on the Heisenberg’s Uncertainty Principle, it is not possible to have sharp localizations in spatial domain and in frequency domain at the same time. Using this property enables us to compute the GIs at different scales.
3
Results
The GIs defined above have been computed on a set of triangulated surfaces modelling left hemispheres of the cerebral cortex. We used 20 subjects for which a T1 anatomical Magnetic Resonance Image had been acquired at a spatial res-olution of 1× 1 × 1 mm3. Images were segmented using the Freesurfer software1.
1
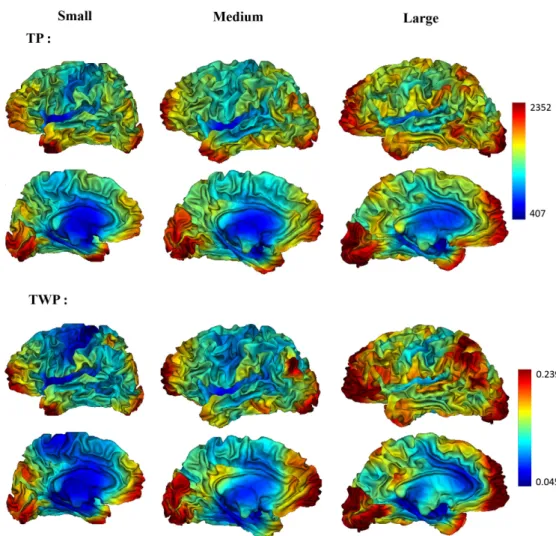
Fig. 2. Gyrification indices, TP and TWP, for 3 subjects with different sizes (the
volume of the white matter), lateral and medial views, with window size τ = 200
The white matter segmentations were then meshed using the BrainVisa soft-ware2, which resulted in triangular meshes with spherical topology and approxi-mately 50,000 nodes depending on the subjects. Inter-subject matching between all subjects was also computed using HIP-HOP method [12] in order to be able to perform group statistics. For each surface, the mesh Laplace operator (1) was computed as well as its first 5000 eigenvectors. The window function g was set to ˆg(l) = exp(−τλl) and is normalized to∥g∥2= 1 where the parameter τ > 0
determines the size of window – the lower τ the smaller (more local) window in
2
1.9 2.35 2.8 0.75 0.975 1.2 Volume(mL) normalized GIs normalized TP normalized TWP ×105 Equations of the fitted lines :
TP: y=2.1e−6x+0.51 , R2=0.76
TWP: y=4.0−6x+0.08 , R2=0.80
Fig. 3. Normalized average of gyrification indices TP and TWP vs. Volume of the
white matter for each subject, window size τ = 200
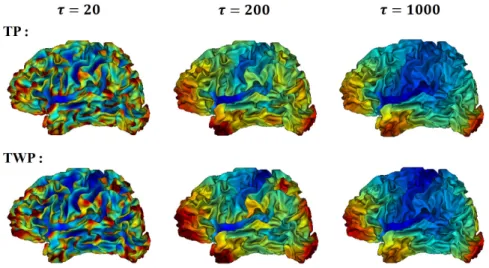
Fig. 4. Gyrification indices, TP and TWP, derived from 3 different window sizes (τ ),
for the surface of the smallest brain
the spatial domain. Indeed, by increasing l, the window function decreases and defines a kind of localization around each vertex.
The two GIs, TP and TWP, were then computed. They are presented in Fig. 2 for 3 different subjects with window size τ = 200. Visually comparing these maps suggests that the indices are fairly reproducible across the subjects. For instance, the regions with the highest values for TP and TWP are consistently
Fig. 5. Average of gyrification indices, TP and TWP, of all 20 subjects derived from
3 different window sizes (τ ) on the inflated surface of the first subject
the prefrontal cortex, some parts of the parietal lobe, the occipital lobe and the pole of the temporal lobe. The regions with the lowest values are also consistently the insula and the central sulcus. The central sulcus is a good example since it is a very deep fold but with a high regularity and straight shape where we expect a low measure of folding. The methods in [3, 4] give it a high gyrification index and we believe that it is a depth artefact as shown in Fig. 1(a), whereas both our GIs produce low values and are therefore able to differentiate depth from folding complexity.
In Fig. 2, subjects are ordered by increasing size (the volume of the white matter) from left to right. It is visible that the overall values of GIs are higher
for the largest brain. Indeed, the normalized average values of TP and TWP are increasing with brain volume, as shown in Fig. 3. For subject s, the average of TP(i)’s and TWP(i)’s are calculated by
TP(s) = ∑N i=1TP(i, s) N , (10) TWP(s) = ∑N i=1TWP(i, s) N . (11)
Then all TP(s)’s and TWP(s)’s are normalized by their mean value∑20s=1TP(s)/20 and∑20s=1TWP(s)/20. By this normalization, both TPs and TWPs are shifted into the same range while their behaviors are preserved. This increasing relation-ship between the volume of the white matter and total gyrification is expected and has been studied (see e.g. [4, 6]). Fig. 3 shows that TWP produces a larger effect than TP for this relationship and discriminates smaller brains from larger ones better than TP.
In Fig. 4, it is shown that the window size parameter τ can be used to control the scale of observations for the GIs. At τ = 20, the spatial scale is fine and high values are located mostly on the ridge of complex gyri, while low values are located on the walls of regular sulci. As the window size increases, a more regional effect becomes visible, with a very smooth and low variations map at value τ = 1000 , which gives a coarse scale global observation of the gyrification. Finally, we computed the group average of both GIs with τ = 20, 200, 1000 using the cortical surface inter-subject matching presented in [12]. Results are depicted on an inflated cortical surface in Fig. 5. They show average patterns similar to those observable on individual subjects, which shows that the GI’s spatial patterns are reproducible across subjects. Even on these group average maps, the scaling effect of the window size τ is visible, which shows that the inter-subject reproducibility still holds at fine scales to some extent.
4
Conclusion
In this work, we applied graph windowed Fourier transform on the mean cur-vature function of triangulated human cerebral cortex to assess the degree of folding. Based on the frequency distribution at each vertex of the triangulation, two gyrification indices have been proposed and we showed their relevance.
The proposed indices were computed for a group of cerebral cortices. The resulting maps suggest that the prefrontal cortex, some parts of the parietal lobe and the occipital lobe are consistently the most folded part of the brain. As expected, the insula and the central sulcus take the lowest values due to their high regularity compared to other regions. The relationship between average values of the indices and brain volume confirms that the larger brains are twistier. Moreover, changing the size of window function brings interesting information about the degree of folding in different scales.
For future works, we are going to apply this method on a large database to study the correlation between anatomical parameters and behavioral patterns on the quantity of gyrification of different regions of human cerebral cortex.
Acknowledgements
This work has been supported by the Labex Archimede (http://labex-archimede.univ-amu.fr). This work has been also partially supported by the Agence Nationale de la Recherche (ANR MoDeGy, ANR-12-JS03-001-01).
References
1. Jerison, H.J.: Quantitative analysis of evolution of the brain in mammals. Science. 133, 1012–1014 (1961).
2. Zilles, K., Armstrong, E., Schleicher, A., Kretschmann, H.J.: The human pattern of gyrification in the cerebral cortex. Anat. Embroyl. 179, 173–179 (1988). 3. Schaer, M., Cuadra, M.B., Tamarit, L., Lazeyras, F., Eliez, S., Thiran, J.P.: A
surface-based approach to quantify local cortical gyrification. IEEE. T. Med. Imag-ing. 27, 161–170 (2008) .
4. Toro, R., Perron, M., Pike, B., Richer, L., Veillette, S., Pausova, Z., Paus, T.: Brain size and folding of the human cerebral cortex. Cereb. Cortex. 18, 2352–2357 (2008). 5. Luders, E., Thompson, P.M., Narr, K.L., Toga, A.W., Jancke, L., Gaser, C.: A curvature-based approach to estimate local gyrification on the cortical surface. NeuroImage. 29, 1224–1230 (2006).
6. Germanaud D., Lef`evre J., Toro R., Fischer C., Dubois J., Hertz-Pannier L., Man-gin J.-F.: Larger is twistier: spectral analysis of gyrification (SPANGY) applied to adult brain size polymorphism. NeuroImage. 63, 1257–72 (2012).
7. Meyer, M., Desbrun, M., Schr¨oder, P., Barr, A.H.: Discrete differential-geometry operators for triangulated 2-manifolds. in Visualization and Mathematics III, Springer Berlin Heidelberg. 35-57 (2003).
8. Reuter, M., Biasotti, S., Giorgi, D., Patan`e, G., Spagnuolo, M.: Discrete Laplace-Beltrami operators for shape analysis and segmentation. Computers & Graphics. 33, 381-390 (2009).
9. Gabor, D.: Theory of communication. J. IEE. 93, 429–457 (1946).
10. Shuman, D.I., Ricaud, B., Vandergheynst, P.: A windowed graph Fourier trans-form. Statistical Signal Processing Workshop (SSP), 2012 IEEE, 5–8 Aug. 133–136 (2012).
11. Mallat, S.: A Wavelet Tour of Signal Processing, 2nd edition. Academic Press, 1999.
12. Auzias, G., Lef`evre, J., Le Troter, A., Fischer, C., Perrot, M., R´egis, J., Coulon, O. Model-driven harmonic parameterization of the cortical surface: HIP-HOP. IEEE Trans. Med. Imaging. 32, 873–887 (2013).