HAL Id: hal-01229005
https://hal.archives-ouvertes.fr/hal-01229005
Submitted on 11 Feb 2016
HAL is a multi-disciplinary open access
archive for the deposit and dissemination of
sci-entific research documents, whether they are
pub-lished or not. The documents may come from
teaching and research institutions in France or
abroad, or from public or private research centers.
L’archive ouverte pluridisciplinaire HAL, est
destinée au dépôt et à la diffusion de documents
scientifiques de niveau recherche, publiés ou non,
émanant des établissements d’enseignement et de
recherche français ou étrangers, des laboratoires
publics ou privés.
Natural cross-ventilation of buildings, an experimental
study
Hervé Pabiou, Julien Salort, Christophe Menezo, Francesca Chillà
To cite this version:
Hervé Pabiou, Julien Salort, Christophe Menezo, Francesca Chillà. Natural cross-ventilation of
build-ings, an experimental study. 6th International Building Physics Conference, Jun 2015, Turino, Italy.
�10.1016/j.egypro.2015.11.666�. �hal-01229005�
1876-6102 © 2015 The Authors. Published by Elsevier Ltd. This is an open access article under the CC BY-NC-ND license (http://creativecommons.org/licenses/by-nc-nd/4.0/).
Peer-review under responsibility of the CENTRO CONGRESSI INTERNAZIONALE SRL doi: 10.1016/j.egypro.2015.11.666
Energy Procedia 78 ( 2015 ) 2911 – 2916
ScienceDirect
6th International Building Physics Conference, IBPC 2015
Natural cross-ventilation of buildings, an experimental study
Hervé Pabiou
a*
*, Julien Salort
b, Christophe Ménézo
c,d, Francesca Chillà
baUniversité de Lyon, CNRS, CETHIL, UMR5008, F-69621, Villeurbanne, France b
Université de Lyon, CNRS, Ecole Normale Supérieure de Lyon, Laboratoire de Physique, 46 Allée d'Italie, F-69364 Lyon,France
c
Université de Lyon, INSA-LYON, CETHIL, UMR5008, F-69621, Villeurbanne, France
dChaire INSA/EDF, Habitats et Innovations Energétiques, Lyon, France
Abstract
Natural cross ventilation can be a promising passive solution for summer thermal comfort in buildings. It takes advantage of the night temperature of the air to cool the walls of the building. Although this technique is well-known in hot climate, its use in new buildings requires being able to predict the quantity of heat that can be dissipated. There is indeed a lack of experimental data either to build design rules for engineers or to validate numerical code dedicated to the design. In this study, experimental research is carried out on a full-scale dwelling and a small-scale model, and evidence is given on the relevance of such a comparison. The flow has been estimated with spatially discrete local sensors in both systems, and flow visualizations have been additionally performed in the small-scale controlled model. For windy periods, the indoor airflow is found to be driven by the wind, as expected. For calm periods which are critical for summer comfort, the flows look much more complex with the observation of unsteady flow reversals.
© 2015 The Authors. Published by Elsevier Ltd.
Peer-review under responsibility of the CENTRO CONGRESSI INTERNAZIONALE SRL.
Keywords: Natural ventilation; experimental airflow measurement; full-scale and small-scale analysis; flow reversal
1. Introduction
When one focuses on the environmental quality of building, ventilation is essential for sanitary reason to maintain acceptable levels of indoor air quality by removing pollutants. However ventilation used and sized appropriately could appear as a way to save energy. Indeed, during the summer this can be achieved by benefiting the
day/night temperature phase. This principle is not
*Corresponding author: HervéPabiou. Tel: +33 4 72 43 70 77.
Email: herve.pabiou@insa-lyon.fr
© 2015 The Authors. Published by Elsevier Ltd. This is an open access article under the CC BY-NC-ND license (http://creativecommons.org/licenses/by-nc-nd/4.0/).
2912 Hervé Pabiou et al. / Energy Procedia 78 ( 2015 ) 2911 – 2916
new and has been used for centuries till the industrial revolution when active HVAC systems have been introduced.
Free cooling by natural ventilation has been recently reintroduced by building designers. It is seen as a cost effective
alternative to conventional mechanical ventilation with air conditioning. Natural ventilation is driven by the
natural driving forces of wind or/and buoyancy. It can be generated by pressure difference induced by air density difference (stack effect) or by wind flowing around a building. However, the main barrier to assess free cooling performance is the prediction of the indoor airflow rate.A review on ventilation performance in buildings [1] gives the different methods used to predict the natural air flow and the heat transfer in buildings: analytical and empirical models; small-scale and full-scale experimental models; multi-zonal and zonal models and numerical. Among these methods, the last one is the most widely used because the evolution of Computational Fluid Dynamic (CFD) tools allows solving the conservation equations in large areas with a rather good accuracy for ventilation applications. But even if CFD may be a good tool to predict mean values, there are few data on fluctuating quantities as well as on the dynamics of the air flow. Concerning full-scale experiments, it is important to distinguish the controlled full-scale experiments in very large facilities from outdoor experiments. As an example, reference [2] shows measurements on a 5 m × 5 m × 3 m cavity in a wind tunnel at the Japanese Building Research Institute and experimental data are compared to CFD results. It is one of the rare studies that give some experimental data on fluctuating quantities and it is also one of the rare studies that give unsteady numerical results. Concerning measurements in real buildings, they are mainly used to validate CFD simulations. However, obtaining experimental data in real buildings is a challenge. Indeed, measuring low air flow through large openings is a tricky problem because hot wire anemometers classically used for low speed do not give any information on the direction of the flow and the flow direction may be different at the bottom and top level of the opening. Among the studies that address the measurement in real building, one can cite the work of Blondeau et al [3] that added a supplementary mechanical ventilation system in a university building to extract controlled large air flow during night which mimics natural ventilation through large openings. Concerning small-scale experimental approaches, most of them use liquid flows to reduce the size and investigated flow structures and stability [4]. Other studies investigate the cooling potential represented by the natural ventilation. This potential is estimated on a statistical analysis of the regional climate characteristics and leads to an estimate of the potential for energy savings [5].
In this paper, we investigate the difficult problem of measuring such flow rates which is characterized by small air velocities in large sections and in some cases the occurrence of an inflow and outflow through the same opening. Our approach is based on both the small-scale experimental models and full-scale experiments. The visualization of the flow on the small-scale model highlights flow structures that develop inside the dwelling. Specific sensors are respectively developed for the full-scale experiment and the small-scale experimental model.
Nomenclature
H height of the section D4 in the full-scale experiment (m) h height of the section D4 in the small-scale experiment (m) Q air flow rate (m3/s or ACH)
Q10min 10 min moving average of the air flow rate (m3/s or ACH)
<Q>W conditional mean air flow rate – see text for details (m3/s or ACH)
|Q|*W conditional rms value of the absolute air flow rate – see text for details (m3/s or ACH)
ReH,V0 Reynolds number for full-scale experiment based on H and V0
Reh,v0 Reynolds number for small-scale experiment based on h and v0
Si surface area associated to the velocity Vi (m2)
Vi velocity measured in section D4 at distance zi from the floor (m/s)
V0 spatial average of the velocity profile in the full-scale experiment for a wind Wn=2m/s (m/s)
v0 spatial average of the velocity profile in the SSMA (m/s)
Wn wind velocity perpendicular to the northern façade (m/s)
Wn 10min 10 min moving average of the wind velocity Wn (m/s)
wn wind velocity in front of section W1 in the wind tunnel (m/s)
2. Experimental approaches
2.1. Full-scale experimental model
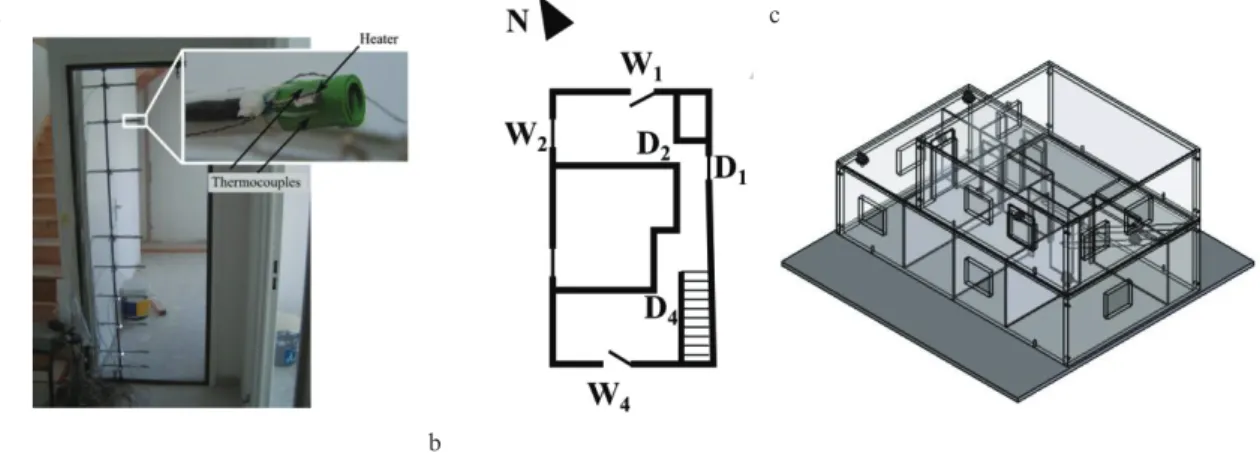
We performed measurements between the 7th and 28th of July 2010, in a new building in Lyon, France (Fig. 1a). The apartment was a duplex located on the top floor of a 10 floors building. The total floor area is 90.97 m2 including 33.52 m2 for the upper floor.
As we monitored the ventilation of the lower floor, the windows upstairs being closed, the air change per hour (ACH) is calculated with respect to the volume of the lower floor (155.1 m3). A scheme of the geometry of the lower floor is given on Figure 1(b).
Natural ventilation is created by opening the windows W1 and W4, the other ones being closed. The mechanical ventilation system was not activated and all air vents were sealed. The cross-ventilation flow rate and the indoor temperature are measured in the section D4 by 8 hot-wire anemometers. The direction of the flow is determined by 8 sensors designed at the laboratory presented below. A velocity direction sensor is constituted by a differential thermocouple that measures the temperature difference on both side of an electrical heater (Fig. 1a). The sign of the difference gives the flow direction which is supposed to be perpendicular to the test section. The heater is an electrical resistance of 22 Ω that dissipates 0.75 W. The temperature difference is measured with a differential K type thermocouple. The offset of the sensor is measured when the system is installed in the apartment, the sensor being put in a cavity to suppress the main air flow. The sign of the difference between the raw output and the offset gives the direction of the flow. The whole measuring was calibrated in a laboratory test room. The corrective coefficient used to obtain the flow rate from the integral of the 8 velocities is estimated to 0.68. Therefore, the formula used to calculate the flow rate is given by Equation 1.
(1) (2)
Where εi = ±1 is the sign of the direction of the flow, Vi is the magnitude of the velocity and Si is the corresponding area. A positive sign is a flow from window W4 to window W1 shown on Figure 1b. The range of the anemometers is [0.15 2] m/s. The uncertainty on the air flow rate is estimated to 25%.
Fig. 1. (a) Airflow measurement device in the dwelling. Zoom on the air flow direction sensor; (b) Scheme of the first floor of dwelling; (c) Schematic view of the small-scale model.
Data are collected by a digital multimeter Agilent 34970A at a rate of 1 sample/s for each sensor. Wind velocity (magnitude and direction) is measured on the roof of a neighbouring building at a rate of 6 samples/h that is imposed by the weather station.
2.2. Small-scale experimental model
The full-scale approach is complemented by measurements on a Small Scale Model of the Apartment (SSMA), with a scaling a b c 8 1
0.68
i i i iQ
¦
H
V S
2914 Hervé Pabiou et al. / Energy Procedia 78 ( 2015 ) 2911 – 2916
factor of 1:20 (Fig. 1c), within a wind tunnel. A hot-wire anemometer could be moved along the vertical axis in section D4. The SSMA has two floors but the upper floor was not used for the present study. The model is realized in PTG materials to allow visualization. The dimensions of the ground floor are 358 mm × 308 mm and 135 mm of height. Every windows and doors can be opened or closed independently, to study different flow configurations. As we are interested in the flow inside the apartment we do not need wind tunnel as large as those used to study flows around buildings. We use a wind source with a typical section larger than the entrance window. The typical diameter of the jet on the front of opening W1 is 10 cm which is enough to consider a homogeneous velocity profile in the 5 cm × 5 cm opening W1. It can produce wind which velocity varies between 1 and 30 m/s at the front of W1 with a turbulent intensity around 20%. The velocity at the window can be modulated by varying the distance to the nozzle so that the covered range of Reynolds numbers based on jet diameter at the entrance window is 102 – 104. Visualizations
are done by introducing smoke inside the SSMA with all windows closed until the smoke is homogeneously distributed inside the model, then W1 and W4 are opened simultaneously.
3. Results and discussion
3.1. Measurements in the real dwelling
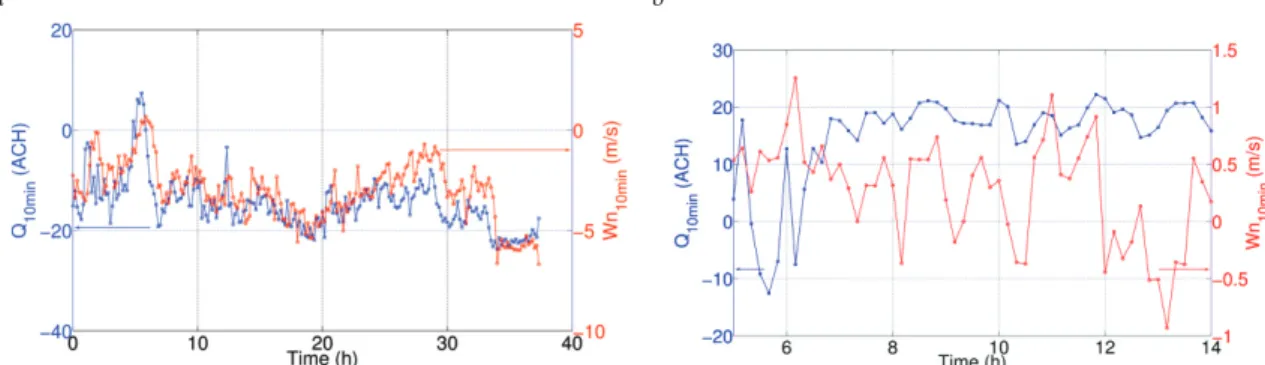
During windy period, air flow is expected to be driven by the wind. Figure 2a shows the air flow rate and wind velocity during a windy period. As the weather station gives a time-averaged wind every 10 min, the 10 min moving average of the air flow rate is plotted on Figure 2a.
a b
Fig. 2. Airflow rate and normal component of the wind speed (10min rolling average) during a windy period (a) and during a calm period (b).
The correlation between wind and air flow is obvious which can be seen as a validation of the full-scale airflow measurement system. During these periods, natural ventilation may be efficient provided that night temperature is sufficiently low. In this work we address the problem of the intensity of natural ventilation during calm period. Figure 2b shows wind and air flow rate during a calm period. Despite the lack of wind, a relatively high airflow rate is observed during 7h. This high value of the air change may be due to thermally driven flow, one façade being hotter than the other one. It can be also due to a residual pressure difference between the two façades due to a particular flow structure around the building. To analyze the relationship between wind and air flow, we calculated a conditional mean and rms values of the airflow rate. <Q>W is the average of the airflow rate measured when
the wind velocity Wn is within [W-0.1 W+0.1] m/s. |Q|*W is the corresponding rms of the absolute of the airflow rate.
Figure 3 shows <Q>W and |Q|*W for the whole set of data collected during one month. At the first glance, the airflow rate <Q>W
seems to be correlated to the wind in the whole range of the wind. Indeed, for large value of the wind (in our case, |Wn|>2 m/s), the
airflow is correlated to the wind at anytime. But, for low value of the wind, Figure 2b shows a sample where large airflow and low wind are observed at the same time during 7 consecutives hours. Indeed, <Q>W is calculated for the whole set of data with a
sufficient number of samples to converge. But it is no longer true for small period where the instantaneous flow rate may differ from the corresponding value of <Q>W as shown on Figure 2b. Concerning the rms value, Figure 3 shows |Q|*W is growing as
the absolute value of the wind increases. The growth is much steeper for the negative wind (from W1 to W4 in Figure 1b) which is linked to the geometry of the dwelling, the North to South direction being more favourable to wind-driven ventilation than the South to North direction. The non-zero value of the rms value at Wn=0 is due to the observation of rapid changes in the direction
of the airflow. Indeed, studying natural ventilation in a full-scale experiment is a tricky problem and we use a small-scale experiment to analyze the flow.
Fig. 3. Conditional mean (o) and conditional rms (Δ) of the air flow rate for the whole set of data (see text for details).
3.2. Comparison full-scale vs small-scale
To get useful information from a reduced scale model, one has first to address the problem of the similarity of the flow. There is no heater yet inside the SSMA, therefore the only relevant parameter, at this stage, is the Reynolds number. The wind velocity cannot be the relevant typical velocity because the SSMA is quite large with respect to the wind tunnel section. Hence, the actual indoor velocity is different from the external wind because of the influence of the wind tunnel walls, and also because of the pressure drop and the drag inside the dwelling.
a b c
Fig. 4. (a) Comparison of the shape of the velocity profiles in the dwelling and in the SSMA. Velocities are scaled by the bulk velocity (V0 =0.80 ms−1, v0 = 0.31 ms−1). (b) Visualization of the flow in the SSMA. (c) Ten consecutive instantaneous S-shaped
velocity profiles measured in the opening D4 during the sequence shown on Fig. 2a at time 12h.
The relationship between the indoor velocity and the wind is also complex for the real dwelling. As an example, velocity has been measured in section D4 with the same wind Wn = wn = 2 m/s. The corresponding velocity profiles are shown in figure 4a. In the
real dwelling the corresponding indoor bulk velocity is V0 = 0.80 m/s, while in the SSMA it is v0 = 0.31 m/s. How V0 and v0 relate
to Wn and wn is obviously non-trivial and may depend on the turbulent drag inside the building and thus on the Reynolds number.
Our aim is to analyze possible flow structures inside the dwelling for a given indoor velocity, and possibly yielding a sufficiently large Reynolds number for the flow features to be controlled by turbulent effects and only slimly by the Reynolds number itself: based on indoor parameters, ReH,V0 =104 and Reh,v0= 2.103 for the full-scale and small scale experiments, respectively.
Despite the substantial difference in the Reynolds numbers, the shape of the velocity profiles in Figures 4a looks similar, which suggests that indoor Reynolds numbers are high enough to produce an airflow independent on this number. Therefore, one may use the SSMA to visualize the flow, as shown in Figure 4b. It exhibits large flow structures that should exist in the real
2916 Hervé Pabiou et al. / Energy Procedia 78 ( 2015 ) 2911 – 2916
dwelling as well. In particular, one can see that the velocity direction in section D4 is not perpendicular to the opening, which may produce a bias on the flow rate measurement. Concerning, the observation of the flow during calm periods, flow visualization in the SSMA with very low wind show the existence of unsteady changes in the flow direction, even in the absence of any buoyant effect. This can be explained by the competition of several flow structures. In the full-scale experiment, flow reversals were observed during calm period (see Figure 4c). Unsteady changes of the flow direction appear in the measuring section and this may occur at the same time between the top and the bottom parts of the section which result in unsteady S-shaped or Z-shaped velocity profiles. To our knowledge, this is the first observation of reversal flows in real configuration. However, measurements are done along the vertical axis at the center of the opening. Therefore, one may not exclude the flow to be 3D and low air flow rate may not be reliable. This may be due to pressure fluctuations in front of each façade which would be consistent to the observations in the SSMA or to buoyant effects. In the full-scale experiment, the indoor temperature is measured in the center of the measuring section and the temperature difference with the outdoor temperature (around some degrees) has not been found to be well correlated with the appearance of flow reversals. This problem will be analyzed in the future by adding heaters in the SSMA.
4. Conclusions
In this work, we aimed to assess the flow rate inside a real dwelling for various external winds. To that end, a dedicated sensor has been developed granting access to the velocity, as well as the direction of the flow. This sensor was validated during windy periods where the indoor flow is fully controlled by the external forcing. To get more detailed information on the flow features within the complex geometry of an actual flat, one flexible approach is to build a small-scale model system. This system can reach high Reynolds numbers close to those of the real dwelling, while also granting access to well averaged local statistics in steady conditions and to the visualization of the flow features. The similarity was validated in the case of windy conditions and large scale structures have been characterized. They can be taken into account to remove possible bias on flow rate assessment. In addition, we were able to identify flow reversals in low-wind conditions, even without any thermal forcing. These may be due to the large scale structure and possible vortex shedding inside the dwelling.
Acknowledgement
The authors gratefully acknowledge the company Bouwfonds Marignan Immobilier for lending us the dwelling for this study. The authors thank the engineering office ENERTECH for the meteorological data. This work has been supported by the European project CONCERTO-RENAISSANCE - Project No.TREN/05/FP6EN/S07.51482/ 513477 and by the LABEX iMUST (ANR-10-LABX-0064) of Université de Lyon, within the program “Investissements d’Avenir” (ANR-11-IDEX-0007) operated by the French National Research Agency (ANR).
References
[1] Chen Q. Ventilation performance prediction for buildings: A method overview and recent applications. Building and Environment 2009; 44(4), p. 848858.
[2] Nikolopoulos N, Nikolopoulos A, Larsen TS, and Nikas KS. Experimental and numerical investigation of a naturally cross ventilated building. Energy and Buildings 2011; 43, pp. 13711381.
[3] Blondeau P, Sprandio M, and Allard F. Night ventilation for building cooling in summer. Solar Energy 1997; 61(5), pp. 327335. [4] Lishman B, Woods AW. The control of naturally ventilated buildings subject to wind and buoyancy. Journal of Fluid Mechanics
2006; 557, pp. 451472.