UNIVERSITÉ DU QUÉBEC
THÈSE PRÉSENTÉE À
L'UNIVERSITÉ DU QUÉBEC À TROIS-RIVIÈRES
COMME EXIGENCE PARTIELLE
DU DOCTORAT EN SCIENCES DE L'ÉNERGIE ET DES MATÉRIAUX
PAR PENG LYU
EFFECT OF MECHANICAL DEFORMATION ON HYDROGEN STORAGE PROPERTIES OF TIFE-BASED ALLOYS
Université du Québec à Trois-Rivières
Service de la bibliothèque
Avertissement
L’auteur de ce mémoire ou de cette thèse a autorisé l’Université du Québec
à Trois-Rivières à diffuser, à des fins non lucratives, une copie de son
mémoire ou de sa thèse.
Cette diffusion n’entraîne pas une renonciation de la part de l’auteur à ses
droits de propriété intellectuelle, incluant le droit d’auteur, sur ce mémoire
ou cette thèse. Notamment, la reproduction ou la publication de la totalité
ou d’une partie importante de ce mémoire ou de cette thèse requiert son
autorisation.
UNIVERSITÉ DU QUÉBEC À TROIS-RIVIÈRES
Cette thèse a été dirigée par:
Jacques Huot, Ph.D.
Directeur de recherche, grade
Jury d'évaluation de la thèse:
Jacques Huot, Ph.D. Prénom et nom, grade
Jacques Goyette, Ph.D. Prénom et nom, grade
Jean Hamelin, Ph.D. Prénom et nom, grade
Jinsheng Xiao, Ph.D. Prénom et nom, grade
Fusheng Yang, Ph.D. Prénom et nom, grade
Thèse soutenue le 12 juillet 2018
Université du Québec à Trois-Rivières Institution à laquelle se rattache l'évaluateur
Université du Québec à Trois-Rivières Institution à laquelle se rattache l'évaluateur
Université du Québec à Trois-Rivières Institution à laquelle se rattache l' évaluateur
Université du Québec à Trois-Rivières Institution à laquelle se rattache l'évaluateur
Wuhan University of Technology, China
Institution à laquelle se rattache l' évaluateur
Xi'an Jiaotong University, China
RÉsuMÉ
Cette thèse présente les propriétés de microstructure et de stockage d'hydrogène de
l'alliage TiFe dopé avec des éléments de transition et/ou traité par déformation
mécanique. Dans un premier temps, l'effet de différents additifs (Zr, Zr+2Mn, Zr+2V)
sur les propriétés de microstructure et d'hydrogénation de l'alliage TiFe a été étudié.
Pour l'additif Zr, trois compositions très similaires ont été investiguées: Tio.9sFeZro.os,
TiFeo.9sZro.os, et TiFeZro.os. On peut constater que tous ces alliages sont constitués
d'une phase de TiFe avec une petite quantité de zirconium et d'une phase secondaire
riche en zirconium. En même temps, on peut voir que la substitution partielle du
zirconium par le fer, le titane ou les deux améliore la première cinétique
d'hydrogénation du TiFe. La première hydrogénation de l'alliage Tio.9sFeZro.os se
déroule plus rapidement que pour les deux autres alliages. Ceci est probablement dû à
une distribution plus fine de la phase secondaire. Les isothermes pression/composition
des alliages TiFeZro.os et Tio.9sFeZro.os sont similaires alors que l'alliage TiFeo.9sZro.os
présente la plus grande capacité. Ces résultats démontrent qu'une très légère variation
de composition a un effet important sur la microstructure et les comportements de
stockage de l'hydrogène.
Pour l'additif (Zr+2Mn), chaque alliage était constitué de deux phases: une phase de
TiFe avec une très faible quantité de zirconium et de manganèse, et une seconde
phase avec une proportion plus élevée de zirconium et de manganèse. On peut
constater que la première cinétique d'hydrogénation augmente avec la quantité de
(Zr+2Mn). Ceci est probablement dû à la présence de la phase secondaire riche en zirconium qui agit comme une passerelle pour que l'hydrogène pénètre dans la phase
principale de TiFe. Les isothermes pression/composition montrent également que
l'augmentation de la quantité de (Zr+2Mn) diminue la pression du plateau
d'absorption. Pour une quantité de (Zr+2Mn) de 12 % en poids, l'exposition à l'air a eu
laminage à froid a un effet minimal sur la première cinétique d'hydrogénation du TiFe dopé avec un alliage à 4 % en poids (Zr+2Mn). En ce qui concerne l'additif (Zr+2V), chaque alliage était constitué de deux phases: une phase de TiFe avec une très faible quantité de zirconium et de vanadium, et une phase secondaire présentant une proportion plus élevée de zirconium et de vanadium. On a constaté que la première cinétique d'hydrogénation augmente avec la proportion de (Zr+2V). Cependant, la capacité réversible diminue avec la proportion croissante (Zr+2V). Après l'hydrogénation de l'alliage TiFe+ 12 % en poids (Zr+2V), deux types de phases hydrures coexistent: une structure orthorhombique avec un groupe spatial: Cmmm et une structure monoclinique avec un groupe spatial: P2/m. Après la déshydrogénation, la phase d'hydrure avec la phase P2/m et la phase de TiFe étaient présentes.
L'effet de la déformation mécanique (broyage à billes, laminage à froid et forgeage) sur la microstructure et les premières propriétés d'hydrogénation du TiFe dopé avec 4 % en poids de Zr ou 4 % en poids (Zr+2Mn) ont été étudiés. Tout d'abord, le dopage du TiFe avec 4 % en poids de Zr par broyage à boulets a réduit significativement la taille des particules et des cristallites, mais la plus grande partie de la réduction s'est produite pendant les 15 premières minutes de broyage. Le broyage à boulets a amélioré la cinétique initiale par rapport à l'échantillon moulé, mais la capacité a été réduite. La cinétique accrue était due à la réduction de la taille des cristallites avec le temps de broyage. Deuxièmement, le dopage de TiFe avec 4 % en poids de Zr par laminage à froid et forgeage a également réduit la taille des particules et des cristallites. Un échantillon laminé à froid avec un échantillon à 5 passages a montré la cinétique d'hydrogénation initiale la plus rapide mais la capacité totale a été réduite. La capacité maximale a également été réduite par forgeage. Enfin, l'utilisation de laminage à froid et de forgeage pour doper TiFe avec 4 % en poids (Zr+2Mn) a été étudiée. Le laminage à froid a réduit la taille des cristallites mais aucune réduction de la taille des cristallites n'a été mesurée dans le cas du forgeage. Un échantillon laminé à froid avec un échantillon à 1 passage montre la capacité la plus élevée et un échantillon laminé à froid avec un échantillon à 5 passages présente la cinétique
d'hydrogénation initiale la plus rapide. D'autre part, l'échantillon forgé n'a pas absorbé d'hydrogène.
ABSTRACT
This thesis presents the investigation on the microstructure and hydrogen storage properties of TiFe alloy doped with transition elements and/or processed by mechanical deformation. At first, the effect of different additives (Zr, Zr+2Mn, Zr+2V) on the microstructure and hydrogenation properties of TiFe alloy was studied. For the additive Zr, three very closely related compositions were studied: Tio.9SFeZro.os, TiFeo.9SZrO.Os, and TiFeZro.os. It was found that all these alloys are made of a TiFe phase with small amount of zirconium and a secondary phase which is zirconium rich. Partial substitution of zirconium for iron, titanium or both can improve the first hydrogenation kinetics of TiFe. First hydrogenation of Tio.9SFeZro.os alloy proceed faster than for the other two alloys. This is probably due to a finer distribution of the bright secondary phase. Pressure-composition isotherms of TiFeZro.os and Tio.9SFeZro.os alloys were similar while the alloy TiFeo.9SZrO.Os showed the highest capacity. These results demonstrated that a very slight variation of composition could have an important effect of microstructure and hydrogen storage behaviours.
In the case of the additive (Zr+2Mn), each alloy was made of two phases: a TiFe phase with very small amount of zirconium and manganese, and a second phase which had a higher proportion of zirconium and manganese. It was found that the first hydrogenation kinetics increase with the amount of (Zr+2Mn). This is most likely due to the presence of zirconium-rich secondary phase that acts as a gateway for hydrogen to enter the main TiFe phase. Pressure-composition isotherms also showed that increasing the amount of (Zr+2Mn) decreased the absorption plateau pressure. Moreover, for the amount of (Zr+2Mn) of 12 wt.%, air exposure had a minimal impact on hydrogen absorption behaviour. In addition cold rolling has minimal effect on the first hydrogenation kinetics ofTiFe doped with 4 wt.% (Zr+2Mn) alloy.
For the additive (Zr+2V), each alloy was made of two phases: a TiFe phase with very small amount of zirconium and vanadium, and a secondary phase which has a higher proportion of zirconium and vanadium. The first hydrogenation kinetics increased with the proportion of (Zr+2V) and the mechanism of first hydrogenation kinetics of
three alloys was in accordance with GB3D mode\. However, the reversible capacity decreased with increasing (Zr+2V) proportion. After the hydrogenation of the TiFe+12 wt.% (Zr+2V) alloy, two kinds ofhydride phases were found to coexist: one orthorhombic structure with space group: Cmmm and one monoclinic structure with space group: P2/m. After dehydrogenation the hydride phase with space group P2/m and Ti Fe phase were present.
The effect of mechanical deformation (bail milling, cold rolling and forging) on the microstructure and first hydrogenation properties of TiFe doped with 4 wt.% Zr or 4 wt.% (Zr+2Mn) alloy was also investigated. First, doping TiFe with 4 wt.% of Zr by bail milling significantly reduced the particle and crystallite sizes but most of the reduction occurred during the first 15 minutes of milling. Bali milling improved the initial kinetics compared with as-cast sample but the capacity was reduced. The increased kinetics was due to the reduction of crystallites size with milling time. Secondly, doping TiFe with 4 wt.% Zr using co Id rolling and forging also reduced the particle and crystallite sizes. Cold-rolled sample with 5 passes sample showed the faste st initial hydrogenation kinetics but the total capacity was reduced. The maximum capacity was also lowered by forging. Finally, using co Id rolling and forging to dope TiFe with 4 wt.% (Zr+2Mn) was studied. Cold rolling reduced the crystallite size but no crystallite size reduction was measured in the case of forging. Cold-rolled sample with 1 pass shows the highest capacity and cold-rolled sample with 5 passes sample presented the faste st initial hydrogenation kinetics. On the other hand, the forged sample didn't absorb any hydrogen.
FOREWORD
TiFe alloy is a kind of potential hydrogen storage material. But due to very high temperature and hydrogen pressure for its first hydrogenation, TiFe-based hydrogen storage materials are limited for practical applications. Recently researchers found that doping with transition elements and mechanical deformation can be used to improve the first hydrogenation performance of hydrogen storage materials. In that context, my Ph.D. project is to find a combination of alloy composition and mechanical deformation treatment to produce a low-cost TiFe-based alloy for practical applications. Besides, the objective is also to understand the fundamental mechanism of element substitution and mechanical deformation on hydrogen storage properties ofTiFe alloy.
ACKNOWLEDGEMENT
At first, 1 would like to express my deepest gratitude to my Professor Jacques Huot, for his guidance and 100 percent patience. 1 leamt a lot of precious spirit and attitude for research from him. 1 also want to express my sincere gratitude to Professor Jinsheng Xiao, for his valuable suggestions and encouragement during my PhD. 1 would like to thank Mrs. Can Tao, who helped me a lot when 1 started my PhD work in UQTR. 1 would like to thank Dr. Vinay Dixit, for her nice discussion and beautiful smile. 1 would like to thank Dr. Salma Sieiman, for her delicious food and great zeal. Many thanks to Dr. Abhishek Patel, 1 will always remember those days that we studied together. 1 also thank to Dr. Vola Raza for her insightful suggestions and unparalleled enthusiasm. 1 also thank to Dr. Jingjing Liu for her constructive suggestions and discussion on my thesis. 1 also thank Dr. Liang Tong, Dr. Marc-Antoine Pagé, Dr. Amol Kamble, Dr. Zhihai Zhang and Professor Feng Ye, who helped me a lot in my life. 1 wish to thank Mrs. Agnes. Lejeune for SEM analysis, Canadian light source for synchrotron. 1 am also very thankful to Fonds de recherche du Quebec-Nature et Technologies (FRQNT) for a PBEEE fellowship.
Finally, 1 want to express my sincere thanks to my parents and wife who had al ways supported me and encouraged me to finish my PhD.
TABLE OF CONTENTS RÉSUMÉ ... iii ABSTRACT ... vi FOREWORD ... viii ACKNOWLEDGEMENT ... ix LIST OF FIGURES ... xiii LIST OF TABLES ... xviii SECTION A ... 1 1. INTRODUCTION ... 2 1.1. CONTEXT ... 2 1.1.1. Hydrogen energy ... 2
1.1.2. Hydrogen storage ... 2
1.1.3. Metal hydrides ... 4
l.l.3.1. AB5 intermetallic compounds ... 5
l.l.3.2. AB2 intermetallic compounds ... 5
l.l.3.3. A28 intermetallic compounds ... 6
l.l.3.4. AB intermetallic compounds ... 7
1.104. Hydriding process ... 8
l.l.4.I. Absorption mechanism ... 8
l.l.4.2. Kinetic models ... 9
l.l.4.3. Thermodynamics ... Il 1.2. DOPING AND MECHANICAL DEFORMATION OF TtFE ALLOY ... 13
1.3. RESEARCH GOALS ... 14 lA. THESIS STRUCTURE ... 15 2. EXPERIMENTAL DETAILS ... 16 2.1. SYNTHESIS OF MA TERlALS ... 16 2.1.1. Arc melting ... 16 2.1.2. Bali milling ... 17 2.1.3. Cold rolling ... 17 2.104. Forging ... 18
2.2. CHARACTERIZA TION OF MA TERLALS ... 19
2.2.1. Sieverts-type apparatus ... 19 2.2.2. X-ray diffraction ... 20
2.2.3. Synchrotron ... 21
2.204. Scanning electron microscopy ... 23
3. EFFECT OF DIFFERENT ADDITIVES ON THE MICROSTRUCTURE AND HYDROGENATION PROPERTIES OF TIFE ALLOY ... 24
3.1.1. Results and discussion ... 24 3.1.1.1. Morphology ... 24 3.1.1.2. Structural characterization ... 31 3.1.1.3. First hydrogenation ... 32 3.1.1.4. Pressure-composition isotherms ... 33 3.1.2. Conclusion ... 33
3.2. MICROSTRUCTURE AND HYDROGENATION PROPERTIES OF TIFE DOPED WITH (ZR+ 2MN) AS ADDITIVE ... 35
3.2.1. Results and discussion ... 35
3.2.1.1. Morphology ... 35
3.2.1.2. Crystal structural characterization ... 41
3.2.1.3. First hydrogenation ... 42
3.2.1.4. Pressure-composition isotherms ... 43
3.2.1.5. Air exposure ... 44
3.2.1.6. Improving tirst hydrogenation kinetics by cold rolling ... 46
3.2.2. Conclusion ... 47
3.3. MICROSTRUCTURE EVOLUTION, PHASE TRANSFORMATION AND HYDROGENATION PERFORMANCE OFTIFE ALLOY DOPED WITH X WT.% (ZR+2V) ... .48
3.3.1. Results and discussion ... 48
3.3.1.1. Morphology ... 48 3.3.1.2. Structure characterization ... 52 3.3.1.3. First hydrogenation ... 55 3.3.1.4. Phase transformation ... 59 3.3.1.5. Pressure-composition isotherms ... 61 3.3.1.6. Cycling properties ... 62 3.3.1.7. Airexposure ... 65 3.3.2. Conclusion ... 69
4. EFFECT OF MECHANICAL DEFORMATION ON THE MICROSTRUCTURE AND FIRST HYDROGENA TION KlNETICS OF TIFE-BASED ALLOY ... 71
4.1. EFFECTOF BALL MILLING ON THE FIRST HYDROGENATION PROPERTIES OF TIFE ALLOY DOPED WITH 4 WT.% ZR AS ADDITiVE ... 71
4.1.1. Results and discussion ... 71
4.1.1.1. Chemical composition ... 71
4.1.1.2. Morphology ... 72
4.1.1.3. Crystal structure characterization ... 74
4.1.1.3. First hydrogenation ... 75
4.1.1.4. Kinetic models of tirst hydrogenation ... 78
4.1.2. Conclusion ... 79
4.2. EFFECT OF COLD ROLLING AND FORGING ON THE FIRST HYDROGENATION PROPERTIES OF TIFE ALLOY DOPED WITH 4 WT. % ZR AS ADDITIVE ... 80
4.2.1. Results and discussion ... 80
4.2.1.1. Morphology ... 80
4.2.1.3. First hydrogenation ... 83
4.2.1.4. Kinetic models of first hydrogenation ... 83
4.2.2. Conclusion ... 85
4.3. EFFECT OF COLO ROLLING AND FORGlNG ON THE FIRST HYDROGENATION PERFORMANCE OF TIFE ALLOY DOPED WITH 4 WT.% (ZR+2MN) AS ADDITTVE ... 86
4.3 .1. Results and discussion ... 86
4.3.1.1. Morphology ... 86
4.3.1.2. Crystal structure ... 87
4.3.1.3. First hydrogenation ... 88
4.3.1.4. Rate limiting step of tirst hydrogenation ... 89
4.3.2. Conclusion ... 91
5. CONCLUSION AND FUTURE WORK ... 92
5.1. CONCLUSION ... 92
5.2. FUTURE WORK ... 92
5.2.1. Study the dark and bright phases ofTiFe alloy doped with Zr+2Mn/Zr+2V ... 92
5.3. PERSPECTIVE ... 92 SECTION B ... 94 ARTICLES ... 95 ARTICLE 1 ... 96 ARTICLE 2 ... 103 ARTICLE 3 ... 112 REFERENCES ... 128
LIST OF FIGURES
Fig 1.l-Flow chart ofhydrogen from production to application ... 2
Fig 1.2-Crystal structure of the LaNi s alloy ... 5
Fig 1.3-Crystal structure of the TiCr2 alloy ... , ... 6
Fig l.4-Crystal structure of the Mg2Ni alloy ... 7
Fig 1.5-Crystal structure of the TiFe alloy ... 8
Fig 1.6-Seven steps of the hydrogenation process ... 8
Fig 1.7-Schematic representation of PCT curves of hydrogen-absorbing alloys .... 11
Fig 1.8-(a) Pressure-composition isotherm (PCT) covering the two-phase region of a metal hydride. (b) The Van't Hoff plot corresponding to the equilibrium pressure at different temperatures ... 13
Fig 2.1-Photo of arc melting machine ... .16
Fig 2.2-Spex 8000 baIl milling machine ... 17
Fig 2.3-Schematic of cold rolling process ... 18
Fig 2.4-Schematic of homemade forging system ... 19
Fig 2.5-Basic schematic diagram of Sieverts-type apparatus ... 20
Fig 2.6-Schematic diagram of Bragg diffraction ... 21
Fig 2.7-Schematic diagram of synchrotron system ... 21
Fig 2.8-0riginal image of LaB6 from synchrotron ... 22
Fig 2.9-Synchrotron pattern of LaB6 using GSAS-
II
software ... 22Fig 2.1O-Schematic of a whole scanning electron microscope system ... 23
Fig 3.1.1-Backscattered electron micrographs of Tio.9sFeZro.os, TiFeo.9sZro.os ano TiFeZro.os alloys prepared by arc melting ... 25
Fig 3.1.2-Backscattered electron micrograph of Tio.9sFeZro.os alloy prepared by arc melting with elements mapping ... 27
Fig 3.1.3-Backscattered electron micrograph of TiFeo.9sZro.os alloy prepared by arc melting with elements mapping ... 28
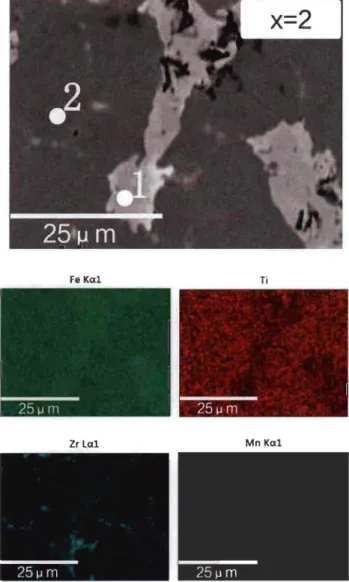
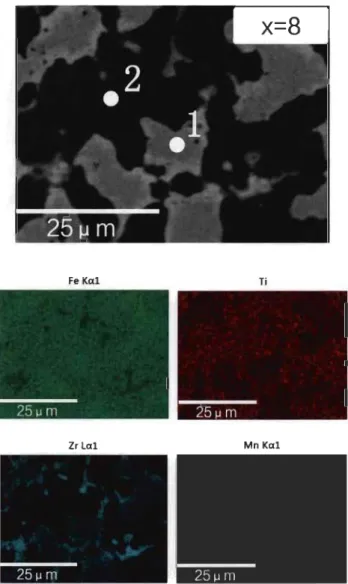
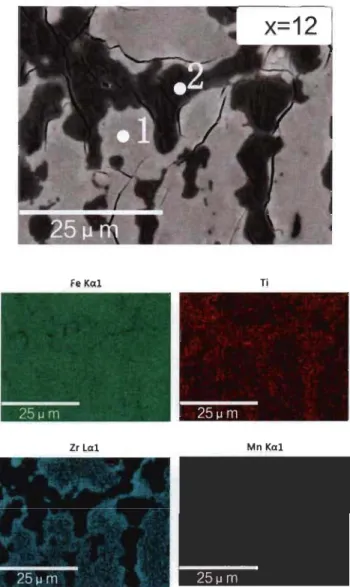
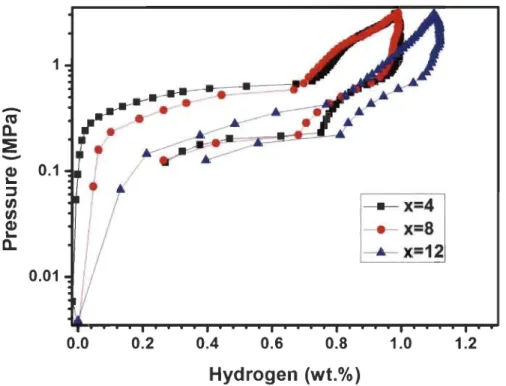
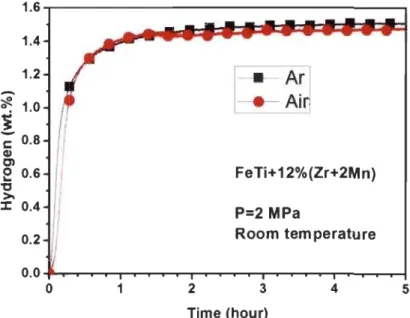
Fig 3.1.4-Backscattered electron micrograph of TiFeZro.os alloy prepared by arc melting with elements mapping ... 29 Fig 3.1.5-XRD of Tio.95FeZro.os, TiFeo.9SZrO.Os and TiFeZro.os alloys in as-cast state . .31 Fig 3.1.6-First hydrogenation behaviour of Tio.95FeZro.os, TiFeo.9SZrO.Os and TiFeZro.os alloys at room temperature under 2 MPa hydrogen pressure ... 32 Fig 3.1.7-PCT of Tio.9SFeZro.os, TiFeo.9SZrO.Os and TiFeZro.os alloys at room temperature ... 33 Fig 3.2.l-Backscattered electron micrographs of arc melted TiFe+x wt.% (Zr+2Mn) (x=2, 4, 8, 12) alloys ... 35 Fig 3.2.2-Backscattered electron micrograph of arc melted TiFe+2 wt.% (Zr+2Mn) alloy with EDX mapping and chemical composition at different sites ... 37 Fig 3.2.3-Backscattered electron micrograph of arc melted TiFe+4 wt.% (Zr+2Mn) alloy with EDX mapping and chemical composition at different sites ... 38 Fig 3.2.4-Backscattered electron micrograph of arc melted TiFe+8 wt.% (Zr+2Mn) alloy with EDX mapping and chemical composition at different sites ... 39 Fig 3.2.5-Backscattered electron micrograph of arc melted TiFe+ 12 wt.% (Zr+2Mn) alloy with EDX mapping and chemical composition at different sites ... .40 Fig 3.2.6-Powder diffraction patterns of as-cast TiFe+x wt.% (Zr+2Mn) (x=2, 4, 8, 12) alloys ... 42 Fig 3.2.7-First hydrogenation of TiFe+x wt.% (Zr+2Mn) (x=2, 4, 8, 12) alloys at room temperature under 3 MPa hydrogen pressure ... .43 Fig 3.2.8-Pressure-composition isotherms of TiFe+x wt.% (Zr+2Mn) (x= 4, 8, 12) alloys at room temperature. The highest pressure is 3 MPa for the absorption and the lowest pressure is 0.1 MPa for the desorption ... .44 Fig 3.2.9-First hydrogenation ofTiFe+12 wt.% (Zr+2Mn) alloys at room temperature un der 2 MPa hydrogen pressure ... .45 Fig 3.2.l0-Pressure-composition isotherms of TiFe+12 wt.% (Zr+2Mn) alloys for a sample handled in air and another one handled in argon protective atmosphere ... .45
Fig 3.2.11-First hydrogenation of as-cast and cold rolled TiFe+x wt.% (Zr+2Mn) (x=2(a), 4(b), 8(c), 12(d» alloys. Hydrogenation performed at room temperature
under 2 MPa of hydrogen. Hydrogen capacity is given in weight % (hydrogen
mass/mass of alloy) ... .46
Fig 3.3.1-Backscattered electron micrographs of TiFe+x wt.% (Zr+2V) (x=2, 4,8,12)
alloys prepared by arc melting ... 49
Fig 3.3.2-Relationship between the bright phase area (%) and x (wt.%) ... .49
Fig 3.3.3-Backscattered electron micrographs of TiFe+x wt.% (Zr+2V) (x=2, 4,8 and
12) alloy prepared by arc melting ... 51
Fig 3.3.4-XRD ofTiFe+x wt.% (Zr+2V) (x=2, 4,8, 12) alloys in as-cast state ... 52
Fig 3.3.5-Synchrotron pattern of TiFe+ 12 wt.% (Zr+2V) alloy in as-cast state ... 53
Fig 3.3.6-Refinement results of TiFe+12 wt.% (Zr+2V) alloy by TOPAS
software ... 54
Fig 3.3.7-First hydrogenation kinetics of TiFe+x wt.% (Zr+2V) (x=2, 4,8, 12) alloys
at room temperature under 2 MPa hydrogen pressure ... 56
Fig 3.3.8-First and second hydrogenation of TiFe+ 12 wt.% (Zr+2V) alloy at room
temperature under 2 MPa hydrogen pressure ... 57
Fig 3.3.9-Representative rate limiting step curves of first hydrogenation of TiFe+4
wt.% (Zr+2V) alloy at room temperatureunder 2 Mpa hydrogen pressure ... 58
Fig 3.3.10-Synchrotron radiation diffraction pattern. of hydrogenated TiFe+12 wt.%
(Zr+2V) alloy ... 59
Fig 3.3.11-Refinement results for synchrotron radiation diffraction pattern of
hydrogenated TiFe+ 12 wt.% (Zr+2V) alloy ... 60
Fig 3.3. 12-Refinement results for synchrotron pattern of TiFe+ 12 wt.% (Zr+2V) alloy
for dehydrogenation by TOPAS software ... 61
Fig 3.3.13-f?ressure-composition isotherm of TiFe+x wt.% (Zr+2V) (x=2, 4, 8, 12)
alloys at room temperature ... 62
Fig 3.3.14-Cyc1ing hydrogenation of TiFe+ 12 wt.% (Zr+2V) alloy at room
Fig 3.3. 15-Representative rate limiting step curves offifth hydrogenation ofTiFe+12 wt.% (Zr+2V) alloy ... 64 Fig 3.3.16-GB3D fitting curves of different hydrogenation cycles of TiFe+ 12 wt.%
(Zr+2V) alloy ... 65 Fig 3.3.17-First hydrogenation kinetics ofTiFe+ 12 wt.% (Zr+2V) alloy handled in air for different time at room temperature~ ... 66 Fig 3.3. 18-Representative rate limiting step curves of first hydrogenation of TiFe+ 12 wt.% (Zr+2V) alloy (exposure to air for 0.1 hour) ... 67 Fig 3.3. 19-GB3D fitting curves of first hydrogenation of representative TiFe+ 12 wt.% (Zr+2V) alloy for different air exposed time ... 68 Fig 3.3.20-Pressure-composition isotherm of TiFe+ 12 wt.% (Zr+2V) alloys at room temperature for different exposure time ... 69 Fig 4.1.1-Measured atomic abundance ofTiFe+4 wt.% Zr alloys in as-cast state ... 71 Fig 4.1.2-SEM micrographs of TiFe+4 wt.% Zr alloy taken in 100 magnification for as cast and different ball milling time (5, 15,30 and 60 min) ... 72 Fig 4.1.3-SEM micrographs of TiFe+4 wt.% Zr alloy taken in 2500 magnification for as cast and different ball milling time (5, 15,30 and 60 min) ... 73 Fig 4.1.4-Powder diffraction patterns of TiFe+4 wt.% Zr alloy for as cast and different ball milling time ... 74 Fig 4.1.5-First hydrogenation of TiFe+4 wt.% Zr alloy at room temperature under 4.5 MPa hydrogen pressure for different states ... 76 Fig 4.1.6-Relationship of total hydrogen capacity, crystallite size and baIl milling time ofTiFe+4 wt.% Zr alloy ... 77 Fig 4.1.7-Rate limiting step curves of first hydrogenation of representative TiFe+4 wt.% Zr alloy milled for 5 minute at room temperature under 4.5 MPa hydrogen pressure ... 78 Fig 4.2.1-SEM micrographs of TiFe+4 wt.% Zr alloy for different states (as-cast,
CR5, CRlO, CR15 and Forging) before and after hydrogenation ... 81 Fig 4.2.2-Powder diffraction patterns of TiFe+4 wt.% Zr alloy for different states ... 82
Fig 4.2.3-First hydrogenation at room temperature under 4.5 MPa hydrogen pressure of TiFe+4 wt.% Zr alloy for different states (as cast, cold rolling and forging in Air) ... 83 Fig 4.2.4-Rate limiting step curves offirst hydrogenation of TiFe+4 wt.% Zr alloy in different states at room temperature under 4.5 MPa hydrogen pressure ... 84 Fig 4.3.1-SEM micrographs of TiFe+4 wt.% (Zr+2Mn) alloy in different states ... 87 Fig 4.3.2-Powder diffraction patterns of TiFe+4 wt.% (Zr+2Mn) alloy for different states ... 87 Fig 4.3.3-First hydrogenation of TiFe+4 wt.% (Zr+2Mn) alloy in different state (as-cast in argon, cold rolling and forging in air) at room temperature under 2 MPa hydrogen pressure ... 89 Fig 4.3.4-Rate limiting step curves of first hydrogenation of TiFe+4 wt.% (Zr+2Mn) alloy in different states at room temperature under 2 MPa hydrogen pressure ... 90
LIST OF TABLES
Table 1.1-Three ways for storing the hydrogen ... .3 Table 1.2-Theoretical capacities and hydriding substances as storage media ... .4 Table 1.3-Rate limiting step model equations ... 10
Table 3.1.1-Percentage of bright and dark areas for Tio.9sFeZro.os, TiFeo.9sZro.os and TiFeZro.os micrographs shown in Fig 3.3.1. ... 25 Table 3.1.2-Bulk atomic abundance and nominal bulk atomic abundance as measured by EDX of Tio.9sFeZro.os, TiFeo.9sZro.os and TiFeZro.os alloys ... 26 Table 3.1.3-EDX analysis showing the dark phase element composition of Tio.9SFeZro.os, TiFeo.9SZrO.Os and TiFeZro.os alloys ... 30 Table 3.1.4-EDX analysis showing the bright phase element composition of Tio.9SFeZro.os, TiFeo.9sZro.os and TiFeZro.os alloys ... 30 Table 3.1.5-Lattice parameter a (in Â) of TiFe phase in as cast alloys as deterrnined
from Rietveld analysis. The number in parenthesis is error. ... 31 Table 3.2.1-Percentage of bright and dark phases area in as-cast TiFe+x wt.% (Zr+2Mn) (x=2, 4,8, 12) alloy asshown in Fig 3.2.1.. ... 36 Table 3.2.2-Nominal and measured bulk atomic abundance of TiFe+x wt.% (Zr+2Mn) (x=2, 4, 8, 12) alloys ... 36 Table 3.2.3-EDX of bright phase (point 1) of TiFe+x wt.% (Zr+2Mn) (x=2, 4, 8, 12)
alloys ... 40 Table 3.2.4-EDX of dark phase (point 2) of TiFe+x wt.% (Zr+2Mn) (x=2, 4, 8, 12)
alloys ... 41 Table 3.2.5-Lattice parameters a (in Â) of TiFe phase in as cast TiFe+x wt.% (Zr+2Mn) (x=2, 4, 8, 12) alloys as deterrnined by Rietveldanalysis. The number in parenthesis is error. ... 42 Table 3.3.1-Nominal bulk and bulk atomic abundance as measured by EDX of TiFe+x wt.% (Zr+2V) (x=2, 4, 8, 12) alloys ... 50 Table 3.3.2-Element composition of TiFe+x wt.% (Zr+2V) (x=2, 4, 8, 12) alloys in the dark phase (point 1) ... 51
Table 3.3.3-Element composition of TiFe+x wt.% (Zr+2V) (x=2, 4, 8, 12) alloys in the bright phase (point 2) ... 52 Table 3.3.4-Lattice parameters a and c (in A) and crystallite size (nm) of different phases in as cast TiFe+x wt.% (Zr+2V) (x=2, 4, 8, 12) alloys as determined by Rietveld analysis.The number in parenthesis is error. ... 54
Table 3.3.5-Mean atomic radius (in A) ofTiFe+x wt.% (Zr+2V) (x=2, 4, 8, 12) alloys
in as-cast state ... 55 Table 3.3.6-Adjusted R2 values for ail model equations of x=4 sample ... 58
Table 3.3.7-Lattice parameters a, band c (in A) of different phases in hydrogenated
TiFe+12 wt.% (Zr+2V) by Rietveld analysis.The number in parenthesis is error ... 60
Table 3.3.8-Adjusted R2 values for ail model equations of fifth hydrogenation
cycle ... 64
Table 3.3.9-Adjusted R2 values for all model equations of O.lh exposed
sample ... 67 Table 4.1.1-Lattice parameter a (in A) and crystallite size (nm) of TiFe phase of
TiFe+4 wt.% Zr alloy in different state as determined by Rietveld analysis. The
number in parenthesis is error. ... 75 Table 4.1.2-Total hydrogen capacity (wt.%) up to 5 hours and capacity retention Sn
(%) of TiFe phase of TiFe+4 wt.% Zr alloy in different
state ... 77
Table 4.1.3-Adjusted R2 values for all model equations of BM=5 min
sample ... 79 Table 4.2.1-Lattice parameter a (in A) and crystallite size (nm) of TiFe phase for TiFe+4 wt.% Zr alloy in different states as determined by Rietveld analysis. The
number in parenthesis is error. ... 82 Table 4.2.2-The best fit rate limitting step model for all samples ... 85
Table 4.3.1-Lattice parameter (in A) and crystallite size (nm) of TiFe phase for
TiFe+4 wt.% (Zr+2Mn) alloy in different bail milling time as determined by Rietveld
Table 4.3.2-Adjusted R2 values for ail model equations of ail samples .... ........ . 91
SECTION A
c7Je
z7r;rort"tnté é/U';y ln-1fê
ù éo hu-ve uJ'reué qzmf unr.fà/é aeéermlnuézon éo qftqzn z'é. - fch'unnVJI1,!fjru~
-von §oeéhe1. Introduction 1.1. Context
1.1.1. Hydrogen energy
Because of its high energy density, small environmental impact, light weight and
variety of means of production, hydrogen is considered to be a good energy carrier for
the renewable energies. First of ail, the potential sources of hydrogen are extensive
and hydrogen can be directly decomposed from water. Hydrogen can be produced
using green energy sources, such as nuclear, solar, hydro and wind energies. Second,
the gravimetric energy density of hydrogen is about 3 times of gasoline, 3.9 times of
alcohol and 4.5 times of coke. What's more, the product of combustion ofhydrogen is
pure water. Fig 1.1 shows a chart of hydrogen from the production to application. It is
clear that the hydrogen application is also very extensive. It can be easily used for
power generation, fuel cell electric vehicles, industrial processes and so on [1-3].
1
--
generation Power Fuel cell electric vehicles Industrial pro cessesFig 1.I-Flow chart ofhydrogen from production to application [4].
1.1.2. Hydrogen storage
In order to use hydrogen, sorne important key problems such as hydrogen production,
hydrogen purification, hydrogen storage, hydrogen transport and hydrogen utilization
need to be solved. Among them, how to store hydrogen safely and efficiently is an
solid and compressed gases [5, 6]. The advantages and disadvantages of three different storage means are shown in Table 1.1.
Table l.l-Three ways for storing the hydrogen [5,6].
Methods Liquid Compressed gas Solid Advantages High storage capacity 0.070 kg/L Simple and practical
0.030 kg/L Safe and high storage capacity
Disadvantages
High energy consumption and low temperature (-252.8 OC)
High pressure (350-700 bar) tank and bigger volume and weight of tank
High co st and complex synthesis
Considering operation temperature and pressure, safety and other factors, metal hydrides are considered to be excellent candidates for mobile and stationary hydrogen storage applications. The main advantages of storing hydrogen in a metal hydride are the high hydrogen volumetrie densities (usually higher th an in liquid hydrogen) and the possibility to absorb and desorb hydrogen over a smaU range of hydrogen pressure.
Table 1.2 presents the theoretical hydrogen storage capacities and hydriding substances as hydrogen storage media. From this table it can be seen that MgH2 shows the best gravimetric storage capacity (about 0.07 kg of H2 / kg of metal). However the hydrogenation kinetics of MgH2 is too slow and the decomposition temperature is too high (around 330 OC). Therefore searching new hydrogen storage materials and understanding the hydrogenation mechanism are still a scientific challenge.
Table 1.2-Theoretical capacities and hydriding substances as storage media [7].
Medium Hydrogen Hydrogen Energydensity, Energy
content, storage kJ/kg density,
kglkg capacity, kJ/L of kg/L of vol. vol. MgH2 0.070 0.101 9,933 14,330 Mg2NiH4 0.0316 0.081 4,484 11,494 VH2 0.0207 3,831 FeTiHI.9S 0.0175 0.096 2,483 13,620
TiFeo.7Mno.2HI.9 0.0172 0.090 2,440 12,770
LaNisH7.o 0.0137 0.089 1,944 12,630 MmNisH6.5 0.0135 0.090 1,915 12,770 Liquid H2 1.00 0.071 141,900 10,075 Gaseous 1.00 0.0083 141,900 1,170 H2(100bar) Gaseous 1.00 0.0166 141,900 2,340 H2(200bar) 1.1.3. Metal hydrides
ln metal hydrides, there is a bond between hydrogen and metallic atoms. ln these compounds, hydrogen occupies interstitial sites in the unit cell and forms a metallic bond with the metal. Metal hydrides can show sorne metallic characteristic properties such as high thermal and electrical conductivity, hardness and luster [7].
1.1.3.1. ABs intermetallic compounds
For ABs intermetallic compounds, many different elemental specles can be
substituted (at least partially) into the A and B lattice sites. Usually A is a
hydride-forming element and B is a non-hydride forming element [7]. LaNis is the
representative of ABs type hydrogen storage alloys as shown in Fig 1.2. This alloy
was found in Phillips laboratory in 1969 and has CaCus type crystal structure and
hexagonal lattice. It is well known that the first hydrogenation of ABs type hydrogen
storage alloy is fast at room temperature and under low hydrogen pressure with about 1.5 wt.% theoretical hydrogen storage capacity. Presently, this kind of hydrogen
storage alloy is mainly used for Ni-MH battery. In order to meet the requirements of
different applications, researchers have developed many LaNis-based hydrogen
storage alloys by replacing La or Ni with different elements.
Fig 1.2-Crystal structure of the LaNis alloy
1.1.3.2. AB2 intermetaLlic compounds
For AB2 compounds, A-elements can be one or more of titanium, zirconium, hafnium
and rare earth elements. Generally the B-elements can be one or more of vanadium, chromium, manganese and iron. This means that there are many different possible
substitutions for elements A and B [7]. The common representative AB2 alloy TiCr2 is
kinetics. However, they show very poor chemical properties in alkaline solution, so it
is not suitable for electrode materials.
Fig 1.3-Crystal structure of the TiCr2 alloy
1.1.3.3. A2B intermetallic compounds
C Ti
For A2B compounds, element A can be Mg, Hf, Ti and Zr. Element B can be Cu, Ca, La, AI, Ni and so on [7]. The representative A2B typed alloy is Mg2Ni as shown in Fig
1.4. In 1968 Reilly et. al found that Mg2Ni alloy can absorb 3.6 wt.% hydrogen at
around 250 oC [8]. It was found that the addition of the 3d elements could improve the hydrogen storage performance of the Mg2Ni alloy and decrease the temperature
and pressure of the first hydrogenation. For example, 3d elements can be used to
partly substitute for Ni. Actually different preparation methods (baIl milling, melt
spinning and spark plasma sintering) could be used to prepare Mg2Ni alloy. For
example, baIl milling is a good way to improve the hydrogenation properties of
Mg2Ni alloy due to the formation of amorphous and nanocrystalline microstructures
Fig l.4-Crystal structure of the Mg2Ni alloy
1.1.3.4. AB intermetallic compounds
Compared to ABs and AB2 compounds, AB intermetallic alloys have good volumetric and gravimetric reversible hydrogen storage capacities. Fig 1.5 shows a typical AB type hydrogen storage alloy TiFe. In 1974 Reilly et. al first reported that TiFe hydrogen storage alloy can absorb hydrogen at room temperature and under low hydrogen pressure [11]. This makes TiFe alloy a potential material for solid state hydrogen storage. However there are two main problems which restrict the practical application of TiFe alloy. One problem is its poor first hydrogenation kinetics which needs high temperature and pressure. In fact Reilly et. al also reported that the first hydrogenation of TiFe alloy could only be achieved through exposure to high temperature (673K) and high pressure (6~7 Mpa) [12]. The other problem is the air
sensitivity (such as O2, CO, H20). That is to say exposure to air will seriously affect
Fig l.5-Crystal structure of the TiFe alloy
1.1.4. Hydriding process 1.1.4.1. Absorption mechanism
It is generally believed that there are seven steps in the hydrogenation process. The
hydrogenation process mainly includes hydrogen molecular migration (step 1), interfacial diffusion (step 2) and physical adsorption (step 3), dissociation ofhydrogen molecules (step 4) and chemisorption (step 5), chemical reaction (step 6, Partly
hydrogenated and multifarious hydride phase) and hydride formation (step 7, Fully
hydrogenated), as shown in Fig 1.6 [13-15].
The dehydrogenation process is just opposite. Metal hydrides decompose at a certain temperature and ambient pressure. Hydrogen atoms diffuse to the surface of the alloy and recombine into hydrogen molecules.
1.1.4.2. Kinetic models
Usually, the rate limiting steps of hydrogen absorptionldesorption are one of those listed in Table 1.3 (Nucleation-growth-impingement model (JMA) [16-18], Contracting volume model (CV) [19-21] and Oinstling-Brounshtein model (OB) [22, 23]). In these equations, a is the reaction fraction (a=%Habsl%Hmax), t is reaction time,
and k is a constant. In order to find the correct kinetic model, the left side of these equations is plotted as a function oftime. For this type ofplot, the correct rate limiting step will be a linear curve [24].
Table 1.3-Rate limiting step model equations [24, 25]. Model name Chemisorption Nuc1eation-growth-impin gement model (JMA2D) Nuc1eation-growth-impin gement model (JMA3D) Contracting volume model (CV2D) Contracting volume model (CV3D) Ginstli ng-Brounshtein model (GB2D) Ginstling-Brounshtein model (GB3D)
Model equation where a
IS %Habsl%Hmax a=kt [-In( l-a)] 1/2=kt [-ln(l-a)] 1/3=kt (l-a)ln(l-a)+a=kt 1-(2aJ3 )-( l-a )2/3=kt Model description Surface controlled 2D growth of existing
nuc1ei with constant interface velocity 3D growth of existing
nuc1ei with constant interface velocity 2D growth of with constant interface velocity 3D growth of with constant interface velocity 2D growth, diffusion controlled with decreasing interface velocity 3D growth, diffusion controlled with decreasing interface velocity
1.1.4.3. Thermodynamics
In general, the hydrogenation and dehydrogenation process can be expressed by this following equation. 2 --MHx+ H 2 ( P,T 2 ) MHy+Q (1-1) y- x y-x
In this equation, M is the hydrogen storage alloy, MHx is the metal hydride,
Q
is the reaction heat, x is the hydrogen equilibrium concentration in the solid solution, y is the hydrogen concentration 10 the hydride (y>x). A schematicpressure-composition-temperature (PCT) curve is shown in Fig 1.7. From point A to B in PCT curve, hydrogen atoms gradually dissolve into the metal and form hydrogen-metal solid solution (a phase) with increasing the hydrogen pressure. At point B, the hydride phase (~ phase) nucleates. From point B to C, a and ~ phases coexist with increasing proportion of ~ phase as hydrogen concentration increases. According to Gibbs phase rule F=C-P+2 (F is the number of degrees of freedom, C is the number of components and P is the number of phases in thermodynamic equilibrium with each other), C only includes the metal and hydrogen. P includes a phase, ~ phase and hydrogen. So F=2-3+2=1. When the composition (C) changes the equilibrium pressure doesn't change. At point C, a phase totally transformed to the ~ phase and the degree of freedom is 2. After point C, hydrogen atoms dissolve into the metal hydride with increasing hydrogen pressure.
100 E
ro
CL B a+~ HlM Dc
1 Il 1 .... 1The Van't Hoff equation shows the relationship of the equilibrium constant Keq, T,
ideal gas constant R and the standard enthalpy change
m
e
.
A standard Van't Hoff equation can be written as equation (1-2):dlnKeq
=
m
e
(1-2)dT RT2
According to the definition of Gibbs free energy, we can obtain equation (1-3 and
1-4). 13.Ge is the standard Gibbs free energy change,
m
e
is the standard enthalpy change, Me is the standard entropy change and Keq is the equilibrium constantrespectively. T is the thermodynamic temperature, Peq is the equilibrium hydrogen
pressure at temperature T, Po is the standard atmospheric pressure (1 bar) and R is the
gas constant (8.3145 J / (K mo!) .
P
13.Ge
=
-RTInK=
RTIn~(1-4)eq P
o
Using equation (1-3 and 1-4), we obtain equation (1-5). It can be found that ln (Peq /
Po) and 1 / T are a strictly linear relationship in a certain temperature range.
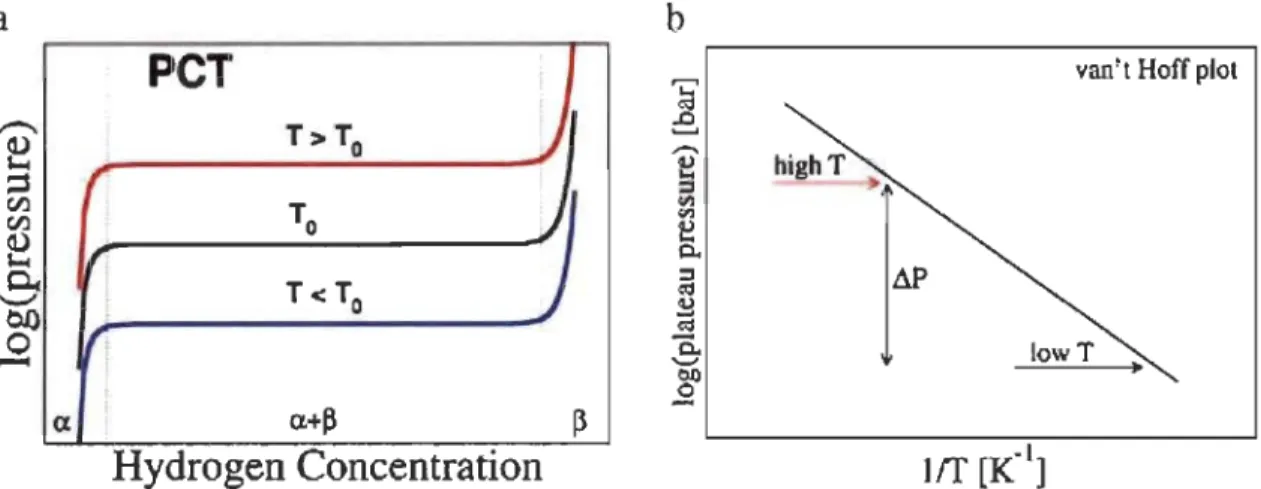
Fig 1.8 shows the relationship between peT and Van't Hoff curves of a metal hydride. Using equation (1-5), ln (Peq / Po) and 1 / T relationship diagram can be plotted as
shown in Fig 1.8 (b). Then we can calculate m e and Me using the slope and intercept of the straight line [27,28].
a
b
peT
van't Hoff plotT>To
)
1
r
J
I
To f ·)
T<To"
exa.+p
(lHydrogen Concentration
Fig 1.8-(a) Pressure-composition isothenn (peT) covering the two-phase region of a metal hydride. (b) The Van't Hoff plot corresponding to the equilibrium pressure at
different temperatures [29].
1.2. Doping and rnechanical deforrnation of TiFe alloy
TiFe alloy is one of the first metal hydrides that have been considered for hydrogen
storage and it is still a promising candidate for solid state hydrogen ·storage. However,
the practical applications are limited due to the slow first hydrogenation process
[30-32]. Therefore, there is a real need to find a way to improve the conditions of first
hydrogenation of TiFe alloys. Generally, one of the ways to improve the first
hydrogenation of TiFe alloy is to add sorne elements like transition metals and rare-earth metals [30, 33-37]. Another way is by preparing an ultra-fine
microstructure. Different methods have been applied to produce such microstructure.
They include melt spinning [38], bail milling [39-44], cold rolling [45] and high
pressure torsion [46, 47].
In an early investigation, Yang et. al found that adding a small amount of manganese
to TiFe alloy can improve the activation kinetics [30]. A few years later, Lee et. al
reported that substituting iron by chromium or manganese can lead to a higher first
hydrogenation rate, lower plateau pressure and higher maximum absorption capacity [35, 36]. This indicates that chromium and manganese play an important role on
changing the first hydrogenation of TiFe alloy. Later, Nishimiya et. al found that
zirconium substitution for titanium in TiFe alloy can lower the equilibrium pressure
zirconium content can increase the hydrogen capacity. Kumar et. al found that adding 3.1 mass % vanadium into TiFe alloy improves hydrogen absorption kinetics and the hydrogen storage capacity of TiFe is slightly decreased because of lattices expansion and the strong interaction between hydrogen and vanadium [37). Recently, Jain et al observed that adding 4 wt.% zirconium can shorten the incubation time of the first hydrogenation without changing the reversible storage capacity. Addition of Zr7NilO to TiFe also resulted in remarkable improvement in activation behaviour. This result indicates that Zr-based alloy may be good additives for TiFe alloy [49]. Ail of these studies show that sorne transition metals have a positive effect on the hydrogen storage properties ofTiFe alloy.
Concerning the effect of mechanical deformations, Zadorozhnyy et. al reported that nanocrystalline equiatomic TiFe intermetallic compound synthesized by mechanical alloying has a hydrogen capacity of about 1.4 wt. % at room temperature [41). Hoda et al found that the first hydrogenation of bail milled TiFe is improved and not sensitive to the air [50). This study shows clearly that there is a strong relationship between the microstructure of TiFe and its activation for hydrogen absorption. These results show that severe plastic deformation and bail milling could be good ways to improve the hydrogenation properties of TiFe and TiFe-based alloys.
1.3. Research goals
The goal of my PhD was to investigate the hydrogen storage behaviour of TiFe alloy doped with transition elements and/or processed by mechanical deformation. The ultimate goal was to find a combination of alloy composition and mechanical deformation treatment that will produce a low-cost hydride suitable for practical applications. The objective was also to understand the fundamental mechanism of element substitution and mechanical deformation on hydrogen storage properties of TiFe alloy.
1.4. Thesis structure
In this thesis, the experimental details are presented in chapter 2. Chapter 3 covers the effect of different additives on the microstructure and hydrogenation properties of TiFe alloy. More specifically, in section 3.1 the investigation on the addition of zirconium is exposed. Sections 3.2 and 3.3 are respectively on the effect of adding (Zr+2Mn) and (Zr+2V).
The effect of mechanical deformation on the first hydrogenation behaviors of TiFe alloy with 4 wt.% Zr and (Zr+2Mn) as additive is discussed in chapter 4. This investigation helps us to comprehend the relationship between defects and nanocrystallinity with hydrogenation kinetics.
2. Experimental details 2.1. Synthesis of materials
All pure elements Fe (99.9%), Ti (99.9%), Zr (99.5%), V (99.9%) and Mn (99.9%)
were purchased from Alfa Aesar and used without further purification. The alloys
were prepared by arc melting in Ar atmosphere. Each pellet was melted and tumed
over three times in order to insure homogeneity. Milling was performed on as-cast
alloys using hardened stainless steel and balls. Loading of the crucible was done in an
argon-filled glovebox. Milling was performed for 15, 30 and 60 minutes using a
SPEX 8000M apparatus. The ratio of the mass of balls to mass of powder was 10/1
and the milling vibration speed was 1725 rpm. Cold roIling was do ne in air for
different numbers of roIling passes using a Durston DRM 100 rolling mil!. Forging
was also done in air for five times using a homemade apparatus.
2.1.1. Arc melting
In this research, aIl aIloys were synthesized using the arc melting machine shown in
Fig 2.1. This arc melting machine is made of an electric arc welder, chamber, vacuum
system, inert gas system and water system.
2.1.2. Bali milling
Bali milling is a widely used as a laboratory method for preparing hydrogen storage materials. During the bail milling process the particles are flattened by the compressive forces which come from the coll ision of the balls and the particle size is reduced. At the same time, fracturing and cold welding also play an important role in the milling process [51]. In addition the milling process also can increase the specifie surface area of materials and create a lot of defects which can improve the absorption
and desorption kinetics of materials. In this research the powder mixture was placed
inside a crucible with hardened steel balls. Fig 2.2 shows the ball milling machine used in this research.
Fig 2.2-Spex 8000 bail milling machine.
2.1.3. Cold rolling
Rolling techniques could be c1assified in two types: hot rolling (HR) and co Id rolling (CR). In hot roUing the rolling process is done at a temperature higher than the recrystallization temperature. In cold rolling (CR) the process is carried out at a temperature below the recrystallization temperature [52]. In this research, only cold rolling was investigated.
In a cold rolling process, samples are introduced between two rollers where they are compressed as shown in Fig 2.3. In this research, a whole pellet was crushed into sorne small pieces using a mortar in order to reduce the size of particles sufficiently to be processed by cold rolling. Then these particles were put between two stainless steel plates and introduced in the rolling machine. After rolling, a plate or sheet of the sample was formed. In order to make more rolling passes (l, 5, 10 and 15) the above operation was repeated.
Roller
Metal plate
-
--~
...
~
Fig 2.3-Schematic of cold rolling process.
2.1.4. Forging
In forging, a mass and a forging die are necessary. Fig 2.4 shows diagram schematic of a whole forging system that includes rope, pulley, hammer, piston, forging die and steel protection. During the forging pro cess a big hammer is raised above the die and released directly on the piston of the die. The amount of energy depends only on the weight and height of the hammer and the forging time. By adjusting the height of the hammer and the number of forging passes, defects can be created and the crystallite size can be reduced. In this research, the number of forging passes was 5 times and the height of the hammer (23 kg) was 1 m.
Piston
/Hammer
Steel protection
Forging sam pie
.._______Forging die~
Fig 2.4-Schematic ofhomemade forging system.
2.2. Characterization of materials
The crystal structure of the samples was determined by X-ray diffraction (XRD; Bruker D8 Focus; Cu Ka radiation). Lattice parameters were evaluated from Rietvelcl method using TOPAS [53, 54] or GSAS [55-57] software. The hydrogen storage properties were measured by using a home-made Sieverts-type apparatus. Microstructure and chemical analysis were performed using a JEOL JSM-5500 scanning electron microscopy (SEM) equipped with an EDX (Energy Dispersive X-Ray) apparatus from Oxford Instruments. The percentage area of different phases in SEM micrographs was analyzed by image J software [58, 59].
2.2.1. Sieverts-type apparatus
In this research, the hydrogen absorption and desorption measurements were carried out on a homemade apparatus that is based on Sieverts method. Fig 2.5 shows a basic schematic diagram of Sieverts-type apparatus that is made of hydrogen cylinder, valve (A, Band C), pressure gage, vacuum pump and two calibrated volumes (V, and V2) [60]. During the measurement the temperature is stable, so according to the ideal gas equation (PV=nRT) the following equation can be written:
Lln
=
PlV, P2(V,+V2)In this equation Z/,T and Z2,T are compressibility coefficients under PI and T and P2
and T. n is mole number of absorbed hydrogen. R is universal gas constant. T is the
temperature.
H2=Ü
.
/
Vacuum pump
Sample
Fig 2.S-Basic schematic diagram of Sieverts-type apparatus [60].
2.2.2. X-ray diffraction
X-ray diffraction (XRD) is a corn mon technique to identify the crystal structure of materials. X-ray diffraction is based on constructive interference of monochromatic X-rays and a crystalline sample. Equation (2-2) is the Bragg equation that relates the wavelength of electromagnetic radiation and the diffraction angle to the lattice parameters in a crystalline sample [61].
2dsin8
= nÀ
(2-2)
Fig 2.6 shows the schematic diagram of Bragg diffraction. When Bragg's Law is
satisfied, the constructive interference of monochromatic X-rays and a crystalline sample happens. Then the scanning detector will pick up a Bragg reflection at this
angle. The inter-layer spacings of atoms (d) can be ca\culated according to the
positions of these reflections [62].
Each substance has its own specific crystal structure and lattice parameters. Analysis of the diffraction pattern helps us to identify the phase using important information obtained from the diffraction pattern, for example the crystallil)ity, lattice parameters, crystallite size, microstrain and so on [63].
dsin8
•
•
•
•
•
Fig 2.6-Schematic diagram of Bragg diffraction [64].
2.2.3. Synchrotron
A synchrotron is a particular type of accelerator, descended from the cyclotron, in which the accelerating charged partic\e beam travels around a c\osed-Ioop path.
The magnetic field which bends the partic\e beam into its c\osed path increases with time during the accelerating process, being synchronized to the increasing kinetic energy of the partic\es [65].
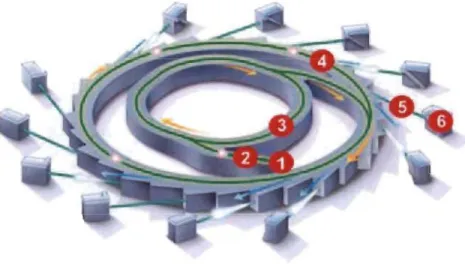
Fig 2.7 shows a typical synchrotron machine. A Synchrotron consists of the electron gun (1), linear accelerator (2), booster ring (3), storage ring (4), bending magnets (not shown in Fig 2.7), beam lines (5) and the end stations (6). In this research 1 used the synchrotron radiation for diffraction from Canadian Light Source (CLS).
A typical diffraction image obtained from synchrotron is shown in Fig 2.8. It can be
seen c1early that there are sorne annulus which imply LaB6 phase.
E E vi ·x
'"
80 >. CIl en'"
.§ 60 40 160 20 a Image x·axis, mmFig 2.8-0riginal image of LaB6 from synchrotron.
In order to know the detailed phase content, lattice parameters and crystal structure,
GSAS-
II
software was used to convert the original image into corn mon curves. Fig2.9 shows the synchrotron pattern of LaB6 using GSAS-
II
software.350 300 250 200 ;:" :';:l CI) ~ cu 150 .... .E; 100 50 0 -50 0
PWDR LaB6_Zr_edge.SOOO.N038.25170_003.tif Azm= 0.00(1)
5 + + + :j: + la t 15 20 2fJ 25
2.2.4. Scanning electron microscopy
A scanning electron microscope (SEM) can produce images of a sample by scanning the surface with a focused beam of electrons. The electrons interact with atoms in the sample, producing various signaIs that contain information about the sample's surface topography and composition [67].
A SEM apparatus consists of three parts: vacuum cham ber, electron beam and imaging system. Fig 2.10 shows a typical schematic of a whole SEM apparatus. Based on the interaction between electron and matter, SEM uses a beam of high energy electrons generated by an electron gun to focus on the surface of material using magnetic lenses. When the surface of the material is bombarded with high energy electron beam, the excited region will produce various kinds of electrons (such as secondary electrons, auger electrons, backscattered electrons and transmitted electrons). Secondary electrons are used to study the morphology and topography of samples and backscattered electrons are sensitive to contrasts in multiphase sampi es [68].
SEM layout and function
Electron detector
Amplifier
Image builds up scan by scan of the beam and line by line on the screen
3. Effect of different additives on the microstructure and hydrogenation properties of TiFe alloy
3.1. Hydrogen storage properties of Tio.9SFeZro.os, TiFeo.9SZrO.Os and TiFeZro.os
alloys
In a previous work, it is found that adding 4 wt.% zirconium to TiFe alloy can improve the first hydrogenation kinetics [70]. This investigation showed that a small amount of zirconium (about 1 atomic %) is in solid solution in the main TiFe phase while the abundance of zirconium is much higher in the secondary phase. This raised the question of the localization of zirconium in the TiFe matrix. Does zirconium substitute on the titanium or the iron site or goes in sorne interstitial site? To answer this question the microstructure and hydrogen storage properties of three closely related compositions: Tio.9SFeZro.os, TiFeo.9sZro.os and TiFeZro.os have been investigated.
3.1.1. Results and discussion
3.1.1.1. Morphology
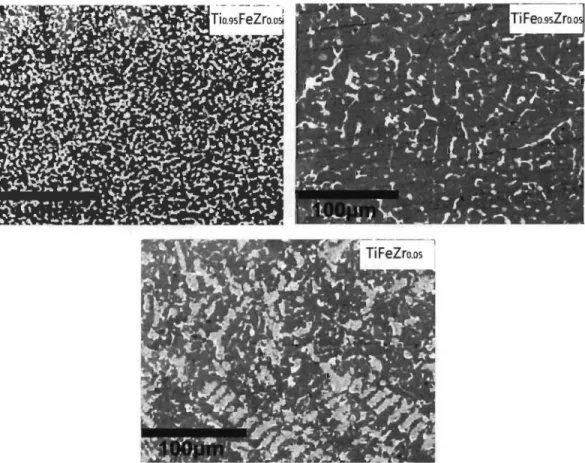
Fig 3.1.1 shows backscattered electron micrographs of Tio.9sFeZro.os, TiFeo.9sZro.os and TiFeZro.os alloys prepared by arc melting. Surprisingly, even if the compositions are very similar, they have totally different microstructure.
Fig 3. 1. I-Backscattered electron micrographs of Tio.9SFeZro.os, TiFeo.9SZrO.Os and
TiFeZro.os alloys prepared by arc melting.
U sing image J software, the bright and dark phase areas were computed and the
numerical values are reported in Table 3.1.1. It is found that the bright phase surface
area is much lower in the TiFeo.9SZrO.Os sample than the other two compositions.
Table 3.1.1-Percentage of bright and dark areas for Tio.9SFeZro.os, TiFeo.9SZrO.Os and
TiFeZrO.05 micrographs shown in Fig 3.3.1.
Phase Tio.9SF eZro.os TiF eO.9SZrO.Os TiFeZro.os
Bright (%) 37 Il 31
Dark (%) 63
89
69In order to know the chemical composition of the bright and dark phases, EDX measurement was performed on each alloy. First, the bulk atomic abundance was
reported in Table 3.1.2. It is clear that the atomic % of all elements are very close to the nominal composition.
Table 3.1.2-Bulk atomic abundance and nominal bulk atomic abundance as measured by EDX of Tio.9sFeZro.os, TiFeo.9sZro.os and TiFeZro.os alloys.
Sample Ti(at.% ) Fe(at.% ) Zr(at.% ) Nominal 47.5 50.0 2.5 Tio.9sFeZro.os composition Measurement 47.0 50.3 2.7 Nominal 50.0 47.5 2.5 TiFeo.9sZro.os composition Measurement 51.3 45.8 2.9 Nominal 48.8 48.8 2.4
TiFeZro.os composition
Measurement 47.3 49.7 3.1
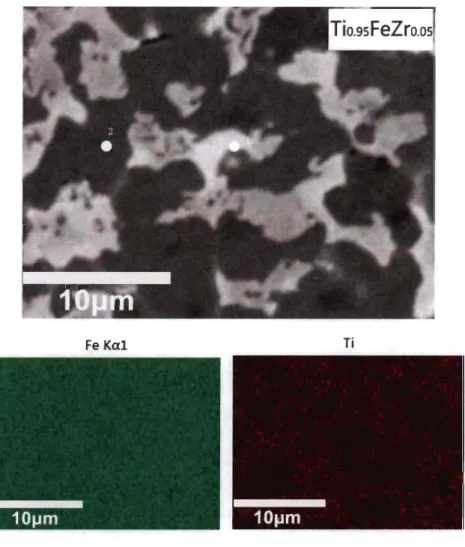
Second, the atomic composition of the dark and bright phases of each alloy was measured. The microstructure and element mapping of Tio.9sFeZro.os alloy are shown in Fig 3.1.2. It is clear that zirconium is concentrated in the secondary phase and iron and titanium are evenly distributed.
Fe Kal Ti
Zrlal
Fig 3.1.2-Backscattered electron micrograph of Tio.9sFeZro.os alloy prepared by arc
melting with elements mapping.
The elemental distribution of TiFeo.9sZro.os alloy is presented in Fig 3.1.3. As for the
preceding composition, zirconium is mainly located in the bright phase. However,
iron is slightly depleted in the bright phase. That is confirmed by the quantitative
Fe Kal Ti
Zr Lal
Fig 3.1.3-Backscattered electron micrograph of TiFeo.9sZro.os alloy prepared by arc melting with elements mapping.
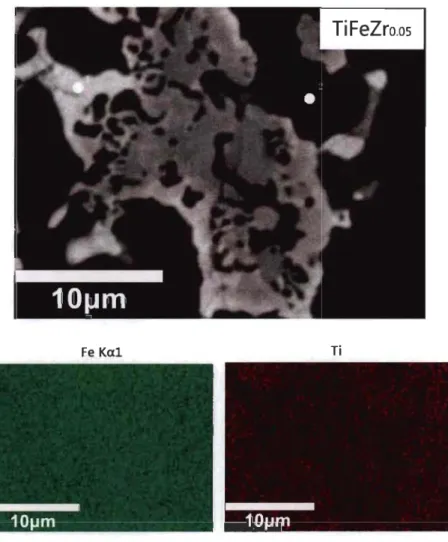
Fig 3.1.4 shows the micrograph and element mapping of TiFeZro.os. Even if the morphology is different, the elemental distribution seems similar to the Tio.9sFeZro.os
Fe Kal Ti
Zr LaI
Fig 3.1.4-Backscattered electron micrograph ofTiFeZro.o5 alloy prepared by arc melting with elements mapping.
Table 3.1.3-EDX analysis showing the dark phase element composition of Tio.95FeZrO.05, TiFeo.95ZrO.05 and TiFeZrO.05 alloys.
Element
Tio.95F eZrO.05 TiFeo.95ZrO.05 TiFeZrO.05 (Atomic%)
Fe 48.8 47.9 48.1
Ti 50.8 51.5 51.3
Zr 0.5 0.6 0.7
Table 3.1.4-EDX analysis showing the bright phase element composition of Tio.95FeZro.os, TiFeo.95ZrO.05 and TiFeZrO.05 alloys.
Element
Tio.95F eZrO.05 TiFeo.95Zro.o5 TiFeZro.os (Atomic%)
Fe 47.8 36.3 47.4
Ti 37.6 44.3 38.5
Zr 14.6 19.4 14.0
For each alloy, a quantitative analysis of the dark phase and bright phase was performed and reported in Table 3.1.3 and Table 3.1.4, respectively. From Table 3.1.3, it is cIear that the dark phase of the three alloys has identical elements abundances. ln particular, it should be noted that zirconium abundance is less than 1 atomic %.
Table 3.1.4 indicates that zirconium is predominantly confined into the bright phase but actually, the bright phase is mainly composed of titanium and iron. A cIoser inspection reveals that the bright phase of Tio.9sFeZro.o5 and TiFeZro.o5 alloys have almost the same composition. In fact, by comparing Table 3.1.1 and Table 3.1.4 it is cIear that those two alloys also have similar bright phase areas. In the case of TiFeo.95ZrO.05, the bright phase has a higher percentage of zirconium than the other two compositions but also a smaller are a of bright phase. This agrees very weB with the fact that zirconium is essentially found only in the bright phase. As ail these compositions have the same amount of zirconium, if the concentration of zirconium is
higher, then the area of the bright phase should be smaller. This is confirmed by
Tables 3.1.1 and 3.1.4.
3.1.1.2. Structural characterization
The XRD patterns of Tio.9SFeZro.os, TiFeo.9SZrO.Os and TiFeZro.os alloys in as-cast state
are presented in Fig 3.1.5. It can be clearly seen that all alloys prepared are made of
TiFe phase. However, the secondary phase seen in the SEM micrographs could not be
seen on the X-ray patterns. As the XRD was from a copper target the fluorescence
from iron is strong and produces an important background which makes the detection
of a secondary phase more difficult. Fluorescence is also the reason for the sloping
background of all these patterns.
l:' ïii c: S .5 30 ,.,....
...
40 50.TiFe
L
At
60 20 ~ TiFeZrO.05J-
..A-TiFeo.95Zr 0.05...
~ Tio.95FeZr 0.05 70 80 90 100Fig 3.1.5-XRD ofTio.9sFeZro.o5, TiFeo.9SZrO.Os and TiFeZrO.05 alloys in as-cast state.
Table 3.1.5 shows the lattice parameters of TiFe phase in as-cast alloys as determined
from Rietveld analysis. The lattice parameters of Tio.9SFeZro.os and TiFeZro.os are
c\oser to each other than to TiFeo.9SZrO.Os but globally they differ by only 0.1 %.
Table 3.1.5-Lattice parameter a (in A) of TiFe phase in as cast alloys as determined
from Rietveld analysis. The number in parenthesis is error.
Alloy Tio.9SF eZro.os TiF eO.9SZrO.Os TiFeZro.os
3.1.1.3. First hydrogenation
Fig 3.1.6 shows the first hydrogenation kinetics of aIl the compositions as measured at room temperature un der 2 MPa of hydrogen. It can be seen that Tio.9SFeZro.os alloy readily absorbs hydrogen without incubation time. Compositions TiFeo.9SZrO.Os and TiFeZro.os have identical first hydrogenation curves while Tio.9SFeZro.os has a faster first hydrogenation kinetics th an the two other alloys. This is somewhat surprising, considering the facts that Tio.9SFeZro.os and TiFeZro.os have very similar secondary phase composition and abundance, but they still have different first hydrogenation kinetics. The answer to this may be given by Fig 3.1.1. This figure clearly shows that the bright phase distribution is much finer in Tio.9SFeZro.os alioy than the other two alloys. In addition, it also clearly shows that the fraction of interphase boundaries is higher in Tio.9SFeZro.os than that in TiFeZro.os. Under the hypothesis that the bright phase and interphase boundaries act as a gateway for hydrogen then, it is reasonable that the first hydrogenation kinetics will be faster for Tio.9SFeZro.os alloy than the other two. 1.8 1.6 1.4 ~ 1.2 co
....
~ 1.0 &:&
0.8e
0.6"
>-::t: 0.4 0.2 0.0 0 1 2 3 Time (Hour) 4Tio
.
9leZro.o
s
Ti FeO.9SZrO.OsTiFeZro
.
o
s
5 6Fig 3.1.6-First hydrogenation behaviour of Tio.9SFeZro.os, TiFeo.9SZrO.Os and TiFeZro.os
3.1.1.4. Pressure-composition isotherms
After the first hydrogenation cycle, the pressure-composition isotherms were
measured at room temperature. The results are shown in Fig 3.1.7. The compositions
TiFeZro.os and Tio.9SFeZro.os present essentially the same curve, the only small
difference is that the alloy TiFeZro.os has a slightly larger capacity. The alloy
TiFeo.9SZrO.Os has a higher capacity th an the two other alloys and its hydrides are more
stable as indicated by the lower plateau pressures. Moreover, this higher capacity is
mainly due to the lower plateau pressure (monohydride) while the dihydride capacity
is the same for the three alloys.
10~---~ -ca 1 Il.. :E
-
~ ::s 1/) 1/) ~ Il..0.1
_---e
- Tio.9SFeZro.os TiFeo.9SZrO.Os ---.A.- TiFeZro.os0.01 L.._..o....-..L...-...o...-... ....L.. ... ...L.--a...---'----o.---'---'---.JL....-...
0.0 0.2 0.4 0.6 0.8 1.0 1.2 1.4 1.6
Hydrogen(wt. %)
Fig 3.1.7-PCT of Tio.9SFeZro.os, TiFeo.95ZrO.OS and TiFeZro.os alloys at room temperature.
3.1.2. Conclusion
The microstructure, crystal structure, and hydrogenation characteristics of
Tio.9SFeZro.os, TiFeo.9SZrO.Os and TiFeZro.os alloys have been investigated. The
following observations have been made. For ail alloys zirconium is mainly located in
the bright phase.
(1) Tio.9SFeZro.os alloy has faster first hydrogenation kinetics than the two other alloys
![[PDF] Tutoriel pour apprendre à créer des application Delphi sous Windows | Formation informatique](data:image/gif;base64,R0lGODlhAQABAIAAAP///wAAACH5BAEAAAAALAAAAAABAAEAAAICRAEAOw==)