1. INTRODUCTION
Seagrasses, which are habitat-forming species (or foundation species, sensu Dayton 1972; ecosystem engineers, sensu Jones et al. 1994), provide a com-plex habitat that offers several roles, such as reduc-ing water movement, providreduc-ing shelter from preda-tion, stabilizing sediments, trapping pathogens and sediments, and being important primary producers (Orth et al. 1984, Hemminga & Duarte 2000, Herkul & Kotta 2009, Lamb et al. 2017). Their presence pro-vides not only habitat but also protection and food for
fauna, notably in sheltering fish nurseries, and plays an important role in structuring communities (Heck et al. 2003, Duffy 2006, United Nations Environment Programme 2020). At a global scale, eelgrass beds are declining due to multiple causes that can also be interdependent, e.g. coastal development, eutrophi-cation, sea-level rise, increased water temperature, and increased water turbidity (Duarte 2002, Waycott et al. 2009). These various stressors decrease shoot density, increase habitat fragmentation, and can result in the complete disappearance of the eelgrass bed, thereby changing the community structure and © The authors 2021. Open Access under Creative Commons by Attribution Licence. Use, distribution and reproduction are un -restricted. Authors and original publication must be credited. Publisher: Inter-Research · www.int-res.com
*Corresponding author: [email protected]
Multiple stressors and disturbance effects on
eelgrass and epifaunal macroinvertebrate
assemblage structure
Stéphanie Cimon, Annie Deslauriers, Mathieu Cusson*
Département des sciences fondamentales, Université du Québec à Chicoutimi, 555, boulevard de l’Université, Chicoutimi, Québec G7H 2B1, Canada
ABSTRACT: Multiple forms of environmental change and anthropogenic pressure co-occur in coastal marine ecosystems. These external forces affect ecosystem structure, functioning, and, eventually, services to humans. Studies that include more than 2 simultaneous stressors are still needed to understand potential interactions among multiple stressors. We evaluated single and interactive effects of density reduction of Zostera marina L. (a habitat-forming species), shading, and sediment nutrient enrichment on the response of Z. marina and its associated epifauna over 10 wk. Shading had the greatest effect on reducing the eelgrass relative leaf elongation rate (RLE), non-structural carbohydrate reserves, and eelgrass shoot density. A reduced eelgrass den-sity sustained higher epifaunal densities and increased the eelgrass RLE. Sediment nutrient enrichment increased eelgrass shoot density but decreased epifaunal richness, diversity, and total abundance. Our disturbance and pair of stressors differed in their influence on diversity meas-ures, but all affected assemblage structure. Most of the changes to the epifaunal assemblage and diversity likely occurred due to altered habitat availability and epiphytic algae load. We observed additive, antagonistic, and negatively synergistic interactions among our treatments, while most of the cumulative effects showed dominance by one stressor over another. Our results highlight the importance of field experiments that are based on multiple disturbances and stressors to deter-mine their interaction type on communities.
KEY WORDS: Habitat complexity · Cumulative effect · Non-additive interaction · Foundation species · Field experimentation · Manipulative study · Shading · Nutrient addition
O
PEN
PEN
function of associated organisms (Connolly 1995, Pihl et al. 2006, Reed & Hovel 2006, Herkul & Kotta 2009). Habitat loss and fragmentation diminish both habi-tat complexity and patch size, and increase the edge effect at both the landscape and local scales; these modifications alter species richness and other com-ponents of diversity, such as assemblage structure and species behavior (Fahrig 2003, Staveley et al. 2017). Eelgrass complexity influences the associated communities. Typically, the presence of seagrass — at low or high densities — will increase the associ-ated community stability, species richness and total abundance, influence assemblage composition, and increase the habitat carrying capacity (Edgar & Robertson 1992, Calizza et al. 2017, Lundquist et al. 2018). On the other hand, a reduction in seagrass density would probably decrease seagrass self-shad-ing in a similar way to self-thinnself-shad-ing with increased depth owing to acclimation to low light (Krause-Jensen et al. 2000). Increased light following density reduction, if conditions allow, could therefore induce increased leaf surface area, shoot biomass, growth, and the number of leaves (e.g. Enríquez & Pantoja-Reyes 2005, Rattanachot et al. 2016). These changes could, in turn, support a greater epifaunal density, as seagrass surface area could be more important than shoot density or length in explaining epifaunal bio-mass (Sirota & Hovel 2006). Epiphytic algae can also play a trophic role, in concert with this habitat com-plexity, in increasing epifaunal density (Gartner et al. 2013). Finally, a threshold of habitat loss may exist that, once crossed, leads to a negative effect on epi-faunal communities (Reed & Hovel 2006); the exis-tence of such a limit would suggest that a decrease in shoot density may represent one of the foremost signs that the structure and, eventually, the function-ing of the entire seagrass bed will be greatly affected.
Coastal eutrophication is a major cause of seagrass bed decline. Nutrient enrichment of the water column increases the abundance of epiphytic algae and increases competition from macroalgae; there-fore, seagrass biomass decreases due to a reduced access to light (Hauxwell et al. 2003, Hughes et al. 2004, Jaschinski & Sommer 2008). Nutrient enrich-ment in the water column can also alter overall spe-cies richness, increase epifaunal density and biomass, cause a shift in species composition, and increase macrophyte and epiphyte abundance, particularly in nutrient-limited environments (Gil et al. 2006, Schmidt et al. 2017). Epifaunal grazers can control epiphyte biomass and even benefit from the presence of epiphytes (Reynolds et al. 2014). Overfishing of top
predator species can also create a trophic cascade, which can increase the epiphyte load by intensifying predation pressure on grazers (e.g. Eriksson et al. 2009). This sequence could exacerbate the effect of eutrophication in the water column. In contrast, nutri-ent enrichmnutri-ent of the underlying sedimnutri-ent may posi-tively affect eelgrass biomass (Hughes et al. 2004), unless the nutrient supply is too great and the sedi-ments become toxic (e.g. van Katwijk et al. 1997).
Light accessibility is important for seagrass health and maintaining habitats and food for the various epibenthic communities (see the review by Ralph et al. 2007 and references therein). Light accessibility can be reduced by the physical properties of water (e.g. dissolved organic matter, depth, and suspended sediment), catastrophic events (e.g. storms, flash floods, land erosion, and heavy rain), and anthropo-logical activities (e.g. dredging, increased sediment run-off, and eutrophication), that increase the pres-ence of macroalgae, phytoplankton or epiphytes growing on seagrass leaves (Ralph et al. 2007). De -pending on its duration, severity, and seasonal tim-ing, a reduction in accessible light can negatively affect seagrasses by decreasing seagrass biomass, growth, shoot density, carbohydrate reserves, and overall survival (Ralph et al. 2007, Wong et al. 2019). For example, reduced water clarity, combined with warming temperatures, has had a negative effect on seagrasses in Chesapeake Bay, USA (Lefcheck et al. 2017). Light reduction can also decrease epiphytic algae and increase seagrass chlorophyll concen -trations and plant length (Fokeera-Wahedally & Bhikajee 2005, Collier et al. 2009). Studies examining the effects of light reduction on epifauna within seagrasses remain rare. Experimental shading has shown that a decrease in the total abundance of as -sociated species can be related to a reduced abun-dance of epiphytic algae or reduced habitat complex-ity (Edgar & Robertson 1992, Gartner et al. 2010).
Multiple anthropogenic and natural disturbances and stressors co-occur in coastal habitats (see Grime 1977, Sousa 1984, where disturbance is related to biomass removal and stress is a condition that limits biomass). Nonetheless, their cumulative effects are often considered as additive or synergistic without proper testing; these effects may accumulate in a multiplicative manner or may not even accumulate, showing rather the dominance of one stressor (Hal -pern et al. 2007, Côté et al. 2016). The cumulative effects may interact in a synergistic or antagonistic manner, and, depending on the system under consid-eration, the resulting effects may be unpredictable (Darling & Côté 2008, Côté et al. 2016). The
occur-rence of synergistic interactions in the marine system may be greater when communities are exposed to 3 stressors rather than to a pair of stressors (Crain et al. 2008). Multiple interactive effects on both seagrass and macroinvertebrate epifaunal assemblage struc-tures remain poorly understood and field studies in seagrass beds that include 3 or more disturbances or stressors are rare (e.g. Ruesink et al. 2012, Moreno-Marín et al. 2018). Furthermore, such studies rarely include the response of the associated invertebrate assemblages (e.g. Cardoso et al. 2008, Stoner et al. 2014).
Here, we aim to evaluate the structural and phy -siological responses of a Zostera marina L. bed and its associated epifaunal communities to single and interactive effects of a reduced shoot density of Z.
marina, sediment nutrient enrichment, and shading.
Al though the effects of seagrass density/complexity have been studied (see above), few studies have explored the 2 other stressors, and none have studied their potential interactions. We selected these stres-sors because they are expected to increase in fre-quency and/or intensity in the St. Lawrence Estuary, and also for logistical reasons (see Section 2). Ice scouring (that occurs from the intertidal to some meters depth; Bergeron & Bourget 1984), storms, sediment deposition, and turbidity in the St. Law -rence Estuary are expected to play a greater role because of sea-level rise and climate change, and anthropogenic eutrophication of the estuary is also expected to rise. We measured the structural and physiological responses of Z. marina using shoot density counts, the relative leaf elongation rate, and the concentrations of non-structural carbohydrates (shoot and rhizome). We assessed the response of the associated epifaunal communities through diversity indices, species abundance structure, and the epi-phytic algae load. We hypothesize that, in addition to the significant individual influence of reduced eel-grass density, univariate and multivariate assem-blage characteristics will be affected by non-additive interactions. We hypothesize that a reduction in both eelgrass density and shading will negatively affect eelgrass functioning and diversity, whereas nutrient enrichment will have a positive effect. We also hypo -thesize that, of these stressors, shading will have the greatest effect on Z. marina. This study will improve our understanding of bottom-up controls and the density of habitat-forming species in shaping the associated diversity and functioning of eelgrass bed habitats. It will also provide useful insight into how eelgrass, and its associated communities, react in the presence of multiple stressors.
2. MATERIALS AND METHODS 2.1. Study site
The experiment was conducted from July to Sep-tember 2015 on the north shore of the St. Lawrence Estuary in Baie-St.-Ludger near the municipality of Baie-Comeau, Quebec, Canada (49° 05’ 11” N, 68° 19’ 09” W, see Fig. S1 in the Supplement at www. int-res. com/ articles/ suppl/ m657p093 _ supp. pdf). The site is dominated by the habitat-forming seagrass
Zostera marina L., which forms a quasi-continuous
monospecific meadow, with some isolated fragment -ed zones, having an approximate size of 15 km2
around the Manicouagan Peninsula (see Grant & Provencher 2007, Martel et al. 2009, Provencher & Deslandes 2012, Provencher & Nozères 2013 for fur-ther details of the site and its surroundings). The year-round average water temperature is approxi-mately 6°C (12°C in summer; up to 18°C at low tide in July), and salinity ranges between 20 and 30 PSU. The site lies approximately 0.16 m under the zero datum of sea level. The upper limit of Z. marina dis-tribution on this site is 0.004 ± 0.037 m, while the lower limit is −0.196 ± 0.062 m relative to the zero datum of sea level (Grant & Provencher 2007). The site is a typical shallow water eelgrass meadow that is moderately exposed to waves, covered by an ice foot during winter and is subjected to ice scouring. Seaweed reproduction within the bed is mainly veg-etative by rhizome cloning. Epiphytic filamentous algae are present from time to time in very small amounts and, to our knowledge, have yet to be char-acterized. Some drifting macroalgae, mainly kelp, are also present. The tidal regime is mixed, domi-nated by semidiurnal tides having a mean tidal range of approximately 2.6 m (www.tides.gc.ca). The eel-grass beds were characterized at the sampling site in June and August 2014; this is described in Section 1 in the Supplement (S. Cimon & M. Cusson unpubl. data).
Our experiment took place within a non-frag-mented flat zone of the meadow, which had an aver-age (± SE) eelgrass shoot density (hoop method) of 664 ± 12 shoots m−2at the beginning of the experi-ment. An aboveground biomass of (average ± SE) 122.8 ± 3.6 g of dry weight per m2 (g DW m−2) was
measured using collected shoots from the application of the shoot density reduction treatment (see Section 2.2). Both shoot density and aboveground biomass values were slightly lower than those of a few weeks earlier in the season the previous year (i.e. 137.85 ± 9.07 g DW m−2, see Supplement Section 1) and also
lower than those obtained by Grant & Provencher (2007), who measured shoot density and above-ground biomass values of 828 ± 305 shoots m−2and
184.06 ± 57.41 g DW m−2(n = 36), respectively.
2.2. Experimental design
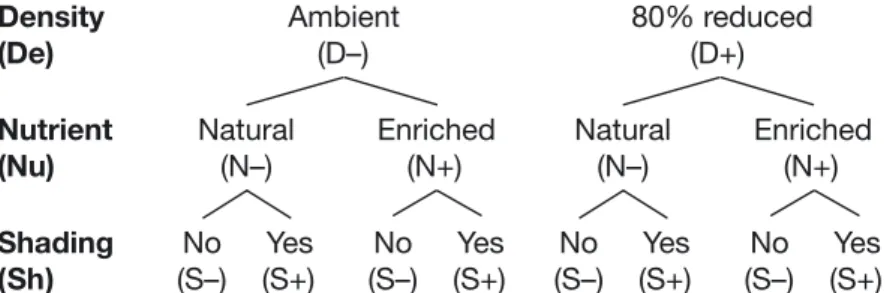
We used a complete factorial experimental design (see Fig. 1) to evaluate the reduction in density of a habitat-forming species (eelgrass density reduction [De], 2 levels: 0% [D−] or 80% reduction [D+]; pulse-type disturbance), nutrient enrichment of the sediments (enrichment [Nu], 2 levels: no addition [N−] or 75 g N m−2 [N+]; pulse-type stress), and
reduction of light (shading [Sh], 2 levels: natural light [S−] or 68% reduction [S+]; pulse-type stress) on the diversity and assemblage structure of epi-faunal eelgrass-associated assemblages and some of the physiological aspects of eelgrass. Although eelgrass density reduction is considered a distur-bance (see Grime 1977, Sousa 1984), we will use only the words ‘stress’ and ‘stressor’ to simplify the reading. For logistical reasons, only 1 level of each stressor could be tested. An 80% reduction of the original density was selected in line with the study of Reed & Hovel (2006), which suggested the pres-ence of an eelgrass habitat threshold somewhere between 50 and 90% of habitat removal. Our reduced density (approx. 120 shoots m−2) remained
in the range of some other studies, and was similar to the treatment (100 shoots m−2) of Boström & Bonsdorff (2000), who observed greater sediment loss and a different recruitment compared with denser treatments after a storm. Shading was used to simulate a pulsed turbidity event by suspended sediments. Such events can be caused by storms and increased run-off from 2 nearby dammed rivers.
We aimed for a moderate to high shading, since an 80% reduction reaches the minimum light require-ments of Z. marina (e.g. Lee et al. 2007) and at a light reduction of 60%, effects are measurable within 3 wk. After testing various materials, we found 2 layers of window screen to be our best option for reducing light by 68% on average. We decided to test sediment nutrient enrichment rather than water column nu trient enrichment because a previous study nearby did not find any effect of water column nutrient enrichment on epiphyte load or on the associated epifauna after a 4 wk enrich-ment (cf. Duffy et al. 2015). Moreover, large blue mussels are found at the sediment interface, and filter-feeding organisms such as these are known to promote bio deposition and nutrients within sedi-ments (Reusch et al. 1994). We selected a sediment nutrient en richment of 75 g N m−2to simulate a low
enrichment when compared with eutrophic sites (Gladstone-Gallagher et al. 2018). For example, such an enrichment of the sediment could arise from an algal bloom in the water column that enriches the sediments when it sinks to the bottom (Vahtera et al. 2007). This enrichment, due to bio -deposition from filter-feeding or ganisms, can accel-erate nutrient enrichment of sediments.
All 8 treatments were replicated 5 times (n = 5) and randomly assigned to 40 experimental plots (1 × 1 m), which were dispatched at random within the bed. A minimum distance of 3 m was maintained between plots. We sampled only the center of the plots, a region of approximately 50 × 50 cm.
Density reduction was applied using 1 m2quadrats
quadrilled with 100 cells (each 10 × 10 cm), where the cells occupied with shoots were counted. We then manually cleared 0 or 80% of the occupied cells at random; this clearing included all eelgrass shoots, including rhizomes and roots. To evaluate above-ground biomass, we recorded the bio-mass of 10 collected cells. Plots of nat-ural eelgrass densities (D−) were hand-disturbed by mimicking shoot clearing to avoid manipulation effects, i.e. we ran our fingers over the rhi-zome surface and shook the shoots.
Plots were enriched with 4 sticks of synthetic nutrients added to the sedi-ments (N:P:K = 15:3:3, 75 g N m−2;
Jobe’s Fertilizer Spikes Trees and Shrubs, Easy Gardener Products) at each corner of a 50 × 50 cm quadrat in the middle of the plot. Plots without enrichment (N−) were similarly
dis-Shading
(Sh)
Nutrient
(Nu)
Density
(De)
Ambient
(D–)
No
(S–)
(S–)
(S–)
(S–)
Yes
(S+)
Natural
(N–)
Enriched
(N+)
No
Yes
(S+)
80% reduced
(D+)
No
Yes
(S+)
Natural
(N–)
Enriched
(N+)
No
Yes
(S+)
Fig. 1. Schematic of the experimental design displaying the 3 stressor treat-ments: eelgrass density reduction (De; 2 levels: 0% in D− or 80% reduction in D+; pulse-type disturbance), nutrient enrichment of the sediments (Nu; 2 levels: no addition in N− or 75 g N m−2in N+; pulse-type stress), and shading
(Sh; 2 levels: natural light in S− or 68% reduction in S+; pulse-type stress); − stressor absent, + stressor present
turbed by inserting and removing thick plastic tent pegs at each corner.
Light was reduced using 1.25 × 1.25 m fiberglass screens, suspended at ~30 cm above the sediments. We measured the underwater photosynthetically active radiation (PAR) (average obtained using 5 to 9 readings within the first few cm of the sediment) at low tide with an LI-192 sensor (LI-COR) placed into the center of 6 plots with screens, at random loca-tions, and immediately measured the PAR next to each of these plots to use as a control. PAR reduction was then calculated using the mean PAR attenuation between each of these 6 screen plots and their respective controls. Mean PAR reduction was 68 ± 4%. Screens were kept in place for 19 d and were cleaned once a week to prevent any fouling.
Eelgrass density reduction was applied in the first week of July (Period 0, see Section 2.3). Two weeks later, we applied the sediment nutrient enrichment and shading (Period 1).
2.3. Sampling and sorting
Sampling occurred in 4 different periods from July to September 2015: Period 0 (July 1−4, eelgrass den-sity reduction), Period 1 (July 16−20, nutrients and shading added 2 wk after the start of the experi-ment), Period 2 (August 5−7, shading removed 5 wk after the start of the experiment), and Period 3 (Sep-tember 10−12, 10 wk after the start of the experiment to investigate recovery). This scheduling for the ap -pli cation of the treatments allowed the plants and the associated community to settle between Periods 0 and 1. The experiment was performed during the summer production peak (usually occurring between mid-July and mid-August, S. Cimon & M. Cusson pers. obs.). Data were collected by direct measures in the field and by sample collection followed by labo-ratory analysis.
2.3.1. Eelgrass measurements
Initial eelgrass shoot density was measured using 20 cm diameter rings (3 estimates per plot; Period 0). Eelgrass density was thereafter evaluated only in eelgrass ambient plots (D−) (Periods 2 and 3).
On a single occasion between Periods 1 and 2, we estimated the relative leaf elongation rate (RLE) of eelgrass as a proxy for growth, using 5 shoots per plot that were each marked with a reference hole at the top of the sheath using a pushpin. After 19 d, we
col-lected the shoots and brought them back to the labo-ratory where leaf elongation was measured as the dis-placement of the mark relative to the reference mark on the oldest nongrowing leaf (Olesen & Sand-Jensen 1994). Total leaf elongation was then divided by sheath length and the number of days of elongation.
We performed analyses of non-structural carbo -hydrates on 4 vegetative shoots, including their roots and rhizomes, that had been randomly collected from each plot, vacuum-sealed in plastic bags, and stored at −20°C. Shoots were quickly washed under run-ning water, stored at −80°C for 1 wk to stop all enzy-matic activity, and then freeze-dried for 5 d. All sam-ples (above- and belowground separately) were then ground into a fine powder (1 μm) by using a ball mill (Retsch MM200 Vibrant) for 5 min and stored at −20°C until analysis. As the quantity of root material was insufficient (< 5 mg), the root material was pooled with rhizomes for analysis (root-rhizome). Soluble sugar extraction was performed on 40 mg of dried powder (dried at 50°C overnight) of leaf and root-rhizome (Chow & Landhäusser 2004, Deslauri-ers et al. 2019). Soluble sugars were extracted 3 times with 80% ethanol at room temperature (4 ml) and centrifuged after each extraction (2000 × g, 6 min). The supernatant was collected and treated with phe-nol (2%) and sulfuric acid (96%). The absorbance of the sample was measured at 490 nm with a UV-VIS spectrophotometer, and the concentration of soluble sugars was converted to mg per g of dry weight (mg g−1 DW) using glucose-standard curves. Enzymatic
digestion of the remaining pellet was used to deter-mine starch concentrations (Bellasio et al. 2014). We added α-amylase (3000 U l−1, Megazyme) and
amy-loglucosydase (3260 U l−1, Megazyme) to split the
glucose chains, and then chemically treated the pellet with a reagent and sulfuric acid (75%). The ab -sorbance was read at 530 nm with a UV-VIS spec-trophotometer. Starch concentrations were then con-verted to mg g−1DW.
2.3.2. Measurements of the epibenthic community We estimated the epiphyte (microalgae) load on eelgrass by scraping eelgrass leaves with a micro-scope slide under filtered seawater. During Period 1, we selected and scraped the leaves of 3 randomly se-lected shoots. We then filtered the water containing the scraped epiphytes through preweighed GF/F fil-ters, and we assessed the epiphyte load as the dry weight of epiphytes divided by the dry weight of the collected scraped shoots (mg g−1DW). For Period 2,
our main sampling period, we used chlorophyll ex -traction, as this method is more precise. We scraped the leaves of 1 randomly selected shoot. We then fil-tered the water containing the epiphytes through GF/F filters that were then kept wrapped in aluminum foil at −80°C until analysis. Epiphyte load was as-sessed using chlorophyll extraction with 90% acetone, following Parsons et al. (1984). For logistical reasons, we did not determine the epiphyte load for Period 3.
We collected epifaunal macroinvertebrate commu-nities using mesh bags (~500 μm, diameter ~18 cm); samples were collected during ebb tide (Periods 1, 2, and 3). The opened mesh bag was pushed onto the eelgrass canopy toward the sediments, then closed immediately above the sediment surface. Once closed, eelgrass shoots sticking out of the mesh bags were cut with scissors, and the mesh bag was placed in an identified plastic bag. This method excludes epibenthic organisms lying on the sediments. We separated fauna from eelgrass shoots in the labora-tory by shaking the shoots under freshwater. We then collected the epifauna with a 500 μm sieve and pre-served the epifauna in 70% ethanol for further sort-ing. Individuals were identified to the lowest taxo-nomic level possible, usually species, and were then passed through a nested series of sieves (8.0, 5.6, 4.0, 2.8, 2.0, 1.4, 1.0, 0.71, 0.5 mm) to estimate the ash-free dry weight (AFDW) biomass using empirical equations from Edgar (1990), which are based on animal groups and size fractions. Doing so, we used slightly corrected coefficients as compared to those provided in Table III of Edgar (1990), which contains a typographical error (see corrected coefficients in Table S15 in the Supplement). Shoots were dried and weighed to standardize species abundance (and bio-mass) by eelgrass biomass (individuals by g of dry weight of Zostera marina; N g−1DW), as total
abun-dance is correlated with Z. marina biomass (see Orth et al. 1984).
2.4. Data analysis
We used an orthogonal 3-way analysis of variance (ANOVA) for each relevant period to test for simple and interactive effects of our 3 fixed factors (density reduction, nutrient enrichment, shading) and their interaction on eelgrass shoot density (2-way analysis only), RLE, soluble sugars and starch, epiphyte load, epifaunal total abundance raw (untransformed data) and standardized (N and N g−1DW, as well as
epifau-nal total standardized biomass, see Section 2.3.2), species richness (S), Simpson’s diversity index (1 − λ),
Pielou’s evenness (J’), and assemblage structure (raw and standardized) and composition. We preferred not to first perform a repeated measures analysis, as sampling was destructive and experimental condi-tions varied between the periods. We ran a Tukey’s HSD multiple comparison test on the significant in -teractions of factors. We verified assumptions (normality, variance homogeneity) by examining the re -siduals (Montgomery et al. 2012); total standardized abundances were fourth-root transformed, while epi-phyte load and soluble sugars were square-root transformed, all prior to the analyses.
We characterized the nature of each significant interaction effect as either antagonistic, synergistic, additive, or dominant (sensu Côté et al. 2016) using a calculated 95% confidence limit of the expected additive effect (Darling & Côté 2008). To do so, we measured the response to single stressor compared with no stressor, calculated the expected additive response, then compared the cumulative response to both a single stressor and the expected additive re -sponses. If the cumulative response was not different from the additive model, we considered there was no interaction; the response was thus classified as addi-tive. If the cumulative response was less than the expected additive, the response was classified as antagonistic unless the response was the same for one of the single stressors. In this latter case, we clas-sified the response as dominance. If the response was greater than the expected additive, it was classified as synergistic. Finally, if the response was less and of opposite sign, we classified it as negative synergistic (see Côté et al. 2016 and Galic et al. 2018 for further details and examples).
To examine the effects on epifaunal assemblage structure (based on Bray-Curtis similarities), we ran a permutational multivariate analysis of variance (PERMANOVA; Anderson et al. 2008) with 9999 per-mutations using the same design described above (3 fixed factors, 2 levels each). Assemblage structure was examined using abundance data by species (both raw and standardized) pretreated using disper-sion weighting (Clarke et al. 2006) by treatment (8 levels, combination of the 3 factors applied to 1 plot) for each period and then transformed by square root (species abundance structure) based on the shade plot method (Clarke et al. 2014). The same data were transformed into presence−absence data for evaluating the effects on assemblage composition (species identity). We evaluated the contribution of each taxon to the observed similarities/dissimilarities among treatments using a similarity percentage ana -lysis (SIMPER).
Univariate analyses were run using JMP v.11.0, while multivariate analyses were run using PRIMER +PERMANOVA v.7.0.1 (Anderson et al. 2008, Clarke & Gorley 2015). We used a significance level of α = 0.05 for all statistical analyses, and marginally signif-icant results were carefully considered.
3. RESULTS
The initial average (± SE) shoot density of Zostera
marina was 664 ± 12 shoots m−2 with an average aboveground biomass of 122.8 ± 3.6 g DW m−2 in
early July. We identified a total of 31 taxa, including 5 species of gastropods, 5 species of bivalves, 7 spe-cies of amphipods, and 3 spespe-cies of isopods (see Table S1 in the Supplement for a full list). The most abundant species was the periwinkle Littorina
saxatilis.
3.1. Stressor effects on eelgrass
Our experimental treatments (eelgrass density re -duction, sediment nutrient enrichment, shading, and the combined treatments) influenced some charac-teristics of Z. marina only in Period 2 (Table 1; see Tables S2 & S4 for the results of the other sample periods).
Shading and enrichment treatments showed a sig-nificant interaction on eelgrass density (Table 1a, Fig. 2b; see Table S3 for Tukey HSD test details). Shading treatment reduced the number of Z. marina shoots in plots by 14% in the absence of enrichment (N−S+, Fig. 2b; marginally significant, Tukey HSD p = 0.0574), while enrichment increased Z. marina density by 18% in the absence of shading (N+ S−, Fig. 2b; Tukey HSD, p = 0.0106). The combined effect (N+ S+) was dominated by the effect of shading, as the response size was statistically comparable to the effect of shading alone (N−S+, Fig. 2b; Tukey HSD, p = 0.7694).
Density reduction and shading both influenced the
Z. marina RLE, but they had no significant
interac-tion (Table 1b). Density reducinterac-tion increased RLE, while shading reduced RLE, both by about 20% (Table 1b, Fig. 2a,e). The interaction type of these 2 stressors was additive since they canceled each other when they were both present—note the absence of interactions in Table 1b (see Fig. S2e).
Shading reduced non-structural carbohydrates in leaves and rhizomes by about 39% for starch and 61% for soluble sugars (Table 2, Fig. 2c,d,g,h; see
Table S5 & Fig. S2). Shading and density reduction had 2 significant interactions for soluble sugars in leaves and starch contents in root-rhizomes (Table 2). Reduced eelgrass density plots had higher concentrations of soluble sugars in leaves (44% higher; Tukey HSD, p = 0.0845) but only in the absence of shading (D+ S−, Fig. 2c). Shading dominated the effect of eelgrass density reduction, as those 2 stressors together (D+ S+) had a re -sponse of equal magnitude to shading alone (D− S+, Fig. 2c). Shading and density reduction inter -acted on root-rhizome starch as well, albeit in a negative synergistic manner: D+ S− had the highest concentrations, D+ S+ had the lowest (Fig. 2h; see Figs. S2d & S3).
The starch concentration in leaves for the D−N−S− and D−N+ S− treatments (pooled; average ± SE; n = 10) showed very low values, with 0.85 ± 0.1 mg g−1
DW in leaves and 0.27 ± 0.1 mg g−1DW in rhizomes.
In contrast, average soluble sugar values were 28.7 ± 1.9 mg g−1DW in leaves and 86.7 ± 11.3 mg g−1DW in the root-rhizome.
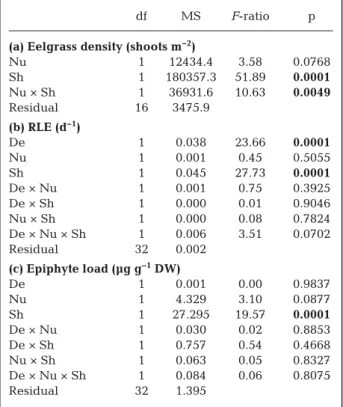
df MS F-ratio p (a) Eelgrass density (shoots m−2)
Nu 1 12434.4 3.58 0.0768 Sh 1 180357.3 51.89 0.0001 Nu × Sh 1 36931.6 10.63 0.0049 Residual 16 3475.9 (b) RLE (d−1) De 1 0.038 23.66 0.0001 Nu 1 0.001 0.45 0.5055 Sh 1 0.045 27.73 0.0001 De × Nu 1 0.001 0.75 0.3925 De × Sh 1 0.000 0.01 0.9046 Nu × Sh 1 0.000 0.08 0.7824 De × Nu × Sh 1 0.006 3.51 0.0702 Residual 32 0.002 (c) Epiphyte load (µg g−1DW) De 1 0.001 0.00 0.9837 Nu 1 4.329 3.10 0.0877 Sh 1 27.295 19.57 0.0001 De × Nu 1 0.030 0.02 0.8853 De × Sh 1 0.757 0.54 0.4668 Nu × Sh 1 0.063 0.05 0.8327 De × Nu × Sh 1 0.084 0.06 0.8075 Residual 32 1.395
Table 1. Summary of the analyses of variance (ANOVAs) showing the effects of eelgrass density reduction (De), sedi-ment nutrient enrichsedi-ment (Nu), and shading (Sh) factors on (a) eelgrass shoot density (only effects of Nu and Sh), (b) rel-ative leaf elongation rate (RLE), and (c) epiphyte load as chlorophyll a concentration during Period 2 (see Section 2).
3.2. Stressor effect on associated epibenthic communities Eelgrass density reduction, sedi-ment nutrient enrichsedi-ment, and shad-ing influenced the invertebrate assem-blages in various ways (Tables 3 & 4, Fig. 3). In contrast, the epiphyte load was affected only by shading. The ef -fects of enrichment or shading were only observed in Period 2 (Tables 3 & 4; see Tables S2 & S4). Note that there was a positive correlation between the biomass of Z. marina collected and epifaunal total raw abundance at each period (Period 1: r = 0.559, p = 0.0002, n = 40; Period 2: r = 0.594, p < 0.0001, n = 40; Period 3: r = 0.739, p < 0.0001, n = 40; all periods pooled: r = 0.530, p < 0.0001, n = 20 with single fitted regres-sion: F1,118= 46.7, p = 0.0001, y = 33.4 +
23.2x; see Fig. S4). We present ANOVA re sults for total raw and stan-dardized abundances in Tables 3a,b &
S7a,b, but only report standardized re sults here. Graphs of total raw abundances, as well as total stan-dardized abundances and total abundance by plot (ind. m−2), can be found in Fig. S4. Note that the standardization has an effect on the results of univariate total abun-dance (Table 3a,b), while it has no impact on the outcome for assem-blage structure (Table 4a,b). Under standardization, density reduction and en richment have significant impacts, (respectively p = 0.001 and p = 0.0428), whereas these are not significant when using raw data in Period 2 (respectively p = 0.0693 and p = 0.0561, Table 3a,b). Note that total abundances were higher in density-reduced plots with and without standardization for both treatments. The major dif-ference relates to the effect of shading. This effect is significant when using total raw abundance, and it is not significant when the data are standardized (Table 3a,b). Moreover, the effect is inverted
Leaves Root-rhizomes
df MS F-ratio p MS F-ratio p (a) Soluble sugars (mg g–1DW)
De 1 0.99 1.17 0.2869 0.50 0.14 0.7132 Nu 1 0.01 0.01 0.9268 0.22 0.06 0.8086 Sh 1 51.40 60.66 0.0001 130.74 35.90 0.0001 De × Nu 1 0.55 0.65 0.4261 2.30 0.63 0.4323 De × Sh 1 4.91 5.80 0.0220 11.52 3.16 0.0849 Nu × Sh 1 0.10 0.11 0.7385 0.05 0.01 0.9105 De × Nu × Sh 1 0.12 0.14 0.7067 4.68 1.29 0.2653 Residual 32 0.84 3.64 (b) Starch (mg g–1DW) De 1 0.10 0.62 0.4369 0.00 0.01 0.9221 Nu 1 0.35 2.14 0.1529 0.01 0.29 0.5920 Sh 1 0.92 5.58 0.0244 0.17 3.82 0.0595 De × Nu 1 0.00 0.01 0.9111 0.01 0.19 0.6700 De × Sh 1 0.03 0.19 0.6639 0.19 4.22 0.0481 Nu × Sh 1 0.31 1.89 0.1784 0.00 0.06 0.8129 De × Nu × Sh 1 0.16 0.99 0.3282 0.00 0.02 0.8861 Residual 32 0.17 0.04
Table 2. Summary of the analyses of variance (ANOVAs) showing the effects of eelgrass density reduction (De), sediment nutrient enrichment (Nu), and shading (Sh) factors on the (a) soluble sugar and (b) starch contents of leaves and root-rhizomes in Period 2 (see Section 2). Significant values are shown
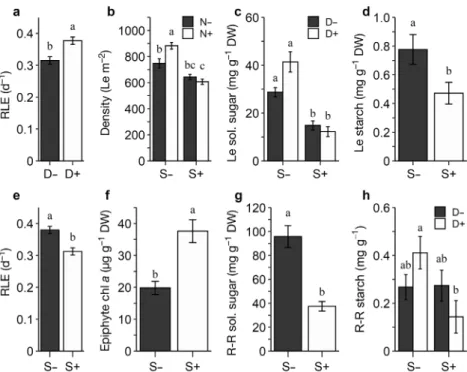
in bold Fig. 2. Mean (± SE) values of (a,e) eelgrass relative leaf elongation rate (RLE); (b) eelgrass shoot density; soluble sugars in (c) leaves (Le) and (g) root-rhizomes (R-R); starch in (d) Le and (h) R-R; and (f) epiphyte load on shoots (chlorophyll a). Values are from Period 2. Black and white bars are the respective treatments with: − stressor absent; + stressor present; D: eelgrass density reduction; N: sediment nutrient enrichment; S: shading. Number of replicates used to obtain the aver-ages: (a,d,e,f,g) n = 20; (c,h) n = 10; and (b) n = 5. Different letters above bars
because much less eelgrass was collected under shading (see Fig. S4). This pattern is due to our recovery of significantly smaller samples (less eel-grass) under shading (see Table S6 & Fig. S4).
Shading doubled the epiphytic load on the eelgrass shoots (chlorophyll a, Table 1c, Fig. 2f). Epiphytic chlorophyll b and chlorophyll a showed similar pat-terns, presenting respective increases of 128 and 89% (data not shown). The epiphytic load was not affected by the other treatments.
Total standardized abundance and Simpson’s diversity were higher in the density-reduced plots (D+) than in the density ambient plots (D−) through-out the entire experiment (Table 3b,c, Fig. 3a,d, showing Period 2). Total standardized abundance increased respectively by 80, 109, and 25% from Period 1 to Period 3 in the reduced density plots (Fig. 3a, showing Period 2; see Fig. S4 for all periods). Eel-grass density reduction had no effect on richness (Tables 3d & S7c), but it increased evenness in Period 1 and Period 3 (by 52% and 19%, respectively; Period 2
df MS F-ratio p (a) Total raw abundance (N)
De 1 2146.2 3.53 0.0693 Nu 1 2387.0 3.93 0.0561 Sh 1 6325.2 10.41 0.0029 De × Nu 1 2175.6 3.58 0.0676 De × Sh 1 297.0 0.49 0.4895 Nu × Sh 1 1782.2 2.93 0.0965 De × Nu × Sh 1 1357.2 2.23 0.1449 Residual 32 607.7
(b) Total standardized abundance (N g–1DW)
De 1 78.89 28.65 0.0001 Nu 1 12.25 4.45 0.0428 Sh 1 4.68 1.70 0.2013 De × Nu 1 1.06 0.38 0.5395 De × Sh 1 0.18 0.06 0.8022 Nu × Sh 1 0.34 0.13 0.7258 De × Nu × Sh 1 1.25 0.45 0.5050 Residual 32 2.75 (c) Diversity De 1 0.058 4.93 0.0335 Nu 1 0.057 4.87 0.0346 Sh 1 0.043 3.64 0.0001 De × Nu 1 0.272 23.07 0.0654 De × Sh 1 0.046 3.94 0.0556 Nu × Sh 1 0.004 0.32 0.5742 De × Nu × Sh 1 0.002 0.18 0.6727 Residual 32 0.012 (d) Richness De 1 2.03 0.45 0.5083 Nu 1 24.03 5.31 0.0279 Sh 1 9.03 1.99 0.1675 De × Nu 1 21.03 4.65 0.0387 De × Sh 1 0.23 0.05 0.8250 Nu × Sh 1 1.23 0.27 0.6064 De × Nu × Sh 1 0.03 0.01 0.9412 Residual 32 4.53 (e) Evenness De 1 0.007 0.61 0.4396 Nu 1 0.000 0.02 0.8775 Sh 1 0.241 21.25 0.0001 De × Nu 1 0.005 0.46 0.5043 De × Sh 1 0.076 6.72 0.0143 Nu × Sh 1 0.021 1.84 0.1847 De × Nu × Sh 1 0.000 0.0 0.8657 Residual 32 0.011
Table 3. Summary of the analyses of variance (ANOVAs) showing the effects of eelgrass density reduction (De), sedi-ment nutrient enrichsedi-ment (Nu), and shading (Sh) factors on (a) total raw abundance, (b) total standardized abundance, (c) Simpson’s diversity index, (d) richness, and (e) Pielou’s evenness of associated epifauna in Period 2 (see Section 2). Significant values are shown in bold. See Table S7 for
Periods 1 and 3
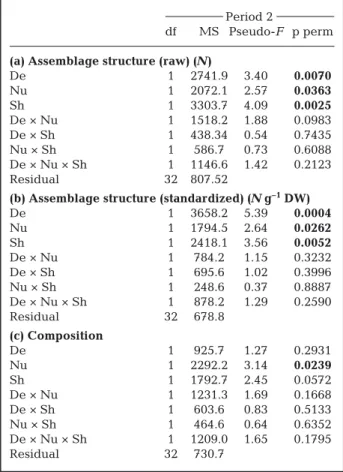
Period 2
df MS Pseudo-F p perm (a) Assemblage structure (raw) (N)
De 1 2741.9 3.40 0.0070 Nu 1 2072.1 2.57 0.0363 Sh 1 3303.7 4.09 0.0025 De × Nu 1 1518.2 1.88 0.0983 De × Sh 1 438.34 0.54 0.7435 Nu × Sh 1 586.7 0.73 0.6088 De × Nu × Sh 1 1146.6 1.42 0.2123 Residual 32 807.52
(b) Assemblage structure (standardized) (N g–1DW)
De 1 3658.2 5.39 0.0004 Nu 1 1794.5 2.64 0.0262 Sh 1 2418.1 3.56 0.0052 De × Nu 1 784.2 1.15 0.3232 De × Sh 1 695.6 1.02 0.3996 Nu × Sh 1 248.6 0.37 0.8887 De × Nu × Sh 1 878.2 1.29 0.2590 Residual 32 678.8 (c) Composition De 1 925.7 1.27 0.2931 Nu 1 2292.2 3.14 0.0239 Sh 1 1792.7 2.45 0.0572 De × Nu 1 1231.3 1.69 0.1668 De × Sh 1 603.6 0.83 0.5133 Nu × Sh 1 464.6 0.64 0.6352 De × Nu × Sh 1 1209.0 1.65 0.1795 Residual 32 730.7
Table 4. Summary of permutational multivariate analyses of variance (PERMANOVAs) showing the effects of eelgrass density reduction (De), sediment nutrient enrichment (Nu), and shading (Sh) factors on the species abundance structure in (a) raw abundance and (b) standardized abundance, and (c) composition (transformed into presence-absence) of as-sociated epifauna in Period 2 (see Section 2). Significant values are shown in bold; 9999 permutations were run.
Tables 3e & S7d, Fig. 3c, showing Period 1). Reduced eelgrass density affected the species abundance structure of epibenthic assemblages throughout the entire experiment (Table 4a,b; see Table S8a,b and Fig. S5a,c,e), but it did not affect their composition (Table 4c; see Table S8c). Details for those species most affected by our treatments are provided in Tables S10−S14 along with an additional description of the results (see Supplement Section 2.).
Total standardized abundance, diversity, and rich-ness were lower in nutrient-enriched plots (N+) than in ambient nutrient plots in Period 2, whereas they had no effect on evenness (N−; Table 3b−e, Fig. 3b, e,g). Total standardized abundance, diversity, and richness were respectively 23, 14, and 22% lower in enriched plots (Fig. 3b,e,g). Enrichment influenced the species abundance structure and species compo-sition (Table 4; see Fig. S5b). Details for those species that most contributed to the differences in species abundance structure between the enrichment treat-ments are listed in Table S13 along with an additional description of the results (see Supplement Section 2). In Period 2, shading did not influence total stan-dardized abundance in terms of counts or richness (Table 3b,d); however, it increased evenness by 27% (Table 3e, Fig. 3f) and diversity by 35% (Table 3c, Fig. 3h). Shading influenced the species abundance structure of assemblages but not in terms of
composi-tion (Table 4, see Fig. S5d). Details of those species that most con-tributed to differences in species abundance structure between the shading treatments are listed in Table S14. Even though shading did not decrease total standardized abundance in counts, it decreased total standardized abundance in biomass by about 25% (mean ± SE, S−: 21.4 ± 1.7 and S+: 15.7 ± 1.7;
F1, 32= 5.7958, p = 0.0220). The total standardized abundance in bio-mass results for all other treatments were, however, comparable to total standardized abundance in counts. Two interactions were significant in Period 2: density reduction × nutrient enrichment on richness (Table 3d; Fig. 3b) and density re -duction × shading on evenness (Table 3e; Fig. 3f). Nutrient en -richment decreased richness only when combined with the density ambient treatment (D−N+); the combined effect of nutrient enrichment and density reduction (D+N+) was dominated by the density reduction effect (Fig. 3b). In a similar way, shading increased evenness only when combined with the density ambient treatment (D−S+); the combined effect of shading and density reduction (D+ S+) was antagonistic because both stressors increased even-ness. Although their interaction increased evenness, the response was less than the effect of shading, although greater than the effect of eelgrass density reduction (Fig. 3f). All interacting factors are summa-rized in Table S9 (see Supplement Section 3.9).
4. DISCUSSION
The aim of this study was to understand how reduced eelgrass density, nutrient enrichment, and decreased light influence eelgrass structure and physiology, and the associated faunal assemblages. More importantly, we wanted to explore potential interactions among stressors, as stressors often occur simultaneously (although eelgrass density reduction is a disturbance, see Grime 1977 and Sousa 1984, we use only the word ‘stressor’ to simplify the reading). As predicted, shading had the greatest effect on eel-grass. Interestingly, shading reduced plant growth (RLE), reserves of non-structural carbohydrates, and Fig. 3. Mean (± SE) values of epifaunal (a,e) total abundances standardized per
shoot dry weight; (b) species richness; (c,f) Pielou’s evenness; (d,g,h) Simpson’s di-versity. Values are from Period 2 except (c) which is from Period 1. Black and white bars are the respective treatments with: − stressor absent; + stressor pres-ent; D: eelgrass density reduction; N: sediment nutrient enrichmpres-ent; S: shading. Numbers of replicates used to obtain the averages: (a,c,d,e,g,h) n = 20; (b,f) n = 10.
shoot density. Eelgrass density reduction, on the other hand, sustained higher epifaunal densities and increased the RLE. Sediment nutrient enrichment increased eelgrass shoot density but decreased epi-faunal richness, diversity, and total abundance. Nev-ertheless, we consider that our studied eelgrass bed was resilient to the effects of shading and sediment nutrient enrichment stressors, as all measured effects were not statistically different beyond 5 wk after removing the shading. A reduced eelgrass density continued to have an effect, although our results indicated that the eelgrass was on its way to recov-ery. Our initial hypotheses were partly confirmed because we observed non-additive interactions, a clear physiological response in eelgrass tissues, and changes in biodiversity that are related to our induced stressors.
4.1. Stressor effects on eelgrass
Of the 3 main applied treatments, shading most affected eelgrass physiology. Reduced access to light in shaded plots likely reduced the levels of photosyn-thesis, as shown by decreased values of non-struc-tural carbohydrates — in the form of both sugars and starch — and reduced plant growth (RLE). According to Ralph & Gademann (2005), Zostera marina leaves exhibit limited photosynthetic capacity when grown under low light (50 μm photon m2s−1), compared with
leaves grown under higher light conditions (300 μm photon m2 s−1). More particularly, plants grown under low light have a lower maximum relative elec-tron transport rate (rETRmax) and a reduced activity of
non-photochemical quenching pathways (Ralph & Gademann 2005), thereby limiting their energy pro-duction to fixing carbon and producing sugars. Previ-ous studies on seagrasses have reported a reduction in non-structural carbohydrates and growth under shading conditions (e.g. Collier et al. 2009, Salo et al. 2015). Our observed 61% reduction in soluble sugars under shading falls within the range of other studies (e.g. Burke et al. 1996, with reductions of 48% in leaves, 40% in rhizomes, and 51% in roots under 80% shading for 3 wk; Silva et al. 2013, with a decrease of 70−85% in rhizomes under 75% shading for 3 wk). However, our observed shading effect on starch concentrations in eelgrass, a 39% reduction, is much less common; for example, Burke et al. (1996) did not observe any effect of shading on starch con-centrations, whereas Silva et al. (2013) measured a decrease in starch only in those shoots subjected to 75% shading. Given the reduction of reserves and
the predominant vegetative reproduction mode of
Z. marina on our site (see Grant & Provencher 2007),
prolonged or repeated turbidity events in our system would probably affect its reproduction.
On the other hand, reduced eelgrass density in -creased growth and most non-structural carbohy-drates under natural light conditions (D+ S−). This pattern can be explained by the reduced self-shad-ing, as it is related, among other seagrass character-istics, to shoot density (Enríquez & Pantoja-Reyes 2005). Other studies have demonstrated an increase in growth due to reduced shoot density or above-ground biomass (e.g. Rattanachot et al. 2016). Al -though RLE was also higher in eelgrass density-reduced plots under shading (D+ S+, see Fig. S2e in the Supplement), non-structural carbohydrate con-centrations were the lowest (not significantly differ-ent from D−S+, see Figs. S2a−d & S3). We argue that such a decrease in carbohydrates can be attributed not only to shading but also to the lack of a transfer of carbon resources between shoots via the rhizome system; this is induced by the disconnection between the rhizomes, and thus shoots, that occurred when we applied the eelgrass density reduction treatment (Period 0, D+). Burke et al. (1996) did not find any effect of cutting rhizomes on non-structural carbohy-drates under natural light conditions; however, they did not control for the severing of the rhizome under shading, which reduced sugar concentrations. To our knowledge, there are no studies of carbohydrate translocation between ramets in Z. marina. Marbà et al. (2002, 2006), however, observed carbon trans -location between ramets in 8 seagrass species; car-bon translocation is therefore quite probable in Z.
marina as well. Regardless, our results indicate that
the transfer of resources among shoots may become important under reduced light conditions.
In Z. marina, non-structural carbohydrates are usu-ally dominated by soluble sugars (e.g. Eriander 2017) and, like other seagrasses, their pool of carbohydrate is constituted mainly of sucrose (e.g. Touchette & Burkholder 2000). Sucrose concentrations are nor-mally higher in rhizomes than in leaves, and repre-sent up to 90−100% of soluble sugars (Drew 1983, Touchette & Burkholder 2000, Eriander 2017). In our study, the concentrations of soluble sugars were higher in root-rhizomes, but these concentrations (average range 30−85 mg g−1DW) were much lower
than concentrations found in other studies (100− 350 mg g−1DW in leaves and 100−500 mg g−1DW in
rhizomes; e.g. Drew 1983, Salo et al. 2015, Eriander 2017). Similarly, our measured concentrations of starch (<1 mg g−1DW) were also much lower than
levels found in other studies (from 7 to 14 mg g−1DW
in leaves and rhizomes; e.g. Silva et al. 2013, Erian-der 2017). Such variation in carbohydrate concen -tration depends on species, salinity, temperature, season, light exposure, depth, genetics, and the ex -traction method (Touchette & Burkholder 2000, Salo et al. 2015, Sorensen et al. 2018). Overall, leaves showed very low starch concentrations (0.5−3%), values which are similar to the 2% measured in rhi-zomes by Eriander (2017). Starch reserves were slightly higher in leaves than in root-rhizomes, which can be explained by the presence of transient starch stored in leaf chloroplasts during the day for con-sumption during the night (MacNeill et al. 2017).
We do not know the seasonality of non-structural carbohydrates at our site. However, other studies have reported higher carbohydrate concentrations in June and September and lower concentrations in winter and in July−August (Burke et al. 1996, Touchette & Burkholder 2007). This suggests that we sampled our shoots when they were at their lowest reserve levels.
Shading reduced eelgrass shoot density, as has been reported by many previous studies on sea-grasses (e.g. Collier et al. 2009, Wong et al. 2019). Shoot loss under shading can occur in as fast as 18 d for Z. marina (Backman & Barilotti 1976). Similarly, a decrease in shoot density and biomass is commonly observed with an increase in water depth (e.g. Ole-sen et al. 2002). This could indicate a self-thinning mechanism in response to light reduction to diminish self-shading and, in turn, affect habitat complexity and the associated community (see Section 4.2).
Nutrient enrichment increased shoot density in the absence of shading at our site, while it decreased density under shading. An increase in shoot density could be the initial response to enrichment in a limit-ing environment (Short 1983 and references therein), suggesting that our site may have a nutrient limita-tion for eelgrass. Other studies on seagrasses have reported opposite effects from enrichment on shoot density; the responses depended on the initial nutri-ent state (e.g. Orth 1977, Short 1983). Typically, studies report an increased shoot growth in limiting en -vironments (e.g. Bulthuis & Woelkerling 1981, Lee & Dunton 2000). The opposite response to nutrient en -richment under shading is likely explained by the effect of shading being too important for nutrients to have an effect. Growth (measured as RLE here) was not affected by enrichment in our case. Perhaps our enrichment treatment was too short in duration to in -crease shoot growth, albeit long enough to in-crease shoot density.
4.2. Stressor effect on associated epibenthic communities
Of all the main effects, only shading affected epi-phyte load. We observed that shading increased epiphytic algae; nevertheless, most studies report a decrease of epiphytic algae under shaded conditions (e.g. Collier et al. 2009). The increase in epiphytic algae at our site could be explained by the observed concomitant reduction in density of the dominant grazer Littorina saxatilis and a reduction in the over-all invertebrate biomass, including other grazer spe-cies (see below). Another possible explanation is that the reduction of leaf turnover allows more epiphytes to grow on the leaves (Hemminga 1998).
Among our applied stressors, a reduced eelgrass density had the greatest effect on assemblage struc-ture, total abundance, and diversity of epibenthic macroinvertebrates. Density-reduced plots recorded a higher total standardized abundance, evenness, and diversity as well as a different assemblage struc-ture. These differences were due mainly to an in -crease in the total standardized abundance (by gram of eelgrass) of periwinkles, isopods, and gammarids in the density-reduced plots. A possible explanation is that more individuals remained and shared less available space among the leaves of the remaining plants. Part of the mechanism allowing this scenario is the increased light penetration due to less canopy that most likely increased the availability of food items, such as epiphytic algae. Epiphyte load values were not lower despite a greater grazer concentra-tion or higher despite better access to light. Epi-phytes can, in fact, affect the distribution of epifauna abundance via their trophic role: more epiphytes increase the abundance of grazers, while the abun-dance of filter feeders remains unchanged (Bologna & Heck 1999, Gartner et al. 2013). This idea is sup-ported by the relative abundance of the epiphytic grazer Lacuna vincta being higher in eelgrass-reduced plots, but not Mytilus spp. Our results high-light the importance of eelgrass as a habitat-forming species even at low density (reduced shoot number) within a seagrass bed in helping to sustain high epi-faunal density and diversity.
Changes in invertebrate assemblages related to higher nutrient concentrations are caused generally by an increase in algae (macroalgae and epiphytic algae), organic matter, and hypoxia (e.g. Gil et al. 2006, Schmidt et al. 2017), a scenario that we did not observe. Nevertheless, in the enriched (N+) plots of Period 2, we observed a lower standardized abun-dance for two-thirds of the species as well as a lower
diversity and richness, especially when density was left untouched (D−N+). Indeed, we noted a signifi-cant decrease in the standardized abundance of the gastropods L. saxatilis and Ecrobia truncata and the amphipod Phoxocephalus holbolli (see Table S13). E.
truncata was absent from some of the enriched plots,
and P. holbolli was absent in more than half of the enriched plots. This reduction in grazers cannot be easily explained, and did not seem to have a positive effect on epiphytic algae, as we did not observe a dif-ference in epiphyte load. We saw no nutrient effect during the last period, and this observation is proba-bly due to the dissolution of the nutrient sticks between Periods 1 and 2 (S. Cimon pers. obs.) fol-lowed by a rapid recovery. Only the distribution of
Mytilus spp. seemed to be affected by the
enrich-ment, as there were 50% fewer mussels in the enriched plots in Period 3 (F1, 32= 4.5967, p = 0.0397).
Our results suggest that under conditions of re -duced light, changes in epiphytic algae affected the epifaunal assemblages. After 19 d of shading, smaller individuals were found under shading than under the natural light conditions, as shown by a decrease in the total standardized biomass without an effect on total standardized abundance. This reflects a pro-portional increase of small species under shaded conditions, such as the gastropod E. truncata, the iso-pod Edotia triloba, and juvenile gammarids, whereas the abundance of L. saxatilis de creased (see Table S14). The compositional changes in species are also shown by an increase in evenness (and then diversity values) under shading. The reduced abundance of L.
saxatilis under shading is likely not a direct effect of
light attenuation; it may be related to shading caus-ing a decrease in diatoms, the preferred food item of
L. saxatilis (e.g. Otero-Schmitt et al. 1997), which in
turn decreased L. saxatilis abundance to trigger an increase in total epiphytic algae. Such an increase in epiphytic algae may have attracted other epifaunal grazer species (see Gil et al. 2006 for results of epi-faunal change due to epiphyte change). Other stud-ies have shown a reduction in faunal total abundance under shading conditions because of a reduction of epiphytic algae or habitat complexity (Edgar & Robertson 1992, Gartner et al. 2010). In our study, however, we cannot disentangle the direct effect of light reduction from the presence of screens above the plots. The screens could attract or repulse some species as well as alter the interactions between spe-cies (e.g. predation), modify water movements, and increase drifting macroalgae, such as Saccharina spp., which was caught by the poles in the vicinity of sampled plots. This material was quickly removed
during our regular maintenance. As an example of a screen shade artifact, Gartner et al. (2010) observed more fish under shading treatments in seagrasses, although the fish did not appear to directly affect the abundance of epifauna. Nevertheless, the lack of shading effects during the final period indicates a rapid recovery of the assemblages. Such a rapid recovery of eelgrass bed habitat would be an advan-tage in the turbid events that occur in coastal areas.
5. CONCLUDING REMARKS
Our results suggest that eelgrass beds can be resistant to the cumulative effects of density reduction, sediment nutrient enrichment, and shading be -cause we observed no effects on measured variables when all our treatments were applied simultaneously (D+N+ S+). The studied meadow also showed resili-ence to multiple stressors, as most effects observed during the study became undetectable by the end of the experiment. The nature of stressors and their interactions varied in their influence on species, suggesting that other stressors, alone or in combi -nation with others, may also affect communities in an un predictable manner. Thus, further manipulative studies are required to improve our understanding of the effects of multiple stressors on assemblages and habitat-forming species.
Our results indicate that most of the epifaunal assemblage and its diversity are linked to habitat availability and to epiphytic algae as food resources. Shading affects eelgrass by reducing leaf elongation, non-structural carbohydrate content, and shoot den-sity. Density-reduced plots sustained high epifaunal densities, thereby illustrating the importance of eel-grass even at low shoot densities. We also observed that the nutrient enrichment of sediments increased shoot density, although it negatively affected epifau-nal biodiversity. Most of our treatments did not affect species richness, confirming that complementary metrics (e.g. diversity-related indices, univariate and multivariate data, see Cimon & Cusson 2018) are required to document the effects of stressors on com-munity stability.
Studies involving multiple stressors are becoming more common; however, a greater number are still re -quired, as they are essential for documenting potential trajectories and the types of interaction following mul-tiple disturbances/stressors. Here we observed addi-tive, antagonistic, and negative syner gistic interac-tions among our treatments, and most interacinterac-tions highlighted a dominance of one stressor over another.
Our results testify to the importance of field experi-ments that include multiple disturbances and stressors and their interactions to estimate the effects on com-munity assemblages, as well as the importance of proper testing to ascertain cumulative effects rather than assuming additivity.
Acknowledgements. We thank C. Valcourt, G. Grosbois, M.
Wauthy, S. Pelletier, Y. Valcourt, and D. Villeneuve for help in the field; M.-P. Fournier, J. Tremblay, and G. Bonvalot-Maltais are thanked for help in the lab. We thank Dr. M. B. Hay for verifying the English. We thank 3 anonymous refer-ees for fruitful comments. The project is a research contribu-tion of Québec-Océan. This article is part of the PhD thesis of S.C., who was supported by a scholarship from NSERC (Natural Sciences and Engineering Research Council of Canada, Alexander Graham Bell Canada Graduate Scholar-ships-Doctoral Program). This study was supported by grants from NSERC (Discovery Grant #371464-2009 and #05525-2017) to M.C.
LITERATURE CITED
Anderson MJ, Gorley RN, Clarke KR (2008) PERMANOVA+ for PRIMER: Guide to software and statistical methods. PRIMER-E, Plymouth
Backman TW, Barilotti DC (1976) Irradiance reduction: effects on standing crops of the eelgrass Zostera marina in a coastal lagoon. Mar Biol 34: 33−40
Bellasio C, Fini A, Ferrini F (2014) Evaluation of a high throughput starch analysis optimised for wood. PLOS ONE 9: e86645
Bergeron P, Bourget E (1984) Effet du froid et des glaces sur les peuplements intertidaux des régions nordiques, par-ticulièrement dans l’estuaire du Saint-Laurent. Oceanis 10: 279−304
Bologna PAX, Heck KL (1999) Macrofaunal associations with seagrass epiphytes: relative importance of trophic and structural characteristics. J Exp Mar Biol Ecol 242: 21−39
Boström C, Bonsdorff E (2000) Zoobenthic community establishment and habitat complexity — the importance of sea -grass shoot-density, morphology and physical distur-bance for faunal recruitment. Mar Ecol Prog Ser 205: 123−138
Bulthuis DA, Woelkerling WJ (1981) Effects of in situ nitro-gen and phosphorus enrichment of the sediments on the seagrass Heterozostera tasmanica (Martens ex Aschers.) den Hartog in Western Port, Victoria, Australia. J Exp Mar Biol Ecol 53: 193−207
Burke MK, Dennison WC, Moore KA (1996) Non-structural carbohydrate reserves of eelgrass Zostera marina. Mar Ecol Prog Ser 137: 195−201
Calizza E, Costantini ML, Careddu G, Rossi L (2017) Effect of habitat degradation on competition, carrying capacity, and species assemblage stability. Ecol Evol 7: 5784−5796 Cardoso PG, Raffaelli D, Lillebo AI, Verdelhos T, Pardal MA (2008) The impact of extreme flooding events and anthro -pogenic stressors on the macrobenthic communities’ dynamics. Estuar Coast Shelf Sci 76: 553−565
Chow PS, Landhäusser SM (2004) A method for routine measurements of total sugar and starch content in woody
plant tissues. Tree Physiol 24: 1129−1136
Cimon S, Cusson M (2018) Impact of multiple disturbances and stress on the temporal trajectories and resilience of benthic intertidal communities. Ecosphere 9: e02467 Clarke KR, Gorley RN (2015) PRIMER v7: User
manual/tuto-rial. PRIMER-E, Plymouth
Clarke KR, Chapman MG, Somerfield PJ, Needham HR (2006) Dispersion-based weighting of species counts in assemblage analyses. Mar Ecol Prog Ser 320: 11−27 Clarke KR, Tweedley JR, Valesini FJ (2014) Simple shade
plots aid better long-term choices of data pre-treatment in multivariate assemblage studies. J Mar Biol Assoc UK 94: 1−16
Collier CJ, Lavery PS, Ralph PJ, Masini RJ (2009) Shade-induced response and recovery of the seagrass Posidonia
sinuosa. J Exp Mar Biol Ecol 370: 89−103
Connolly RM (1995) Effects of removal of seagrass canopy on assemblages of small, motile invertebrates. Mar Ecol Prog Ser 118: 129−137
Côté IM, Darling ES, Brown CJ (2016) Interactions among ecosystem stressors and their importance in conserva-tion. Proc R Soc B 283: 20152592
Crain CM, Kroeker K, Halpern BS (2008) Interactive and cumulative effects of multiple human stressors in marine systems. Ecol Lett 11: 1304−1315
Darling ES, Côté IM (2008) Quantifying the evidence for ecological synergies. Ecol Lett 11: 1278−1286
Dayton PK (1972) Toward an understanding of community resilience and the potential effects of enrichments to the benthos at McMurdo Sound, Antarctica. Allen Press, Lawrence, KS
Deslauriers A, Fournier MP, Cartenì F, Mackay J (2019) Phe-nological shifts in conifer species stressed by spruce bud-worm defoliation. Tree Physiol 39: 590−605
Drew EA (1983) Sugars, cytolitols and seagrass phylogeny. Aquat Bot 15: 387−408
Duarte CM (2002) The future of seagrass meadows. Environ Conserv 29: 192−206
Duffy JE (2006) Biodiversity and the functioning of seagrass ecosystems. Mar Ecol Prog Ser 311: 233−250
Duffy JE, Reynolds PL, Boström C, Coyer JA and others (2015) Biodiversity mediates top-down control in eel-grass ecosystems: a global comparative-experimental approach. Ecol Lett 18: 696−705
Edgar GJ (1990) The use of the size structure of benthic macrofaunal communities to estimate faunal biomass and secondary production. J Exp Mar Biol Ecol 137: 195−214
Edgar GJ, Robertson AI (1992) The influence of seagrass structure on the distribution and abundance of mobile epifauna: pattern and process in a Western Australian
Amphibolis bed. J Exp Mar Biol Ecol 160: 13−31
Enríquez S, Pantoja-Reyes NI (2005) Form-function analysis of the effect of canopy morphology on leaf self-shading in the seagrass Thalassia testudinum. Oecologia 145: 235–243
Eriander L (2017) Light requirements for successful restora-tion of eelgrass (Zostera marina L.) in a high latitude environment — acclimatization, growth and carbohydrate storage. J Exp Mar Biol Ecol 496: 37−48
Eriksson BK, Ljunggren L, Sandstrom A, Johansson G and others (2009) Declines in predatory fish promote bloom-forming macroalgae. Ecol Appl 19: 1975−1988
Fahrig L (2003) Effects of habitat fragmentation on bio -diversity. Annu Rev Ecol Evol Syst 34: 487−515
Fokeera-Wahedally SBM, Bhikajee M (2005) The effects of in situ shading on the growth of a seagrass, Syringodium
isoetifolium. Estuar Coast Shelf Sci 64: 149−155
Galic N, Sullivan LL, Grimm V, Forbes VE (2018) When things don’t add up: quantifying impacts of multiple stressors from individual metabolism to ecosystem pro-cessing. Ecol Lett 21: 568−577
Gartner A, Lavery PS, McMahon K, Brearley A, Barwick H (2010) Light reductions drive macroinvertebrate changes in Amphibolis griffithii seagrass habitat. Mar Ecol Prog Ser 401: 87−100
Gartner A, Tuya F, Lavery PS, McMahon K (2013) Habitat preferences of macroinvertebrate fauna among sea-grasses with varying structural forms. J Exp Mar Biol Ecol 439: 143−151
Gil M, Armitage AR, Fourqurean JW (2006) Nutrient im -pacts on epifaunal density and species composition in a subtropical seagrass bed. Hydrobiologia 569: 437−447 Gladstone-Gallagher RV, Hughes RW, Douglas EJ, Pilditch
CA (2018) Biomassdependent seagrass resilience to sed -iment eutrophication. J Exp Mar Biol Ecol 501: 54−64 Grant C, Provencher L (2007) Caractérisation de l’habitat et
de la faune des herbiers de Zostera marina (L.) de la péninsule de Manicouagan (Québec). Rapp Tech Can Sci Halieut Aquat 2772
Grime JP (1977) Evidence for the existence of three primary strategies in plants and its relevance to ecological and evolutionary theory. Am Nat 111: 1169−1194
Halpern BS, Selkoe KA, Micheli F, Kappel CV (2007) Evalu-ating and ranking the vulnerability of global marine ecosystems to anthropogenic threats. Conserv Biol 21: 1301−1315
Hauxwell J, Cebrián J, Valiela I (2003) Eelgrass Zostera
marina loss in temperate estuaries: relationship to
landderived nitrogen loads and effect of light limitation im -posed by algae. Mar Ecol Prog Ser 247: 59−73
Heck KL Jr, Hays G, Orth RJ (2003) Critical evaluation of the nursery role hypothesis for seagrass meadows. Mar Ecol Prog Ser 253: 123−136
Hemminga MA (1998) The root/rhizome system of sea-grasses: an asset and a burden. J Sea Res 39: 183−196 Hemminga MA, Duarte CM (2000) Seagrass ecology.
Cam-bridge University Press, CamCam-bridge
Herkul K, Kotta J (2009) Effects of eelgrass (Zostera marina) canopy removal and sediment addition on sediment characteristics and benthic communities in the Northern Baltic Sea. Mar Ecol 30: 74−82
Hughes AR, Bando KJ, Rodriguez LF, Williams SL (2004) Relative effects of grazers and nutrients on seagrasses: a meta-analysis approach. Mar Ecol Prog Ser 282: 87−99 Jaschinski S, Sommer U (2008) Top-down and bottom-up
control in an eelgrass-epiphyte system. Oikos 117: 754−762
Jones CG, Lawton JH, Shachak M (1994) Organisms as eco-system engineers. Oikos 69: 373−386
Krause-Jensen D, Middelboe AL, Sand-Jensen K, Chris-tensen PB (2000) Eelgrass, Zostera marina, growth along depth gradients: upper boundaries of the variation as a powerful predictive tool. Oikos 91: 233−244
Lamb JB, van de Water JAJM, Bourne DG, Altier C and oth-ers (2017) Seagrass ecosystems reduce exposure to bac-terial pathogens of humans, fishes, and invertebrates. Science 355: 731−733
Lee KS, Dunton KH (2000) Effects of nitrogen enrichment on biomass allocation, growth, and leaf morphology of the
seagrass Thalassia testudinum. Mar Ecol Prog Ser 196: 39−48
Lee KS, Park SR, Kim YK (2007) Effects of irradiance, tem-perature, and nutrients on growth dynamics of sea-grasses: a review. J Exp Mar Biol Ecol 350: 144−175 Lefcheck JS, Wilcox DJ, Murphy RR, Marion SR, Orth RJ
(2017) Multiple stressors threaten the imperiled coastal foundation species eelgrass (Zostera marina) in Chesa-peake Bay, USA. Glob Chang Biol 23: 3474−3483 Lundquist CJ, Jones TC, Parkes SM, Bulmer RH (2018)
Changes in benthic community structure and sediment characteristics after natural recolonisation of the sea-grass Zostera muelleri. Sci Rep 8: 13250
MacNeill GJ, Mehrpouyan S, Minow MAA, Patterson JA, Tetlow IJ, Emes MJ (2017) Starch as a source, starch as a sink: the bifunctional role of starch in carbon allocation. J Exp Bot 68: 4433−4453
Marbà N, Hemminga MA, Mateo MA, Duarte CM, Mass YEM, Terrados J, Gacia E (2002) Carbon and nitrogen translocation between seagrass ramets. Mar Ecol Prog Ser 226: 287−300
Marbà N, Hemminga MA, Duarte CM (2006) Resource translocation within seagrass clones: allometric scaling to plant size and productivity. Oecologia 150: 362−372 Martel MC, Provencher L, Grant C, Ellefsen HF, Pereira S
(2009) Distribution and description of eelgrass beds in Québec. DFO Can Sci Advis Sec Res Doc 2009/050 Montgomery DC, Peck EA, Vining GG (2012) Introduction
to linear regression analysis, 5th edn. John Wiley & Sons, Hoboken, NJ
Moreno-Marín F, Brun FG, Pedersen MF (2018) Additive response to multiple environmental stressors in the seagrass Zostera marina L. Limnol Oceanogr 63: 1528−1544
Olesen B, Sand-Jensen K (1994) Patch dynamics of eelgrass
Zostera marina. Mar Ecol Prog Ser 106: 147−156
Olesen B, Enríquez S, Duarte CM, Sand-Jensen K (2002) Depth-acclimation of photosynthesis, morphology and demography of Posidonia oceanica and Cymodocea no
-dosa in the Spanish Mediterranean Sea. Mar Ecol Prog
Ser 236: 89−97
Orth RJ (1977) Effect of nutrient enrichment on growth of the eelgrass Zostera marina in the Chesapeake Bay, Vir-ginia, USA. Mar Biol 44: 187−194
Orth RJ, Heck KL, van Montfrans J (1984) Faunal communi-ties in seagrass beds: a review of the influence of plant structure and prey characteristics on predator-prey rela-tionships. Estuaries 7: 339−350
Otero-Schmitt J, Cruz R, Garcia C, Rolán-Alvarez E (1997) Feeding strategy and habitat choice in Littorina saxatilis (Gastropoda: Prosobranchia) and their role in the origin and maintenance of a sympatric polymorphism. Ophelia 46: 205−216
Parsons TR, Maita Y, Lalli CM (1984) Determination of chlorophylls and total carotenoids: spectrophotometric method. In: Parsons TR, Maita Y, Lalli CM (eds) A man-ual of chemical & biological methods for seawater analy-sis. Pergamon, Amsterdam, p 101−104
Pihl L, Baden S, Kautsky N, Ronnback P, Soderqvist T, Troell M, Wennhage H (2006) Shift in fish assemblage structure due to loss of seagrass Zostera marina habitats in Swe-den. Estuar Coast Shelf Sci 67: 123−132
Provencher L, Deslandes S (2012) Utilisation d’images satel-litaires pour évaluer la superficie, l’étendue et la densité de l’herbier de la zostère marine (Zostera marina) de la