Publisher’s version / Version de l'éditeur:
Vous avez des questions? Nous pouvons vous aider. Pour communiquer directement avec un auteur, consultez la
première page de la revue dans laquelle son article a été publié afin de trouver ses coordonnées. Si vous n’arrivez
pas à les repérer, communiquez avec nous à [email protected].
Questions? Contact the NRC Publications Archive team at
[email protected]. If you wish to email the authors directly, please see the
first page of the publication for their contact information.
https://publications-cnrc.canada.ca/fra/droits
L’accès à ce site Web et l’utilisation de son contenu sont assujettis aux conditions présentées dans le site
LISEZ CES CONDITIONS ATTENTIVEMENT AVANT D’UTILISER CE SITE WEB.
Nature Plants, 6, 8, pp. 929-941, 2020-08-10
READ THESE TERMS AND CONDITIONS CAREFULLY BEFORE USING THIS WEBSITE.
https://nrc-publications.canada.ca/eng/copyright
NRC Publications Archive Record / Notice des Archives des publications du CNRC :
https://nrc-publications.canada.ca/eng/view/object/?id=25c445f0-cc0f-47d4-ba06-67d4dd98cb26
https://publications-cnrc.canada.ca/fra/voir/objet/?id=25c445f0-cc0f-47d4-ba06-67d4dd98cb26
Archives des publications du CNRC
This publication could be one of several versions: author’s original, accepted manuscript or the publisher’s version. /
La version de cette publication peut être l’une des suivantes : la version prépublication de l’auteur, la version
acceptée du manuscrit ou la version de l’éditeur.
For the publisher’s version, please access the DOI link below./ Pour consulter la version de l’éditeur, utilisez le lien
DOI ci-dessous.
https://doi.org/10.1038/s41477-020-0735-y
Access and use of this website and the material on it are subject to the Terms and Conditions set forth at
A high-contiguity Brassica nigra genome localizes active centromeres
and defines the ancestral Brassica genome
Perumal, Sampath; Koh, Chu Shin; Jin, Lingling; Buchwaldt, Miles; Higgins,
Erin E.; Zheng, Chunfang; Sankoff, David; Robinson, Stephen J.; Kagale,
Sateesh; Navabi, Zahra-Katy; Tang, Lily; Horner, Kyla N.; He, Zhesi;
Bancroft, Ian; Chalhoub, Boulos; Sharpe, Andrew G.; Parkin, Isobel A. P.
1Agriculture and Agri-Food Canada, Saskatoon, Saskatchewan, Canada. 2Global Institute for Food Security, University of Saskatchewan, Saskatoon, Saskatchewan, Canada. 3Department of Computing Science, Thompson Rivers University, Kamloops, British Columbia, Canada. 4Department of Mathematics and Statistics, University of Ottawa, Ottawa, Ontario, Canada. 5National Research Council Canada, Saskatoon, Saskatchewan, Canada. 6Department of Biology, University of York, York, UK. 7Institute of Crop Science, Zhejiang University, Hangzhou, China. ✉e-mail: [email protected];
D
ecoding complete genome information is vital for
under-standing genome structure, providing a full complement of
both the genic and repeat repertoire and uncovering
struc-tural variation. Such information also provides a foundational tool
for crop improvement to facilitate the rapid selection of
agronomi-cally important traits and to exploit modern breeding tools such as
genome editing
1–3. Whole-genome duplication and abundant repeat
expansion has led to an approximate 660-fold variation in genome
size among angiosperms
4and, in particular, the low complexity
of repetitive regions, including centromeric, pericentromeric and
telomeric regions, creates challenges for complete genome assembly
using short-read (SR) sequence data
5. Centromeres are of
particu-lar interest due to their biological importance, yet resolving their
structure has been frustrated by the prevalence of repetitive
ele-ments; commonly these are marked by the presence of short,
tan-demly repeated sequences and, although similar to one other very
small plant genome
6, no such sequence has been identified for
Brassica nigra
7,8.
Recent advances in long-read (LR) sequencing
technolo-gies, such as Pacific Biosciences (PacBio) and Oxford Nanopore
Technology (ONT)
9, combined with genome scaffolding methods
such as optical mapping and chromosome conformation capture
(Hi-C), have led to a paradigm shift in our ability to obtain
com-plete and contiguous genome assemblies
9–11. Both approaches can
produce remarkably long reads, although the error rate is markedly
higher than more accurate Illumina short reads, which until recently
limited their use to scaffolding in improving assembly contiguity
12.
However, correction algorithms to reduce error rates and recent
technological improvements have increased the output and quality
of LR sequence data, making possible the routine and cost-effective
assembly of large eukaryotic genomes
13.
The Brassicaceae is an important plant family with approximately
3,800 species including commercially important vegetable, fodder,
oilseed and ornamental crops. The Brassiceae tribe has a history of
extensive whole-genome duplication events, including the Brassica
genus-specific whole-genome triplication (WGT), which occurred
approximately 22.5 million years ago (Ma) (ref.
14,15) and is assumed
to be shared by the three important diploids (Brassica rapa, AA,
2n = 2x =20; B. nigra, BB, 2n = 2x = 16; and Brassica oleracea, CC,
2n = 2x = 18) that form the vertices of U’s triangle
16. Among these
three, B. nigra (B genome) has been neglected with regard to both
genetic analyses and selection through breeding. Due to its
lim-ited domestication and its production as out-crossing populations,
it has retained valuable allelic diversity compared to its relatives,
making it an untapped repository for Brassica breeding
17. Among
the six species of U’s triangle, five have been sequenced including,
most recently, B. nigra, but the assemblies cover at most 80% of the
estimated genome size and almost all were very highly fragmented
due to the sole use of SR
18–22. Recently the B. rapa reference genome
was improved using PacBio sequencing
21, and one genotype each of
A high-contiguity Brassica nigra genome localizes
active centromeres and defines the ancestral
Brassica genome
Sampath Perumal
1, Chu Shin Koh
2, Lingling Jin
3, Miles Buchwaldt
1, Erin E. Higgins
1, Chunfang Zheng
4,
David Sankoff
4, Stephen J. Robinson
1, Sateesh Kagale
5, Zahra-Katy Navabi
1,2, Lily Tang
1,
Kyla N. Horner
1, Zhesi He
6, Ian Bancroft
6, Boulos Chalhoub
7, Andrew G. Sharpe
2✉ and
Isobel A. P. Parkin
1✉
It is only recently, with the advent of long-read sequencing technologies, that we are beginning to uncover previously uncharted
regions of complex and inherently recursive plant genomes. To comprehensively study and exploit the genome of the neglected
oilseed Brassica nigra, we generated two high-quality nanopore de novo genome assemblies. The N50 contig lengths for the two
assemblies were 17.1 Mb (12 contigs), one of the best among 324 sequenced plant genomes, and 0.29 Mb (424 contigs),
respec-tively, reflecting recent improvements in the technology. Comparison with a de novo short-read assembly corroborated genome
integrity and quantified sequence-related error rates (0.2%). The contiguity and coverage allowed unprecedented access to
low-complexity regions of the genome. Pericentromeric regions and coincidence of hypomethylation enabled localization of
active centromeres and identified centromere-associated ALE family retro-elements that appear to have proliferated through
relatively recent nested transposition events (<1 Ma). Genomic distances calculated based on synteny relationships were used
to define a post-triplication Brassica-specific ancestral genome, and to calculate the extensive rearrangements that define the
evolutionary distance separating B. nigra from its diploid relatives.
B. rapa and B. oleracea was sequenced using a combination of ONT
and optical maps, demonstrating the use of these technologies for
complex duplicated genomes
23.
The work described represents the near-complete assembly of
two B. nigra genomes (Ni100 and
CN115125
) using a combination
of ONT sequencing, Hi-C and genetic map-based scaffolding. A SR
assembly of Ni100 allowed comprehensive benchmarking of the LR
assemblies. Remarkably, direct methylome profiling using the ONT
data allowed the resolution of candidate active centromeres of the
chromosomes, a feature previously unannotated in SR assemblies.
In addition, computationally defined genomic distances between
the three Brassica diploid genomes allowed the construction of an
ancestral Brassica-specific genome.
Results
A combination of nanopore sequencing, Illumina error
correc-tion, Hi-C sequencing and genetic mapping was used to generate
two de novo assemblies for the diploid Brassica species, B. nigra
(genotypes Ni100 and
CN115125
). Identical sequential steps were
followed to assemble the contigs for each genome, including the
development of high-quality sequencing datasets, genome
assem-bly and polishing with SR (Supplementary Fig. 1). After testing a
number of published assembly software pipelines (Supplementary
Table 1), the final contigs were derived from SMARTdenovo using
30–64× coverage of CANU
24-corrected reads.
Although largely context dependent, nanopore sequence data
can show error rates up to 15%. Thus, sequence correction was
com-pleted using eight rounds of Pilon
25with approximately 100×
cover-age of Illumina data, and quality was assessed at each round through
benchmarking universal single-copy orthologue (BUSCO)
26scores
and qualimap
27(Supplementary Fig. 2 and Supplementary Table 2).
For both genotypes the read alignment rate was high (>98%) and
both tools indicated a significant improvement after correction,
suggesting final error rates of between 0.8% (
CN115125
) and 0.2%
(Ni100) at the base pair (bp) level. The two LR assemblies were
gen-erated over a period of approximately 12 months, during which time
ONT upgraded their library construction kits, pore chemistry and
base-calling software. The combined impact of this was noted in an
overall improvement in quality, average read length and useable data
output for Ni100 and in final assembly contiguity (Supplementary
Tables 3–5). Because the
CN115125
assembly was more fragmented
(compare a contig N50 length of 0.288 Mb with 17.1 Mb),
scaffold-ing usscaffold-ing proximity ligation, a combination of Chicago and Hi-C,
was used to improve contiguity by up to 193-fold, with a final
N50 length of 55.7 Mb (Supplementary Fig. 3). In both instances
genetic anchoring was used to generate the final chromosome-scale
assemblies of the two B. nigra genotypes,
CN115125
(C2-LR)
and Ni100 (Ni100-LR) (Table
1
, Fig.
1
, Supplementary Fig. 4 and
Supplementary Table 6).
A SR Illumina de novo assembly for B. nigra genotype Ni100
(Ni100-SR) was used for further validation of the nanopore
assemblies. The Ni100-SR assembly has a total length of 446.5 Mb
from 19,203 scaffolds, of which 367.2 Mb was anchored to eight
pseudo-chromosomes (Table
1
and Supplementary Table 6).
Alignment and visualization of corresponding pseudo-chromosome
sequences from the three B. nigra assemblies revealed high levels
of collinearity (Fig.
2a
). Such high-level comparisons can elucidate
large-scale chromosome rearrangements and a number of
translo-cations and inversions were noted—in particular, a large inversion
at the bottom of B4 distinguished the SR assembly (Supplementary
Fig. 5). This region on B4 was difficult to scaffold in the SR assembly
due to limited recombination and shorter scaffold lengths; for such
regions in the SR assembly, the order was largely inferred based on
synteny data from Arabidopsis thaliana. It was apparent that there
was expansion of the ONT assemblies in regions presumed to be
pericentromeric, as shown in Fig.
2
. The level of coverage of these
regions also varied between the LR assemblies, with Ni100-LR
hav-ing the highest.
Gene annotation from the two LR and two SR assemblies
(Ni100-SR and the previously published YZ12151 (ref.
22)) were
rationalized to generate a final B. nigra gene complement of
67,030 and 59,877 gene models in the two genotypes,
CN115125
and Ni100, respectively. These numbers are in line with the
pre-dicted pan-gene content of the diploid B. oleracea, with 63,865 ± 31
genes
28. An additional 3,546 genes were annotated in Ni100-LR
compared to the Ni100-SR assembly. A homology search performed
using GMAP
29(minimum identity and coverage of 95%) indicated
that only 914 of the additional genes were unique to the Ni100-LR
assembly (Supplementary Fig. 6a). This discrepancy was due both
to co-assembly of highly similar genes in the SR data and
assem-bly errors that precluded accurate gene annotation. Read
map-ping of Illumina data back to the SR and LR assemblies showed
a marked increase of 9% multi-mapping reads in the latter with a
concomitant reduction in non-concordant matches, suggesting the
resolution of duplicated or highly homologous sequences in the LR
assembly (Supplementary Table 7). The recent ONT assemblies of
B. rapa and B. oleracea studied the self-incompatibility locus or the
S locus region which, due to its repetitive structure, has been
notori-ously difficult to assemble, to infer the enhanced contiguity of the
LR-derived genome sequences
30. The S locus region was identified
and compared in the two B. nigra LR assemblies, showing
com-plete assembly of two differing S locus haplotypes (Supplementary
Fig. 7). A comparison between the two ONT assemblies would have
been expected to identify such genotype differences. Along with
approximately 10% of the annotated genes being specific to either
assembly, the
CN115125
genotype showed a higher prevalence of
tandemly and proximally duplicated genes (Supplementary Fig. 6c
and Supplementary Tables 8, 9 and 10).
To investigate global gene content across the genomes, annotated
genes from the three representations of B. nigra were clustered with
genes from B. rapa, B. oleracea and A. thaliana using Orthofinder
31(Supplementary Figs. 6d and 8a and Supplementary Table 11). The
diploid Brassica species ranged in number of species-specific genes,
with B. rapa containing the least while B. nigra contained the most
(Supplementary Fig. 8b,c and Supplementary Table 11). Sixty-nine
of B. nigra-specific gene families were deemed to be rapidly evolving
by CAFE
32, and functional analyses demonstrated that the genes were
enriched in response to abiotic or biotic stresses, structural molecule
activity and unknown molecular functions (Supplementary Fig. 9).
Since it is often noted that families related to stress are more prone
to differential copy number variation, differences in R genes,
tran-scription factors (TFs) and protein-kinase families were assessed
in each of the genomes. The distribution of R gene families across
the species appeared to be directly related to genome size and/or
expansion of the transposable element complement, with the larger
genomes of B. oleracea and B. nigra showing the greatest
expan-sion of R genes irrespective of genotype (Supplementary Table 12).
CN115125
in particular showed increased membership of TF
fami-lies, with both B. nigra genotypes showing a higher prevalence of
B3, C2H2 and NAC domain TFs compared to their diploid relatives
(Supplementary Tables 13 and 14).
Beyond the large chromosomal rearrangements, structural
vari-ations (SVs) in the range of 100 bp to a few Mb, including deletions,
insertions, duplications, inversions and translocations that
differen-tiate genotypes, were catalogued between both genomes using ONT
reads. The raw ONT reads from Ni100 and
CN115125
were aligned
to both LR assemblies, and SVs were quantified using two
differ-ent SV callers (Sniffles
33and Picky
34). Self-alignment was used to
estimate a false-positive rate for each genome, which was higher for
the
CN115125
assembly (6,307 versus 2,230 events) (Supplementary
Table 15 and Supplementary Fig. 10). High-quality SVs were
considered to be those identified with both software packages
(Supplementary Table 15). Dependent on direction of comparison,
approximately 6,000–7,000 SVs differentiated the two genotypes,
with deletions being the most prevalent (between 63.4 and 70%
of events). A small number of deletions were coincident with gene
annotations, affecting between 865 and 638 genes (Supplementary
Table 16), while a notable proportion was found proximal to genes
and thus might have been anticipated to impact expression and/
or gene copy number (Supplementary Fig. 10b,c). A set of 161 and
136 SVs in the two genomes were found to overlap completely with
annotated full-length, functional, transposable elements, suggesting
a mechanism for their formation (Supplementary Table 17).
A Brassica B genome-specific repeat library with 1,324
fami-lies was developed using multiple annotation tools and was used
to survey the repetitive genome fraction of the LR (Ni100-LR,
C2-LR) and SR B. nigra assemblies (Ni100-SR and YZ12151-SR)
(Supplementary Table 18). Repeats spanned 49 and 54% of the
CN115125
and Ni100-LR genome assemblies, respectively,
com-pared to 33% (YZ12151) and 41% (Ni100) in the two SR assemblies.
The increase in repeat content of the LR assemblies, which closely
mirrors the increase in genome captured, predominantly resulted
from a rise in annotated class I transposons, in particular Gypsy
and Copia elements, which increased by 8% (79 versus 130 Mb)
and 4.1% (26 versus 51 Mb), respectively, in the Ni100-LR
assem-bly compared to the Ni100-SR assemassem-bly (Supplementary Table
18). The distribution of repeats revealed that class I
retrotranspo-sons were more common in traditionally heterochromatic regions
such as centromeric, pericentromeric and subtelomeric regions,
while class II DNA transposons were more evenly distributed across
the genome (Fig.
1
and Supplementary Fig. 4). The identification
of centromere- and telomere-specific repeats suggested that ONT
assemblies provide more complete access to the chromosome
struc-ture (Supplementary Fig. 11). The repeat fraction appears to reflect
the estimated genome size of the diploid Brassicas, with B. nigra
lying between B. oleracea (~60%)
23and B. rapa (~38%)
21,23.
Almost all families were similarly distributed in the two LR
assemblies apart from LTR-Gypsy elements, which were ~5%
higher in Ni100, suggesting either Ni100-specific amplification or
better assembly of these elements (Supplementary Table 18). Full-
length long terminal repeat retrotransposons (FL-LTR-RTs) were
annotated and compared in Ni100-SR and the two LR assemblies.
A total of 1,220, 4,491 and 3,381 FL-LTR-RTs were identified in
Ni100-SR, Ni100-LR and C2-LR assemblies, respectively, with an
average length of ~6 kb (Supplementary Table 19 and Supplementary
Fig. 12a). The increased annotation of such elements in the LR
assemblies indicates the benefits of the technology in regard to
assemblage of low-complexity, redundant sequences. Based on
repeat domain protein homology, the FL-LTR-RTs were grouped
into 14 different families where 41–44% had homology with known
Gypsy families, 38–42% with Copia families and 13–20% were
unknown FL-LTR-RTs (Fig.
3a
). Notably, among the 14 FL-LTR-RT
families, members of the ALE (Copia) and OTA (Gypsy) families
were specifically increased in copy number in the LR assemblies and
more so in the Ni100-LR assembly (Fig.
3a
, Supplementary Table 19
and Supplementary Fig. 12a).
The age distribution analysis of FL-LTR-RT elements, based on
divergence of the LTR region, showed recent amplification of LTRs
in both genomes. About 91% (4,068) and 86% (2,912) of FL-LTR-RTs
in Ni100-LR and C2-LR assemblies, respectively, were amplified
<2 Ma (Fig.
3b
, Supplementary Figs 12b and 13 and Supplementary
Table 19), with more recent and continuous proliferation of LTRs
(3,056, 68%) aged <1 Ma in Ni100-LR compared to C2-LR. ALE
family elements showed more recent amplification (<0.2 Ma) in
Ni100-LR compared to C2-LR, while OTA LTRs showed a more
consistent pattern between the two genomes. Analysis of the
inser-tion sites revealed that 405 OTA (59%) and 391 ALE (42%) were
conserved in both genomes and, in line with the increase in density,
there was a higher percentage of uniquely inserted ALE elements in
the Ni100-LR genome compared to the C2-LR genome (Fig.
3c
). A
phylogenetic analysis of ALE and OTA FL-LTRs suggested Ni100
genotype-specific amplification of particular members of each
fam-ily (Supplementary Fig. 14).
Oxford Nanopore Technology allows direct identification of
base modifications such as 5-methylcytosine (5-mC)
35, although
this has yet to be demonstrated in plant genomes. Nanopolish was
used to detect 5-mC in the CG context in the ONT unassembled
reads. The 5-mC calls for Ni100 had an area under the curve score
of 0.9, with calls made at 58% of sites using the default
thresh-old of 2.5 for the log-likelihood ratio (Supplementary Fig. 15).
Table 1 | Statistics of the B. nigra genome SR and LR assemblies
Assembly YZ12151-SRa Ni100-SR Ni100-LR C2-LR
Estimated genome size (k = 17) (Mb) 591 570 570 608
Assembly size (Mb) 397 447 506 537 No. of chromosomes 8 8 8 8 Genome coverage 0.68 0.78 0.89 0.88 No. of sequences 2,546 19,203 58 963 Longest scaffold (Mb) 45 53 50 71 Scaffold N50 (Mb (no.)) 39 (5) 43.9 (5) 60.8 (4) 55.7 (5) Contig N50 (kb (no.)) 38 48 (2,256) 17,127 (12) 288 (424) Ambiguous bases ‘N’ (kb) 47,528 33,737 13 390
BUSCO (percentage complete) NA 97 97 94.4
Genomic copy content (%) 38 38 38 38
No. of genes 47,953 56,331 59,877 67,030
High-confidence genes (no. (%))b 55,141 (98) 57,798 (97) 64,071 (96)
Low-confidence genes (no. (%))b 1,190 (2) 2,079 (3) 2,959 (4)
Repeats and TE space (Mb (%)) 134 (33) 183 (41) 273 (54) 263 (49)
Uncharacterized genome (Mb (%)) 194 (33) 123 (22) 64 (11) 71 (12)
aInformation obtained from ref. 22; however, the repeat composition was based on the presented analyses being comparable across genomes. NA, not applicable due to not being provided in the reference.
The resultant calls were compared with methylation status detected
using whole-genome bisulfite sequence (WGBS) data, and showed
excellent correlation irrespective of filtering for quality of call
(R = 0.93–0.97; Fig.
4c–e
). A comparison of C2 genome
methyla-tion frequencies generated using the two methods showed a slightly
lower correlation (0.68–0.80), suggesting that raw read error rate
and sequence depth play a crucial role in analysis of methylation
using ONT reads (Supplementary Fig. 16). As perhaps expected,
the observed methylation showed patterns similar to those detected
for related Brassica diploids
18, with a higher prevalence of 5-mC in
repeat sequences and lower methylation rates across annotated gene
bodies (Fig.
1
and Supplementary Fig. 17). The efficacy of ONT
calls in the biological context of gene proximity mirrored the
pat-tern observed for the WGBS data, where methylation increases at
the transcriptional start and stop sites (Fig.
4a
). Because Nanopolish
employs short k-mers in its strategy to make a call, this could
impact physically linked calls; however, a comparison of the two
approaches to identifying differentially methylated CG islands was
in agreement, with some variance in the individual site calls within
the island (Supplementary Fig. 18).
Of note, there were regions of reduced methylation observed for
each chromosome that were also associated with regions of lower
gene and higher repeat density. Centromeric regions have been
asso-ciated in Brassica species and, more specifically in B. nigra, with
par-ticular sequences including centromeric retrotransposon of Brassica
(CRB) and a B genome-specific short repeat fragment (pBN 35)
7,36.
The distribution of these centromere-associated repeats aligned with
the detected hypomethylated regions. Furthermore, members of the
more prevalent ALE family, which also has >70% homology with
CRB, localized to the same region (Fig.
4b
and Supplementary Fig.
19). More recently, sequences identified through interaction with
the centromere-specific histone, CENH3, have been sequenced for
B. nigra, which co-aligned with the hypomethylated regions,
sug-gesting capture of much of the active centromere
37.
Although analyses of nested LTRs have generally been limited to
cereal genomes
38, they would be expected to play a major role in the
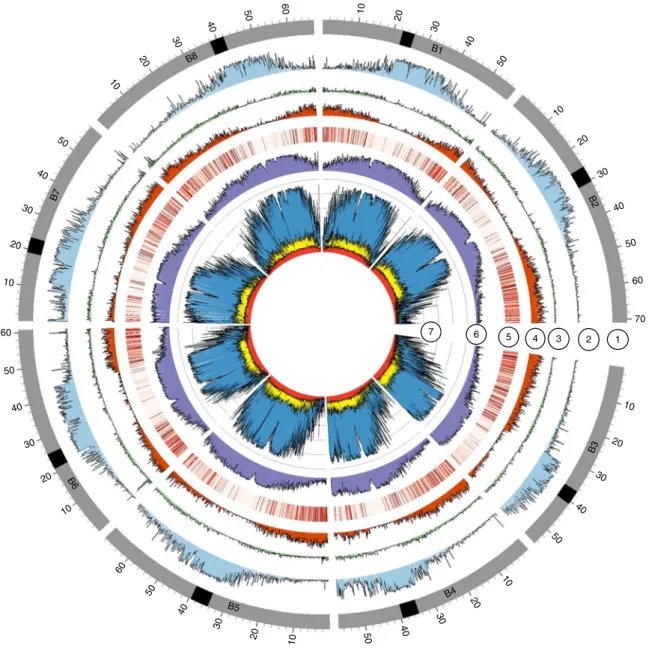
1 2 3 4 5 6 7 70 60 50 40 30 20 10 50 40 30 20 10 09 50 40 30 20 10 50 40 30 20 10 50 40 30 20 10 50 40 30 20 10 60 50 40 30 20 10 60 50 40 30 20 10 B4 B5 B3 B6 B7 B8 B1 B2
Fig. 1 | Genomic features of the B. nigra Ni100-LR assembly. Bands: (1) chromosomes with centromere positions (black band); (2) class I retrotransposons (nucleotides per 100-kb bins); (3) class II DNA repeats (nucleotides per 100-kb bins); (4) gene density (genes per 100-kb bins); (5) gene expression in leaf tissue (log10[average TPM] in 100-kb bins); (6) ONT CG methylation profile (ratio per 100 kb); (7) whole-genome bisulfite methylation profile (nucleotides per 100-kb bins). CG, blue; CHG, yellow; CHH, red.
evolution of chromosome structure and, specifically, in repeat-dense
regions such as centromeres. ALE-LTRs were prominent in the
cen-tromeric regions and revealed high levels of nested insertion (Fig.
5
and Supplementary Tables 20 and 21). Overall, 262 nested
transpos-able element events were found throughout the Ni100-LR genome of
which 68% (179) were in centromeric regions. Across all events, most
involved two LTRs while ten events involved more than two LTRs
(Fig.
5b
and Supplementary Table 21). In-depth characterization of
nested TEs in the centromeric region of chromosome B5 revealed that
24/26 of nested transposable element events were created by ALE-
LTRs, and all bar one of the events involved the same family member
inserting into the host LTR (Fig.
5
). The predominantly young age
(<1 Ma) of the nested elements suggests continuous and recent
rear-rangement of the centromeric regions by this mechanism (Fig.
5b
).
b Ni100-LR Ni100-SR 50 45 40 35 30 B5 25 20 15 10 5 0 55 60 35 30 25 20 15 10 5 0 B5 a NL1 NL2 NL3 NL4 NL5 NL6 NL7 NL8 NS1 NS2 NS3 NS4 NS5 NS6 NS7 NS8 CL1 CL2 CL3 CL4 CL5 CL6 CL7 CL8 0 10 19 29 38 4857 Mb 0 10 20 30 41 51 6171 Mb 0 9 18 28 37 4655 Mb 0 10 19 29 38 4857 Mb 0 10 19 29 39 49 5868 Mb 0 10 20 31 41 5161 Mb 0 10 19 29 39 4858 Mb 0 10 19 29 38 48 5767 Mb 0 10 21 3141 Mb 0 11 21 32 4253 Mb 0 9 18 28 3746 Mb 0 11 22 3344 Mb 0 10 21 31 4252 Mb 0 10 19 2938 Mb 0 10 20 3040 Mb 0 10 21 31 4252 Mb 0 10 21 31 4252 Mb 0 10 20 30 41 51 6171 Mb 0 10 20 30 39 4959 Mb 0 10 19 29 39 4858 Mb 0 10 19 29 38 4857 Mb 0 10 20 30 40 5060 Mb 0 10 21 31 4252 Mb 0 10 20 30 39 49 5969 MbFig. 2 | Comparison of B. nigra assemblies. a, Chromosome-level genome alignment of the Ni100-SR (NS) assembly (centre) against the LR assemblies, C2-LR (bottom) and Ni100-LR (top). The plot was created using Synvisio (https://github.com/kiranbandi/synvisio). b, Circular map generated using Circos89 showing the alignment of the SR and LR assemblies for chromosome B5 of Ni100.
Much effort has been placed on defining an ancestral Crucifer
genome that predates the supposed Brassica-specific WGT event
39.
Ancestral karyotype blocks were constructed for C2-LR and
Ni100-LR based on shared gene content and order for
ortholo-gous copies of each A. thaliana gene (Supplementary Fig. 20 and
Supplementary Table 9). Based on the two-step mode of genome
evolution inferred from the genomes of B. rapa and B. oleracea
40,
which is predicated on genome dominance in newly formed
poly-ploids, as expected the blocks were found predominantly in three
copies but with biased genic content. The least fractionated genome
maintains approximately 70% of the orthologous gene copies, while
the most fractionated, 1 (MF1) and MF2, retain approximately 49
and 42%, respectively (Supplementary Fig. 6a). A phylogenetic
analysis of the triplicated orthologues confirmed a shared WGT
among the Brassicas, with genes from across the three species of
each triplicated genome being more similar than those within the
same species (Fig.
6c
). Some smaller genomic regions were found in
additional syntenic blocks in each genome, which could represent
more ancient whole-genome duplication events or further localized
segmental translocations. These supplementary blocks were more
prevalent in the
CN115125
genome and could explain the higher
prevalence of duplicated genes in this genome (Supplementary
Fig. 6c and Supplementary Table 9).
Genomic differences or similarities among species, as well as
the mechanisms by which genomes evolve, can be identified by
comparing the order in which genes or syntenic blocks appear in
both close and distant relatives
41. The changes to block orders are
defined in terms of certain rearrangement operations within a
chro-mosome or between chrochro-mosomes, such as reversal, transposition,
fusion, fission and translocations. These types of operation can
be abstracted computationally as a series that results in a change
in the linear ordering of genes, which can then be used to
calcu-late the ‘genomic distance’ between one version of a genome and
another based on the most parsimonious evolutionary process. The
double-cut-and-join (DCJ) model
42was used to calculate pairwise
genomic distances between the three Brassica diploid genomes:
d
rapa,nigra= 96; d
nigra,oleracea= 98; d
rapa,oleracea= 52. In addition to
mea-surement of genomic difference or similarity, the order of blocks
in extant genomes provides rich information that can be used in
reconstruction of ancestral gene orders.
The ancestral Brassica genome, which minimizes the number
of rearrangements and thus genomic distances between the three
genomes, has nine ancestral chromosomes with a genome size of
321 Mb (Supplementary Fig. 21 and Supplementary Tables 22 and
23), consisting of 178 blocks. Each block in the ancestral genome
was mapped to the three extant genomes, as shown in Fig.
6a
, while
Supplementary Fig. 22 shows the detailed position of each
ances-tral block and its relative orientation. Based on calculated genomic
distances between the ancestral genome and each diploid, a rooted
ultrametric phylogenetic tree was approximated (Fig.
6a
) where
the position of the ancestor minimizes the total genomic distance.
Based on the molecular clock hypothesis, which assumes a
con-stant rate of change within lineages, the ancestor would be the most
recent common ancestor of B. rapa and B. oleracea while an overall
ancestor would be inferred almost 1/3 of the way along a path from
the median to B. nigra. The genomic distance between the genomes
corresponded with the age of divergence estimated from the
syn-onymous substitutions (Ks) rates among the coding regions of
orthologous gene pairs across the genomes, with B. oleracea/B. rapa
having diverged from B. nigra some 11.5 Ma while they diverged
from each other only 6.8 Ma (Fig.
6b
and Supplementary Table 24).
Discussion
Recent advancements and cost reductions in LR sequencing
tech-nologies are facilitating the generation of high-quality genome
assemblies, even for species that have evolved through
recur-sive whole-genome duplication (WGD) events
43. High-quality
and highly contiguous assemblies were generated for two
geno-types of the mesopolyploid B. nigra using nanopore sequencing,
chromosome-level scaffolding with Hi-C and genetic mapping data.
Remarkably, the final contig N50 length was 17.1 Mb (Ni100-LR),
one of the longest among the 324 plant genomes published to date
(Supplementary Fig. 23 and Supplementary Table 25). Comparing
the two ONT assemblies, the Ni100-LR assembly was better in
terms of contiguity and capture of repeat-rich centromeric regions,
reflecting rapid improvements in the technology and suggesting the
importance of both read length (11 versus 20 kb) and read
cover-age (29 versus 64×). Accurate quantification of errors in the Ni100
nanopore assembly, by comparison with an Illumina SR assembly
of the same genotype, suggested an accuracy of 99.986%, which
was improved only marginally (99.998%) with eight rounds of SR
polishing, suggesting that nanopore reads can provide highly
accu-rate assemblies of complex genomes. The error accu-rate was higher for
the
CN115125
assembly (0.8 versus 0.2%), again reflecting recent
improvements in ONT technology. The determined error rate may
also be impacted by genome complexity, since matching of Illumina
reads to regions of low complexity is generally limiting, and thus it
might be expected that error rates will be higher in such regions.
The recognition that both small (copy number, presence/
absence) and large (chromosomal rearrangements) SVs play an
important role in controlling key agronomic traits is gaining
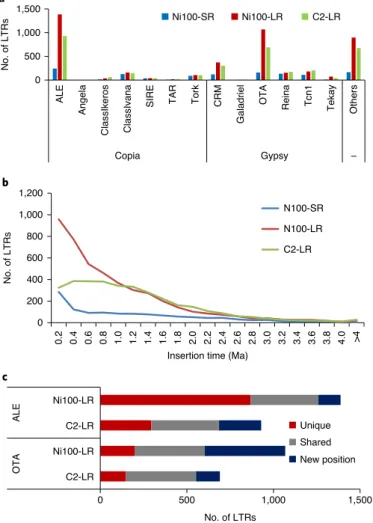
a b 0 500 1,000 1,500 ALE Angela ClassIkeros ClassIvanaSIRE TAR Tork CRM
Galadriel
OTA Reina Tcn1 Tekay
Others – Gypsy Copia No. of LTRs Ni100-SR Ni100-LR C2-LR c 0 500 1,000 1,500 C2-LR Ni100-LR C2-LR Ni100-LR OTA ALE No. of LTRs Unique Shared New position 0 200 400 600 800 1,000 1,200 0.2 0.4 0.6 0.8 1.0 1.2 1.4 1.6 1.8 2.0 2.2 2.4 2.6 2.8 3.0 3.2 3.4 3.6 3.8 4.0 >4 No. of LTRs
Insertion time (Ma)
N100-SR N100-LR C2-LR
Fig. 3 | Annotation of FL-LTR-RTs in B. nigra genomes. a, Copy number of FL-LTR-RTs from 14 different families. b, Age distribution of FL-LTR-RTs in three B. nigra assemblies. c, Comparison of insertion sites of two FL-LTR-RTs (ALE and OTA) in the ONT assemblies.
traction
44, yet deciphering such variation with SR data has proved
problematic
45. Although long-read sequencing technologies have
distinct advantages in predicting SVs
46, the current limitation is in
regard to developing and training software to accurately identify
such variants. The current analyses provided a detailed picture of
large-scale rearrangements that differentiate genotypes, and also
used two widely accepted software tools for detection of SVs, and
cross-validation was attempted to improve the accuracy of the calls.
The large difference in the number of events discovered by the
dif-ferent protocols probably reflects a combination of a higher false
and a lower positive discovery rate between the two. Considering
only the cross-validated calls, a large number of events differentiated
the two B. nigra genotypes, many of which would impact gene
expression and potentially phenotype, thus underlying the need for
improved tools for SV analyses to capture this valuable information.
It is well established that LR sequence data provide a more
comprehensive coverage of the genome
47, perhaps most
obvi-ously reflected in the increased capture of low-complexity repeat
sequences. Repeat analysis revealed about 14% more repeats in the
LR assembly of Ni100 compared to the SR assembly (54 versus 41%)
and, in particular, a more complete assembly of the repeat-rich
centromeric and pericentromeric space. Centromeres are
struc-tures essential for the maintenance of karyotype integrity during
meiosis, ensuring the fertility of developed gametes through strict
All-versus-all comparison d P ≤ 0.05 e Min. reads ≥10
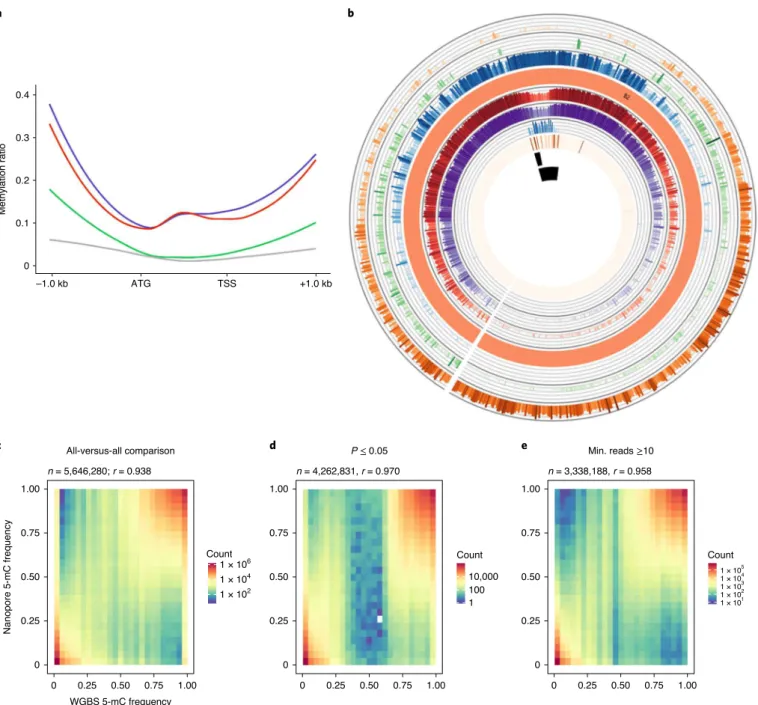
a Nanopore 5-mC frequency WGBS 5-mC frequency b c 0.4 0.3 0.2 0.1 Methylation ratio 0 –1.0 kb ATG TSS +1.0 kb 1.00 n = 5,646,280; r = 0.938 n = 4,262,831, r = 0.970 n = 3,338,188, r = 0.958 1.00
Count Count Count
10,000 100 1 1 × 10⁶ 1 × 10⁴ 1 × 10² 0.75 0.75 0.50 0.50 0.25 0.25 0 1.00 0.75 0.50 0.25 0 1.00 0.75 0.50 0.25 0 0 0 0.25 0.50 0.75 1.00 0 0.25 0.50 0.75 1.00 1 × 10⁵ 1 × 10⁴ 1 × 10³ 1 × 10² 1 × 101
Fig. 4 | Comparison of methylation data from WGBS and ONT sequencing in Ni100. a, Genome-wide WGBS and ONT methylation profile of syntenic genes: CpG (purple), CHG (green), CHH (grey) and CpG by ONT (red). b, Genome features of the B2 chromosome of the Ni100-LR assembly, from outer to inner circle: gene density, class II DNA transposons, class I retrotransposons, chromosome cartoon, methylation profile from ONT data, methylation profile based on WGBS, ALE copia, CRB, B. nigra-specific centromeric tandem repeat, putative centromere region. This plot was developed using the AccuSyn tool (https://accusyn.usask.ca/). c–e, Comparison of 5-mC frequency detected by WGBS and ONT; frequency distribution plot without filtering (c) and with filtering based on either calls P ≤ 0.05 (d) or minimum (min.) ONT read depth of 10 (e).
inheritance of full chromosome complements; nevertheless,
cen-tromeres still remain under-explored, especially in larger genomes.
Although the active centromere is incredibly diverse in size and
sequence among species, it is characterized through its cohesion
with the centromere-specific histone H3-like protein, CENH3, and
it has been suggested that association with CENH3 is controlled
through epigenetic means, including a decrease in CG
methyla-tion
48. Direct CG methylation profiling using the ONT data not only
suggested the efficacy of this approach (93–97% correlation with
WGBS) but also demarcated the active centromere in the
assem-bly, with hypomethylated regions being co-located with known and
new centromeric repeat sequences. At least three of the
chromo-somes for Ni100 (B1, B3 and B8) showed multiple hypomethylated
islands within or adjacent to the putative centromere region, which
also coincided with centromeric-specific repeats (Supplementary
Fig. 24). It was noted for B. rapa that such repeats found outside
the presumed centromeric region may represent evidence of ancient
palaeo-centromeres, remnants of WGD events
21. However, all
addi-tional sites coincided with hypomethylation, suggesting
function-ality of the regions. This could imply potential scaffolding errors
remaining in the dense repeat regions although, interestingly, even
though the data were more limiting the same pattern appeared to
be apparent for the
CN115125
genotype, which could suggest a
dispersed structure for the active centromeric region
8. Where
com-parison was feasible, the two genotypes showed a common
dichot-omy of centromeric regions, with conservation of gene content but
rapid divergence in sequence constitution driven by changes in
ret-rotransposon composition.
Recent work in B. nigra to uncover centromere-specific sequences
through their association with CENH3 indicated that, unlike its
diploid relatives and almost all analysed plant genomes, B. nigra
contains no tandemly repeated satellite DNA
6,37. Similarly, although
no characteristic tandem repeat was found in the LR assemblies,
analyses of assembled full-length LTRs revealed recently amplified
(< 1 Ma) elements, in particular ALE-LTRs in the Ni100-LR genome
(Fig.
5
). Notably all eight of the centromeric regions displayed a very
similar structure with a core region largely populated with ALE
ele-ments flanked by dense islands of the previously described pBN 35
short repetitive element (Supplementary Fig. 11 and Supplementary
Table 20). Interestingly a number of the retro-elements
encom-passed the pBN 35 sequence within their LTR domains, which
might suggest its capture during element activity. Rapid
amplifi-cation of young LTRs in a nested insertion fashion was observed
in all Ni100 centromeric regions (Supplementary Table 21), a
phe-nomenon that was not obvious for the available LR assembly of
B. rapa (Supplementary Table 26)
21. Nested TE insertion is a
preva-lent phenomenon among monocots, but has been identified only
infrequently among dicots
49. The detected recent nested insertion
events involving a single family suggest that ALE or related LTRs
might play an important role in the rapid divergence of centromeres
in B. nigra, similar to that found when comparing the centromeric
region of two rice genotypes
50. It was postulated that
retrotranspo-sons are actively recruited to the functional centromere; >90% of
the B. nigra sequences found to be associated with CENH3 showed
significant homology to ALE elements, providing circumstantial
evidence for the role of CENH3 in their accumulation at the
centro-mere core (Supplementary Table 27). Further studies are required to
fully establish the role of these elements in centromere function in
B. nigra and, indeed, the LR assembly resources developed for the
Ni100 genotype could be leveraged as a model for centromere
func-tion research in future.
Although an ancestral block structure was established for
Brassicas some years ago, it was largely defined manually and there
has been no clear resolution of the events separating genomes.
Syntenic relationships between species have been instrumental in
gene discovery and in dissecting genome evolution that can impact
technology transfer across species. The improved assemblies for
all three diploid Brassica genomes allowed an ancestral Brassica
aB5
34 Mb 39 Mb
Distribution of LTRs based on age
0 50 –5 0 5 10 –5 0 5 10 15 –100 –50 0 50 1000 100 LTR-Copia LTR-Gypsy LTR-unclassified LTR nested events 34 Mb 35 Mb 36 Mb 37 Mb 38 Mb 39 Mb 7 15K 9K 6 5 3 2 1 4 8 9 16K 11K 1.1 0.76 0.30 0.84 0.84 0.99 0.001 0.5 0.07 0.33 0.001 0.21 0.07 0.16 0.12 0.08 0.001 0.1 0 0.001 0.12 0.07 0.16 0.16 0.03 0.53 0 0.07 0 0.34 0 0.15 0.03 0.29 0 0 0 0.52 0 0.31 0 0.14 0 0.07 0 0.14 0 0.07 0.15 0.22 0 0.13 3K 0 0 6K 19 14 10 15 21 16 11 20 25 26 13 18 23 22 17 12 24 b 10 20 30 40 50 60 Nanopore methylome Age <1 Ma Age >1 Ma ALE-LTR Other LTRs WGBS ChIP–repeats seq Genes
Fig. 5 | Characterization of centromeric region of chromosome B5 of Ni100-LR genome. a, Distribution of various genomic features on the 5-Mb centromere region, including genes, methylome (ONT and WGBS) and full-length LTRs (ALE-LTR and 13 other family LTRs); distribution of young (<1 Ma) and old LTRs (>1 Ma); and distribution of centromeric repeat sequences of B. nigra based on chromatin immunoprecipitation (ChIP) analysis of CENH3 (ref. 38). b, Nested insertion of full-length LTRs in the centromeric region. Age (in Ma) is shown above each element.
genome (n = 9) to be resolved based on 178 syntenic blocks. The
calculated genomic distance between the genomes reflects the age
of divergence between the B and A/C genome lineages (Fig.
6a
).
While B. rapa and B. oleracea have chromosomes sharing extensive
homology with ancestral chromosomes, the extent of the
rearrange-ments separating the B genome would explain the limited genic
exchange that has been possible across the two lineages. Therefore,
capturing new diversity from the third Brassica genome for crop
improvement strategies in its related species may be more efficient
using next-generation breeding techniques such as clustered
regu-larly interspaced short palindromic repeat/Cas9. The defined block
relationships between the genomes also provide further avenues for
studying centromere evolution because, among the 27 centromeric
regions across the three species, 26 had adjacent or flanking
con-served blocks found across either two or three of the genomes,
sug-gesting evolutionary conserved positions (Supplementary Fig. 22;
compare A8, C8 and B7).
The ability to generate, relatively quickly and affordably,
contig-uous genome assemblies provides a platform for the development
of true pan-genomes for many species. Such assemblies will allow
an accurate comparison of not only gene content, but also repeat
composition and distribution, and reveal the range and complexity
of structural variation. There are still some limitations, and
assem-blies of neopolyploid genomes will need to be assessed to determine
whether the technology can routinely differentiate young WGD
events. However, with continuing improvements to the technology
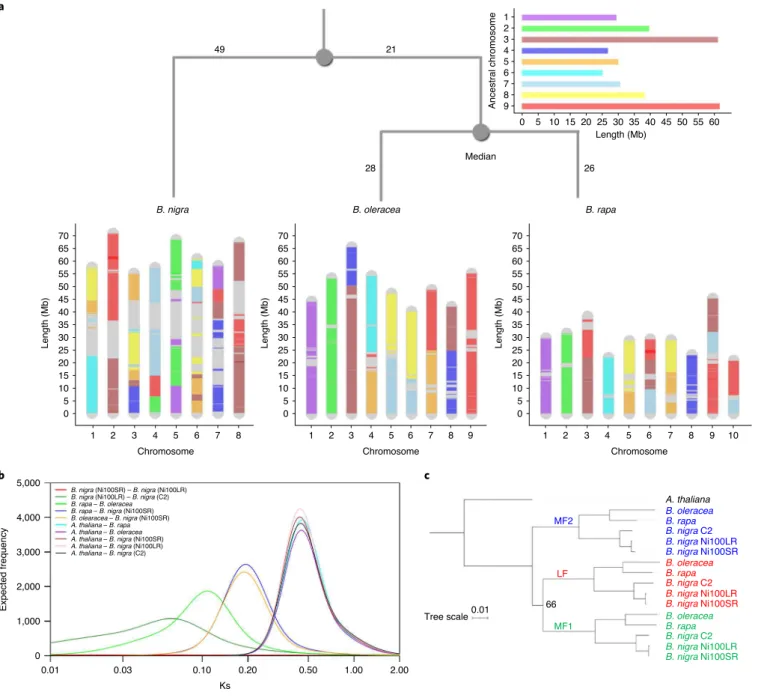
Length (Mb) 70 65 60 55 50 45 40 35 30 25 20 15 10 5 0 Length (Mb) 70 65 60 55 50 45 40 35 30 25 20 15 10 5 0 b a c A. thaliana MF2 B. oleracea B. rapa B. nigra C2 B. nigra Ni100LR B. nigra Ni100SR B. oleracea B. rapa B. nigra C2 B. nigra Ni100LR B. nigra Ni100SR B. oleracea B. rapa B. nigra C2 B. nigra Ni100LR B. nigra Ni100SR LF MF1 Tree scale0.01 66 5,000 4,000 3,000 2,000 1,000 0 0.01 0.03 0.10 0.20 Ks 0.50 1.00 2.00 49 21 28 26 Median
B. nigra B. oleracea B. rapa
1 2 3 4 5 6 7 8 9 0 5 10 15 20 25 30 35 Length (Mb) 40 45 50 55 60 Ancestral chromosome Chromosome 1 2 3 4 5 6 7 8 Chromosome 1 2 3 4 5 6 7 8 9 Chromosome 1 2 3 4 5 6 7 8 9 10 Expected frequency
B. nigra (Ni100SR) – B. nigra (Ni100LR) B. nigra (Ni100LR) – B. nigra (C2) B. rapa – B. oleracea B. rapa – B. nigra (Ni100SR) B. olearacea – B. nigra (Ni100SR) A. thaliana – B. rapa A. thaliana – B. oleracea A. thaliana – B. nigra (Ni100SR) A. thaliana – B. nigra (Ni100LR) A. thaliana – B. nigra (C2) Length (Mb) 70 65 60 55 50 45 40 35 30 25 20 15 10 5 0
Fig. 6 | Genome rearrangements and evolution of Brassica species. a, Development of B. rapa, B. nigra and B. oleracea genomes based on ancestral genome. Blocks are ‘painted’ with colours corresponding to ancestral chromosomes. b, Divergence time estimation based on Ks distributions. Gaussian mixture models fitted to frequency distributions of Ks values obtained by comparing pairs of syntelogs between different Brassica species or the subgenomes of each species are shown. c, Phylogenetic relationship between the subgenomes of different Brassica species. A maximum-likelihood tree constructed based on concatenated sequences of 1,150 syntelogs between A. thaliana and each of the subgenomes (LF, MF1 and MF2) of B. rapa, B. oleracea and B. nigra is presented. Clade support values near nodes represent bootstrap proportions in percentages. All unmarked nodes have absolute support.
and optimization of software dedicated to analyses of these new
data types, resolution of these problems should be swift.
Methods
Plant materials and DNA extraction. Brassica nigra CN115125 (C2) and Ni100 were grown in a greenhouse at Agriculture and Agri-Food Canada, Saskatoon Research and Development Centre, under 20/18 °C, 16/8-h days. Leaf tissue was collected from 3-week-old plants ater 2 d of dark treatment, lash-frozen and stored at −70 °C. Nuclear isolation was performed as described in ref. 51, and high-molecular-weight DNA was extracted using a modiied cetyltrimethylammonium bromide (CTAB) method52. Briely, approximately 20 g of leaf tissue was homogenized in 200 ml of ice-cold 1× Hanks’ bufered salt (HBS) solution (0.01 M Trizma base, 0.08 M KCL, 1 mM spermidine, 0.01 M EDTA, 0.5 M sucrose, 1 mM spermine plus 0.15% β-mercaptoethanol). Five millilitres of 1× HBS plus 20% Triton X-100 was added to the homogenate and mixed slowly with a magnetic stir bar for 1 h on ice, then iltered through two layers of cheesecloth and one layer of Miracloth. he nuclei were pelleted by centrifugation of homogenate at 1,800g for 20 min at 4 °C. he pellet was washed by resuspension in 1× HBS plus 0.5% Triton ×100 on ice and centrifuged three times at 1,800g for 20 min at 4 °C to purify the nuclei. he inal pelleted nuclei were resuspended in 10 ml of lysis bufer (100 mM TrisHCl, 100 mM NaCl, 50 mM EDTA, 2% CTAB) treated with proteinase K, followed by RNAase A (37 °C for 30 min), and high-molecular-weight DNA was extracted ater two cycles of phenol/chloroform clean-up and ethanol precipitation. DNA quality and quantity were measured using an Agilent Bioanalyzer and Qubit luorometer, respectively.
ONT sequencing and reads processing. The C2 genome was sequenced on a MinION while the Ni100 genome was sequenced on a GridION. For the C2 genome, 1D (SQK-LSK108) and 1D2 (SQK-LSK308) genomic DNA libraries were prepared following the nanopore protocol (https://community.nanoporetech. com/protocols). For size-selected DNA, 4 µg of DNA was sheared with a Covaris g-TUBE to obtain 10-kb fragments. Two micrograms of sheared and un-sheared DNA was used for library preparation for both the 1D and 1D2 methods. For the Ni100 genome, 1D (SQK-LSK109) and Rapid (SQK-RAD004) libraries were prepared for sequencing on GridION. MinION sequencing used MinKnow v.1.4.2 with albacore (v.1.1.2) live base calling, enabled with default parameters. ONT reads with read quality score ≥10 (q10) were filtered from the ONT fastq files (Supplementary Table 3). For the Ni100 genome, sequenced using GridION, MinKnow 2.0 and live base calling was completed with Guppy, and ONT reads with read quality score ≥7 (q7) were used for assembly. Nanostat53 was used to compute the sequencing statistics for each run with both raw and quality- filtered data.
Illumina sequencing. Genomic DNA extracted as above was used for whole-genome Illumina sequencing. For CN115125 (C2), 2 µg of DNA was fragmented using a Covaris sonicator to obtain 350-bp fragments, and a TruSeq DNA PCR-Free library was prepared following the manufacturer’s protocol (Illumina, Inc.). The normalized library was paired-end sequenced in 2 × 101 bp and 2 × 250 bp rapid-run mode on the HiSeq 2500 platform (Illumina, Inc.). In total, >82 Gb of SR sequences with ~137× physical coverage were generated for C2 (Supplementary Table 28). For Ni100, whole-genome shotgun Illumina paired-end (300–700 bp insert size) and Illumina and Roche/454 (Life Sciences) mate-pair libraries (3–45 kb insert size) were developed following the manufacturers’ protocols. In total 115 Gb (~192× physical coverage) were sequenced and used for whole-genome assembly by SOAPdenovo (v.1.05) following a previously documented approach18 (Table 1 and Supplementary Table 28).
Total RNA was extracted from bud, flower, leaf, seedling, root and silique tissue samples for Ni100, and from leaf and bud samples for C2, using the RNeasy plant mini kit (QIAGEN), including on-column DNase digestion (Supplementary Table 28). Total RNA integrity and quantity were assessed on a Bioanalyzer (Agilent). Illumina TruSeq RNA-sequencing (RNA-seq) libraries were prepared, and 125-bp, paired-end sequencing was performed using the Illumina HiSeq 2000 platform. A total of 11 and 39 Gb raw Illumina RNA-seq data were generated for C2 and Ni100, respectively (Supplementary Table 28). Reads were filtered for low quality (<q30), adaptor sequence, potential PCR duplicates and length (<55 bp) with Trimmomatic (v.0.32). RSEM54 (rsem-calculate-expression) was used to calculate expression, in transcripts per million.
Genome size estimation based on k-mer analysis. Jellyfish v.2.2.6 was used to estimate k-mer frequency distribution based on the subset (~35 Gb) of raw 2 × 250 PE Illumina reads with a k-mer length of 17. The output histogram was uploaded to findGSE to estimate genome size, heterozygosity and repeat fraction55. Analysis has shown that genome size is about 570 and 607.8 Mb for Ni100 and C2, respectively, and was used as a haploid genome size for the study (Supplementary Fig. 25).
Nanopore sequence assembly and polishing. Raw ONT fastq data were filtered for quality at q10 and q7 for C2 and Ni100, respectively, and the resulting reads
were error corrected using CANU 1.6 with default parameters . The C2 filtered data were assembled with three different assemblers (SMARTDenovo, wtdbg, Miniasm). Minimap2 was used to generate overlaps of corrected reads, with k = 24 and other default parameters (-csw5 -L100 -m0) followed by assembly using miniasm24,56. SMARTDenovo (https://github.com/ruanjue/smartdenovo) was used with k = 24 and recommended parameters. The wtdbg tool (https://github.com/ ruanjue/wtdbg) was used to assemble the reads, with k = 17, k = 24 and default parameters (-H -S 1.02 -e 3). The best assembly for the C2 genome (S4), based on contiguity and genome coverage, was selected for further analysis (Supplementary Table 1). Based on this preliminary analysis, the Ni100 genome were assembled using SMARTDenovo with k-mer 24 and default parameters. Both draft assemblies were polished using eight iterations of PILON25 with available Illumina reads. Contig scaffolding. Leaf tissue from C2 was provided to Dovetail genomics (Santa Cruz), who prepared and sequenced CHiCAGO and Hi-C libraries. The polished assemblies, CHiCAGO and Dovetail Hi-C library reads were used as input for scaffolding using Dovetail’s HiRise pipeline57. A modified SNAP read mapper uses CHiCAGO and Hi-C reads to align to the draft assembly, while HiRise produces a likelihood model for the genomic distance between read pairs, computing the optimum threshold to join contigs and identify putative misjoins.
A genetic map derived from genotyping-by-sequencing data of a back-cross population of 72 B. nigra lines, derived from the Ni100 × double-haploid line A1// Ni100, was used to anchor contigs from all assemblies to the pseudo-molecules. In total, 20,689, 19,666 and 21,034 loci were anchored to the genome assemblies of C2, Ni100-SR and Ni100-LR, respectively. The assembly was confirmed using genome-ordered graphical genotypes (GOGGs)58 based on transcriptome re-sequencing of lines from the Brassica juncea VHDH mapping population59 and genome re-sequencing of lines from the B. juncea YWDH population60. GOGGs also enabled the incorporation of four previously unanchored scaffolds into the chromosome assemblies. Sequences of restriction fragment length polymorphism clones used to generate the genetic map in ref. 61 were aligned to the assemblies to name and orient the pseudo-molecules accordingly, based on the internationally agreed standard (http://www.Brassica.info). A look-up table comparing chromosome (linkage group) names between the two published nomenclatures for the B genome is shown in Supplementary Table 6.
Assembly quality assessment. Quality of the assembly was estimated using single-copy orthologous gene analysis (BUSCO v.0.2)26 with Embryophyta OrthoDB v.9. The 1,440 genes were searched in the assembly using Augustus (v.3.2.1)62, NCBI’s BLAST (v.2.2.31+)63 and HMMER (v.3.1b2) by BUSCO. In addition, genome discrepancies were estimated using qualimap27 by mapping Illumina reads against the polished assembly. Bowtie-2 (ref. 64) with default parameters was used for mapping of Illumina reads against the assembly. Genome annotation. RNA-sequencing (39 Gb) data for Ni100 and C2 were aligned against their respective genome assemblies using STAR v.2.7 (maximum 3% mismatches over 95% read length), and subsequently assembled using the Trinity (v.2.8.4) genome-guided approach with default parameters. In total, 110,767 and 124,851 transcripts were assembled for Ni100 and C2, respectively. The assembled transcripts, along with protein sequences from A. thaliana, Arabidopsis lyrata, B. rapa and B. oleracea, were used as evidence for the MAKER-P annotation pipeline65. Snap and Augustus ab initio predictors were configured for use by MAKER-P in hint-based mode, using protein and transcript as input evidence. Approximately 6% of the predicted gene models were found to be misjoined based on A. thaliana gene structure and B. nigra transcript evidence, and were split into two or more alternate models. PASA (v.2.3.3) software66 was then used to further assemble Trinity output and to incorporate the transcript alignment evidence into MAKER gene annotation. In total, 59,877 and 67,030 coding genes were annotated for Ni100 and C2, respectively. Of the annotated genes, 48,621 (81.2%) of Ni100 and 54,586 (81.4%) of C2 gene models have expression values of transcripts per million (TPM) > 0. BLASTP revealed that 55,022 (92.0%) of Ni100 and 59,780 (89.2%) of C2 genes have significant hits (cut-off 10 × 10–5) against the Uniprot plant database.
The gene-naming convention proposed for B. rapa v.3 (ref. 21) was used with minor modifications: Bni (for B. nigra) followed by the chromosome number with leading zero, and the letter ‘g’ (for gene)—for example, B01g (for B genome chromosome 1). Six-digit gene numbers were assigned in steps of ten, with leading zeros from top to bottom of chromosomes. Following the gene number and separated by a period, to distinguish genome versions and between genotypes, ‘2N’ was assigned to Ni100 LR (genome version 2) and ‘1C2’ to C2 (genome version 1)—for example, BniB01g023500.2N. Low-confidence genes were defined as those models with neither transcriptome evidence support nor significant hits to the Uniprot plant database. Low-confidence genes were named similarly as described above but with the letter ‘p’ to distinguish them.
Repeat annotation. A de novo repeat library was developed using RepeatModeler (v.1.0.11; http://www.repeatmasker.org/RepeatModeler/), which uses two de novo repeat-finding programmes (RECON and RepeatScout) for identification of repeat families. After removal of potential false positives based on homology