HAL Id: hal-02793182
https://hal.inrae.fr/hal-02793182
Submitted on 5 Jun 2020HAL is a multi-disciplinary open access archive for the deposit and dissemination of sci-entific research documents, whether they are pub-lished or not. The documents may come from teaching and research institutions in France or abroad, or from public or private research centers.
L’archive ouverte pluridisciplinaire HAL, est destinée au dépôt et à la diffusion de documents scientifiques de niveau recherche, publiés ou non, émanant des établissements d’enseignement et de recherche français ou étrangers, des laboratoires publics ou privés.
Impact of the environment on the quality of the seeds of
Douglas-fir seed orchards
Monika Tunjic
To cite this version:
Monika Tunjic. Impact of the environment on the quality of the seeds of Douglas-fir seed orchards. Vegetal Biology. 2015. �hal-02793182�
Master thesis
Impact of the environment on the
quality of the seeds of Douglas-fir seed
orchards
Monika TUNJIC
February-June 2015
Office National des Forets (ONF), Institut National de la Recherche Agronomique (INRA) 2163 Avenue de la pomme de pin, Ardon
Mentors : BRIGITTE MUSCH, Conservatoire Génétique des Arbres Forestiers de l'ONF, Chargée de Recherches; CAROLINE TEYSSIER, Chargée de Recherches, INRA
Referees: JEAN-CHARLES BASTIEN, (Ingénieur de Recherches, Vice-Président Centre Val de Loire), INRA; SNJEZANA MIHALJEVIC, Senior Research Associate, Division of Molecular
Biology, Ruder Boskovic Institute
France/Croatia 2nd July 2015
UNIVERSITE D’ORLEANS
UNIVERSITE DE ZAGREB
MASTER SCIENCES ET
TECHNOLOGIES
BIOLOGIE-BIOCHIMIE
2
Contents
PART I ... 7
1. BIBLIOGRAPHIC STUDY ... 7
1.1. Douglas-fir (Pseudotsuga menziesii (Mirb.) Franco) ... 7
1.2. Seed orchards ... 8
1.3. Gene flow and pollen contamination ... 9
1.5. Genetic analysis in tree breeding ... 11
1.6. The objectives of this study ... 11
2.1. Genetic characterization of adult and progeny population... 12
2.2. Paternal assignment... 14
2.3. The effect of phenology ... 17
2.4. The impact of the environment ... 18
3. DISCUSSION AND CONCLUSION ... 19
3.2 Changes in diversity between population ... 20
3.3. Pollen contamination... 21
3.4. Parentage analysis ... 21
3.5. Effect of the local tree density on the gene flow ... 22
PART II ... 23
1.BIBLIOGRAPHIC STUDY ... 23
2. RESULTS ... 25
2.1. Optimization of the seed number ... 25
2.2. Protein quantity estimation in seeds and two seed tissues ... 25
2.3. Protein profiles of the seeds and its tissues ... 28
2.4. Antibody detection of the legumin-like seed proteins ... 30
2.5. Mass spectrometry analysis of several hypothesized seed storage proteins ... 30
3. DISCUSSION AND CONCLUSION ... 30
4. MATERIALS AND METHODS ... 31
PART I ... 31
4.1. Seed orchard composition ... 31
4.2. Phenology and flowering measurements ... 32
4.3. Sample material ... 32
3
PART II ... 34
4.1. Biological material ... 34
4.2. The extraction of total proteins ... 35
4.3. Bradford analysis ... 36
4.5. Statistical analysis ... 37
5. ABSTRACT ... 40
ACKNOWLEDGEMENTS ... 41
4
PRESENTATION OF THE COMPANY
National Forests Office (ONF) is a public establishment of the National Government of France charged with the management of national forests. It was established in 1966 and its headquarter is situated in Paris. Its nature is public, industrial and commercial, conducting its work in a framework of a multi-year contract of objectives and acting with the State. The main task is management of French public forests which cover the surface of nearly 10 million hectares of forests and woodland in Metropolitan France (1/3 French forests) and overseas departments. The main missions and activities are:
• ONF ensures 40% of timber market in France, ensuring renewal of public forests and proper maintenance of their stands;
• biodiversity preservation and increase, through its inclusion in current forest
management, but also because of the importance of Natura 2000 network in public forests and the extension of its biological reserves network;
• offers new types of forests, by adapting to the diverse public expectations and different contexts (suburban forests, tourist areas), while raising awareness servicing missions: forest renewal and biodiversity preservation;
• performs services for communities and private clients based on a decentralized territorial organization, work agencies, consulting firms and specialized skills networks
• provides public service missions for the prevention and management of natural risks and
the preservation of biodiversity;
• boosts the role of the forest and the "wood products" in the fight against climate change.
With the aim of ensuring sustainable forest management towards better quality and protection of the natural environment, the ONF's environmental policy is built around five themes:
• biodiversity as it is an essential factor of stability, resilience and ecosystem restoration,
and because its preservation in terms of habitats, species and genetic resources is a global issue; • water, for its role in public health and because it is an indispensable resource, and
supports rich and strategic environments for the proper functioning of ecological cycles; • ground because it is the basis of forest sustainability and productivity and because
5
• landscape, because the forest participates in our living environment, contributing to its
variety and is a place of healing and privileged activities of urban and rural areas;
• eco-responsibility, because the ONF must actively contribute to conserving natural
resources, participate in the fight against the greenhouse effect and improve the environment, with the involvement of all staff, through its policy of sustainable purchasing and commitment to achieve energy savings and reduce consumables and waste.
In 1997, ONF has begun with its international activities to enhance its expertise creating subsidiary ONFI (ONF International). It is present in Latin America (Brazil, Chile, Columbia) and Africa (Gabon, Cameroon). In Brazil, it was founded in 1999, in partnership with Peugeot and Pro Natura, with the main goal to protect Amazonian rainforests.
6
INTRODUCTION
Seed orchards constitute the link between tree breeding and plantation forestry (Webber, 1994). Although they are not the only way of transferring genetically improved traits to forests, they are the most widely used way. The frequency of desirable genes in the population is increased progressively through cycles of selection and crossing. That process involves sexual reproduction for progeny testing. Since the most forest tree species are established with seedlings, seeds have been established as a major output from genetic improvement programs (Sweet, 1994). Gene flow in the seed orchards provides an insight into prevailing population dynamics and it is one of the main factors determining the genetic architecture of populations. (Burczyk, 2004). Gene flow patterns and seed quality appear to be the main focuses of orchard improvement.
This Master Thesis was part of the QuaSeGraine project which is collaboration between Office National des Forets (ONF) and Institut National de la Recherche Agronomique (INRA). The brief description would be: quality estimation and selection of seeds of economically interesting softwood tree species (Douglas-fir, larch and maritime pine) depending on the
orchard structure and environmental factors. The main objectives of this study were to determine whether changes caused by environmental factors have a real commercially applicable effect on the quality of the Douglas-fir seed and to determine to what extent the gene flow patterns and orchard characteristics affect the genetic superiority of the seed orchard.
The ONF has a research and development and Innovation department whose one of the goals is to insure forest adaptation to climate changes. One of the levers as possible is the right choice of plant material.
7
PART I
1. BIBLIOGRAPHIC STUDY
1.1. Douglas-fir (Pseudotsuga menziesii (Mirb.) Franco)
Pseudotsuga menziesii (Mirb.) Franco, commonly known as Douglas-fir, is an
ecologically and economically important timber species. With the natural distribution range in North America and Canada, it became of enormous importance in European forestry in the second half of twentieth century. There are two varieties in the natural range: coastal variety (along the Pacific coast) P. menziesii, var. menziesii, and interior variety P. menziesii, var.
glauca. First specimen was planted in Scotland as an ornamental tree, and after World War II, it
became major reforestation species. It is popular mostly due to its use as a high-quality timber. From a forest point of view, Douglas-fir is important as a reforestation species because of its fast growth and strong resistance to diseases and insects (Paques, 2013).
The largest Douglas-fir seed producing plantations in Europe are in Germany (3,030 ha), France (421 ha), Italy (259 ha) and Belgium (256.3 ha). Ever since its plantations covered great surfaces in Europe, there was an expressed need for deeper understanding on ecology, genetics and forestry for this introduced species. Since the European environment differs from Douglas-fir natural stands, it was important to determine how to choose the right reproductive material for reforestation. Forest managers need highest seed quality for their pedo-climatic environment. Two possibilities are used for stand renewal: natural regeneration or plantation. In both cases, the best equilibrium between growth and wood quality is researched. The most of the old Douglas-fir stands in Europe are the result of the material of unknown origin. For most of them, no information from the geographical harvest stand, number of trees collected or genetic diversity level are available. So, the quality of the seedlings is uncertain and the natural regeneration quality could be worst for the adult stand (mortality, form default, early flushing…). To mitigate this uncertainty, breeders have selected the best phenotypes in several forests to create seed orchards which produce seeds better adapted to French conditions. Such breeding populations are managed to maintain higher levels of genetic variability for sustained long-term genetic response (Namkoog, 1988).
Moreover, climate change is expected to cause substantial changes in tree growth by altering growing season length, soil moisture availability, and other climate-related factors
8 important to plant life cycle (Davis and Shaw, 2001). To understand how the forest trees could be adapted to such changes would be very useful for forest managers.
1.2. Seed orchards
Tree breeding and plantation forestry are linked with the concept of producing genetically superior conifer seed which is established as the main objective of tree improvement programs. These programs are expected to provide genetically superior seed for reforestation programs and future harvest (Kess, 2015). The main objective of seed orchard can be met if the criteria for panmictic equilibrium are fulfilled: 1) completely random fertilization; 2) equal number of male gametes/clone for all clones; 3) equal number of female gametes for all clones; 4) lack of genetic barriers that may affect embryo viability; 5) lack of pollen contamination; 6) equal rate of self-fertility for all clones in the seed orchard (Alizoti, 2009).
As the environment of the most of the seed orchards cannot be fully controlled, not all of the aforementioned criteria can be met. However, substantial research has been dedicated to illustrate that seed orchards have never met panmictic population (El-Kassaby and Askew, 1998). Several factors often compromise estimates of seed orchards being perfect, closed populations. These factors are: fertility variation, reproductive phenology asynchrony and minimal isolation from undesirable gene flow (pollen contamination).
1.3. Gene flow and pollen contamination
The most tree breeding programs tend to increase the economic value of specific traits of interest while maintaining conservation of potentially advantageous genes. Gene flow, therefore, appears to be the main problem contrasted to the tendencies of the most tree breeding programs, It is the only external factor affecting seed crops' genetic quality with estimates ranging from nearly 0% (El-Kassaby, 1986) to 90% (Fast, 1986). Gene flow determines the genetic architecture of populations, along with mutation, drift and selection (Burczyk, 2004).
Gene flow has prominent roles in evolutionary biology and ecology. In conservation biology, it has a big influence on the effective population size of threatened species (Lande, 1988). From ecological point of view, it is one of the key factors determining composition of ecosystems and responses to disturbance (Conell and Slatyer, 1977). In addition to this, gene flow has gained substantial interest in applied fields like crop improvement and ecological risk assessment (Burczyk, 2004). The effects of pollen contamination on seed crops can be
9 deleterious (Bateman, 1947). Along with reduced mating success and pollen contamination from outside sources, these deleterious effects have an impact of realized gains in seed quality (DiGiovani and Kevan, 1991). Generally, it is assumed that pollen from outside orchards has a negative effect on progeny performance as reduced growth potential and (or) maladaptation (Stoehr, 2004). However, external source pollen can sometimes have a positive effect. For example, if a high elevation seed orchard is situated at a lower elevation, then the seedlings resulting from contaminant pollen can show faster growth (Stoehr, 2004).
Gene flow in terms of pollen contamination can vary significantly depending on the age of a seed orchard and on the spatial distance from external pollen sources. In a study conducted in 1983 by Smith and Adams, the authors concluded that the high level of contamination was not, indeed, surprising, because the orchard was of very young age (14 years from grafting). Furthermore, it was not isolated from natural stands of Douglas-fir. They predicted that as the orchard blocks matured and pollen production within blocks increased, pollen contamination would diminish. Methods of measuring and managing pollen contamination are very important to tree breeders (Webber and Painter, 1996). Self-fertilization and unequal contributions of parents to seed crops also reduce the genetic efficiency of seed orchards (Friedmann and Adams, 1985).
In order to determine the influence of pollen contamination on genetical variability of a seed orchard and its impact on the seed quality, indirect methods can be used. Simple sequence repeats have already been used to measure gene flow, pollen contamination and selfing rates, directly quantifying the proportion of seeds fathered by each seed orchard parent and testing for deviations from random mating with respect to distance between orchard trees (Stoehr and Newton, 2002; Slavov, 2004). The information provided by these studies can further be utilized in forest management practices to advise them about the tree numbers which must be harvested for the guarantee of high genetic diversity.
1.4. Reproductive phenology
Reproductive phenology is considered to be one of the main factors causing panmictic disequilibrium. Along with cone production levels, level of contamination from outside sources, orchard planting arrangements, the use of supplemental mass pollination (SMP), and water spray cooling treatment to delay reproductive bud opening, it represents biological factors and
10 management practices which affect the mating of seed orchard trees. The quality of produced seed depends on the mating system in the seed orchard (El-Kassaby, 1986). Another possibility is to select trees with the same phenology which allows them to interpollinate.
Regarding phenological stages, trees can be divided into three classes: early, intermediate and late phenological class. El-Kassaby and Ritland in their 1986’s study showed the importance which different phenological stages have on the final contamination and self-fertilization rates. It was concluded that the highest pollen contamination occurs in early phenological class. It is mostly due to the fact that the pollen of inside origin is outnumbered in concentration by the pollen coming from outside sources during early flushing. When SMP practice is applied, the level of outcrossing decreases and it reduces the extent of pollen contamination.
Variation in reproductive bud development and overlap between reproductive bud flush of individual trees can decrease seed yield affecting both the quality and quantity of the seeds and consequentially reduce the effective population size. Since tree phenology has an impact on seed quality, seed yields and the size of effective orchard population (El-Kassaby, 1983), it is important to determine how these phenological properties affect genetic variability of seed orchard population.
1.5. Genetic analysis in tree breeding
In order to determine pollen contamination rate and, accordingly, the seed quality depending on genetic diversity, several molecular methods have been used so far. At the very beginning, molecular markers such as isozymes or allozymes were utilized (Squillace and Long 1981; Friedmann and Adams 1985). Because isozymes show low effective numbers of alleles per locus, it is not possible to detect all the male contributors or to characterize unambiguously mating gene flow within orchards (Adams, 1992).
Highly variable, polymerase chain reaction (PCR) based genetic markers, such as simple sequence repeats (SSRs), can substantially increase the precision of pollen contamination
estimates by increasing detection probabilities (Dow and Ashley 1998; Gerber, 2000).
Simple sequence repeats (SSRs or microsatellites) are a class of molecular markers based on tandem repeats of short (2-6) DNA sequences (Litt and Lutty, 1989). The most abundant in Douglas-fir and several others conifer tree species are found to be AG, AC and ATG among di-, tri- and tetranucleotide SSRs (Amarasinghe, 2002). The high variability, reproducibilty, and codominant nature of SSR markers makes them very valuable tools for genotype identification,
11 parentage analysis, and genome mapping in Douglas-fir and other conifer tree species, especially because of their large and complex genomes (Slavov, 2004). These markers have already been used to measure pollen contamination and selfing rates, directly quantifying the proportion of seeds fathered by each seed orchard parent, and testing for deviations from random mating with respect to distance between orchard trees (Stoehr and Newton 2002; Chaix, 2003; Slavov, 2004).
1.6. The objectives of this study
Studying contemporary gene flow provides insights in current population genetics (Sork, 1999). Pollen dispersal patterns, gene flow between populations and differential reproductive success can influence the levels of inbreeding, effective population size and distribution of genetic diversity between and within populations (Burczyk, 2004). Although pollen contamination, resulting in gene flow, is generally considered undesirable, it can have some positive effects on seed orchards, as previously stated (Stoehr, 2004). However, pollen contamination along with variations in reproductive bud development and differential pollen shedding periods can affect the seed orchard seed quality and quantity by reducing the breeding population size and by lowering seed yield (El-Kassaby, 1983). It is, therefore necessary to determine the extent of pollen contamination in the seed orchard and to achieve synchrony in bud flushing and pollen shedding in order to achieve the high-quality and genetically improved seed.
The main objectives of the conducted study were:
1. Compare genetic diversity of progenies and parental population 2. Determine the relative paternal contribution of clones in seed orchard;
3. Determine the effect of the microenvironment of each clone on the paternal contribution rates;
4. Estimate the effect of potential fathers phenology on assortative mating.
2. RESULTS
2.1. Genetic characterization of adult and progeny population
For the genetic analysis of two populations, adult and progenies, 11 microsatellite markers were used.
12 Adult population
For the population of adults, which is represented by one ramet by clone, the number of alleles (Na) varied between 17 (PmOSU_4G2) and 41 (PmOSU_1F9), with an average value of 27.818 and standard error (SE) value of 2.381. The number of efficient alleles (Ne) varied between 6.162 (PmOSU_3G9) and 20.175 (PmOSU_1F9), with an average of 13.329 and SE value of 1.294.
Genetic diversity can be estimated through the parameter of expected heterozygosity which varied between 0.838 (PmOSU_3G9) and 0.950 (PmOSU_1F9), mean value of 0.916 and SE of 0.01. The value of expected heterozygosity is higher than the value of observed heterozygosity, for example for marker PmOSU_3F1 whose F-index value is 0,254 and it represents significant heterozygosity deficit. The statistically significant heterozygosity deficit was observed for all the markers, except for PmOSU_2G12, PmOSU_4A7 and PmOSU_2C2.
Progeny population
For this analysis, we used all 43 progenies. A higher number of different alleles was counted for progeny population, the lowest being 20 and the highest 44 with the mean value of 29.273 and SE value of 2.367 than for adult population. The number of efficient alleles was between 5,483 (PmOSU_3G9) and 13,434 (PmOSU_4A7), average value was 10,528 and SE 0,819. The expected heterozygosity was in the range between 0,818 (PmOSU_3G9) and 0,926 (PmOSU_1F9) with the average value of 0,897and SE of 0,010. F-index was between -0,012 (PmOSU_1F9) and 0,514 (PmOSU_3B2) with mean value of 0,212and SE of 0,058.
We also analyzed separately each progeny, changes could be observed in observed and expected heterozygosity. In that case, some of the populations do not show heterozygosity deficit.
Comparison between adult and progeny population
The genetic diversity of the progeny, as measured by observed heterozygosity and number of alleles per locus differed from adult population (Table 1). Mean Ho in adult and progeny is 0,708 ± 0,054 and 0,699 ± 0,056, respectively, indicating a slight reduction in genetic diversity. While mean diversity decreased, observed heterozygosity at several loci (PmOSU_2G12, PmOSU_3B2, PmOSU_2C3, PmOSU_4A7) increased in progeny population.
13 Expected heterozygosity at all loci is higher than observed heterozygosity, indicating deviation from random mating in both populations. Gain of alleles was observed at all loci expect PmOSU_2G12 and PmOSU_4A7 which indicated genes from outside of the seed orchard.
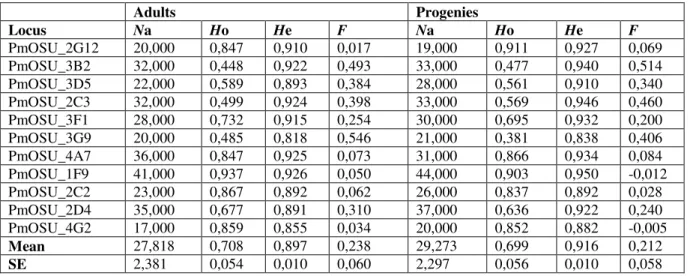
Table 1. Genetic diversity of adult and progeny populations, indicated by number of alleles, observed heterozygosity (Ho) and expected heterozygosity (He).
Adults Progenies Locus Na Ho He F Na Ho He F PmOSU_2G12 20,000 0,847 0,910 0,017 19,000 0,911 0,927 0,069 PmOSU_3B2 32,000 0,448 0,922 0,493 33,000 0,477 0,940 0,514 PmOSU_3D5 22,000 0,589 0,893 0,384 28,000 0,561 0,910 0,340 PmOSU_2C3 32,000 0,499 0,924 0,398 33,000 0,569 0,946 0,460 PmOSU_3F1 28,000 0,732 0,915 0,254 30,000 0,695 0,932 0,200 PmOSU_3G9 20,000 0,485 0,818 0,546 21,000 0,381 0,838 0,406 PmOSU_4A7 36,000 0,847 0,925 0,073 31,000 0,866 0,934 0,084 PmOSU_1F9 41,000 0,937 0,926 0,050 44,000 0,903 0,950 -0,012 PmOSU_2C2 23,000 0,867 0,892 0,062 26,000 0,837 0,892 0,028 PmOSU_2D4 35,000 0,677 0,891 0,310 37,000 0,636 0,922 0,240 PmOSU_4G2 17,000 0,859 0,855 0,034 20,000 0,852 0,882 -0,005 Mean 27,818 0,708 0,897 0,238 29,273 0,699 0,916 0,212 SE 2,381 0,054 0,010 0,060 2,297 0,056 0,010 0,058
The consanguinity coefficient is always positive in all loci for adult population while this is not the case for two loci in progeny population. The value of FST was 0.004 and ± 0.000 which indicated no difference between the populations.
The frequencies of observed null alleles per each locus are shown in Table 2.
Table 2. Null allele frequencies for progeny population. Ns-not significant; nd-non-defined; **p<0.01; ***p<0.001.
Locus Frequency P value
PmOSU_2G12 0,0142 Ns PmOSU_3B2 0,3659 Nd PmOSU_3D5 0,2804 Nd PmOSU_2C3 0,3093 Nd PmOSU_3F1 0,0806 *** PmOSU_3G9 0,2529 Nd PmOSU_4A7 0,028 *** PmOSU_1F9 0,0301 *** PmOSU_2C2 0,0152 Ns PmOSU_2D4 0,1103 *** PmOSU_4G2 0,0043 **
Null alleles were observed at all loci. The highest and lowest frequency was observed in PmOSU_3B2 and PmOSU_4G2 respectively. Except for PmOSU_2G12 and PmOSU_2C2, the P value was significant for all of them. These high null allele frequencies could have interfered with parentage analysis.
14
2.2. Paternal assignment
Allele frequency analysis and simulations of parentage assignment were conducted with Cervus 3.03 at the 11 loci used for this study. These loci show sufficient diversity for parentage analysis based on high average polymorphic information content (Botstein, 1980), low cumulative probability of incorrect parentage assignment, both interfered with allele frequency analysis and parentage assignment success in simulations of parentage assignment in Cervus 3.03.
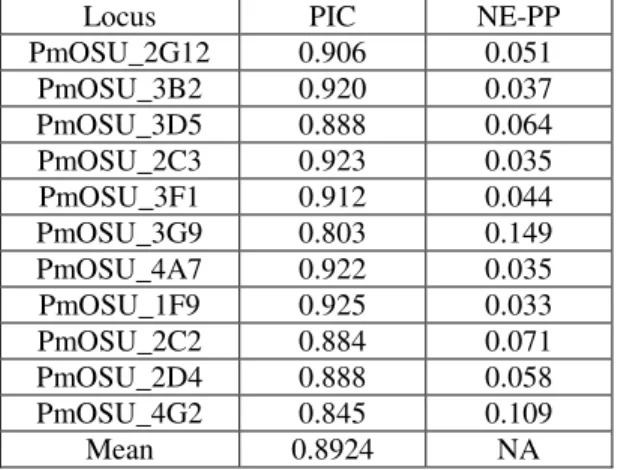
Polymorphic information content (PIC) was greater than 0.80 per loci with a mean PIC value of 0.8924 across loci. Non-exclusion probability for all parents was very low, the probability of erroneous parentage assignment for the 11 loci was 1.395 10-14 which indicated that genotyping of individuals with less loci allowed in this study was still sufficient for correct parentage assignment.
Table 3: PIC and parent pair non exclusion probability (NE-PP) of microsatellite loci used for parentage analysis
Accurate measure of parental reproductive success is a prerequisite for understanding true pollination dynamics in this seed orchard. Using CERVUS software, the pedigree reconstruction successfully assigned the paternal parent to the analyzed seedlings: 95 fathers out of possible 134 were assigned to 43 progenies. Pollen was contributed by 70% of clones, highlighting paternal reproductive success. However, we found 4 seeds with no seed orchard’s paternal donor which could be correlated with gain of alleles in progenies.
The number of different fathers in ramets of different clones varied between 5 and 24. Eleven progenies collected more than 20 different pollen donors whereas only four progenies were pollinated by less than 10 pollen donors. Furthermore, one pollen donor was present in 13 analyzed progenies and the least abundant fathers were present in only one clone. 27.9% of
Locus PIC NE-PP
PmOSU_2G12 0.906 0.051 PmOSU_3B2 0.920 0.037 PmOSU_3D5 0.888 0.064 PmOSU_2C3 0.923 0.035 PmOSU_3F1 0.912 0.044 PmOSU_3G9 0.803 0.149 PmOSU_4A7 0.922 0.035 PmOSU_1F9 0.925 0.033 PmOSU_2C2 0.884 0.071 PmOSU_2D4 0.888 0.058 PmOSU_4G2 0.845 0.109 Mean 0.8924 NA
15 clones showed selfing which represents 3% of all seeds. It is the early flushing clone 272 which has the largest rate of inbreeding.
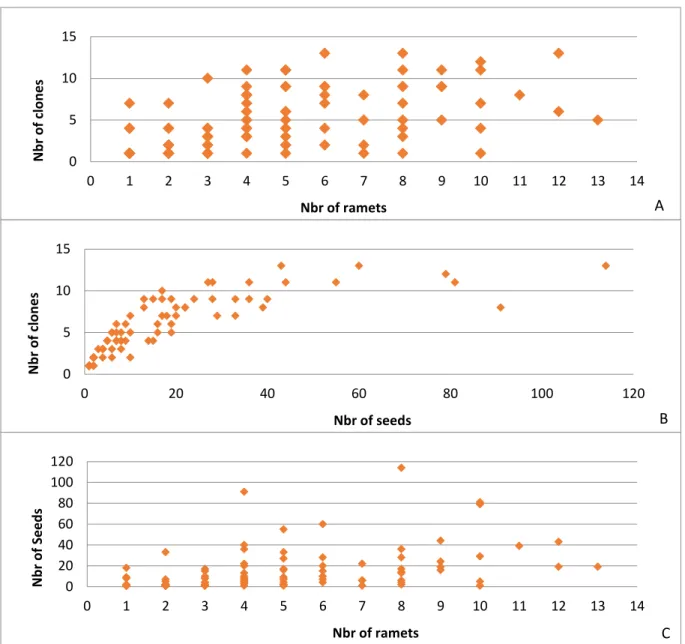
Figure 1. The figure shows how the parameters describing fathers in the seed orchard affect the genetic diversity of the progeny. A illustrates the effect of the paternal contribution on the genetic diversity of the progeny. B and C show that the fathers represented with higher number of ramets can fertilize more seeds originating from more different clones. For fathers represented by seven or nine ramets, the values of fertilized seeds and clones are below the observed general trend.
In assignment analysis, we determined its paternal contribution in each progeny, its abundance in the seed orchards (number of copy of each clone) and its overall seed abundance in the orchard. Figure 4 shows how these parameters affect gene flows in the seed orchard.
If the pollen donor has numerous copies in the seed orchard, it can pollinate more different clones (Fig 1A). These indices could be a good proxy for the diversity of pollen cloud
0 1 2 3 4 5 6 7 8 9 10 11 12 13 14 0 5 10 15 Nbr of ramets N b r o f c lo n e s A 0 20 40 60 80 100 120 0 5 10 15 Nbr of seeds N b r o f c lo n e s B 0 1 2 3 4 5 6 7 8 9 10 11 12 13 14 0 20 40 60 80 100 120 Nbr of ramets N b r o f See d s C
16 for tree breeders. The figure 1B shows that pollen donors which are good seed contributors can distribute their pollen more efficiently on different clones. Moreover, the higher number of copies of a certain clone means that this clone will be greater paternal contributor of the seeds (Fig 1C). The more abundant fathers will contribute more than less abundant individuals to the next generation. There are some deviations from the observed trend which might be the consequence of the spatial distribution of the paternal clone or of the phenology.
2.3. The effect of phenology
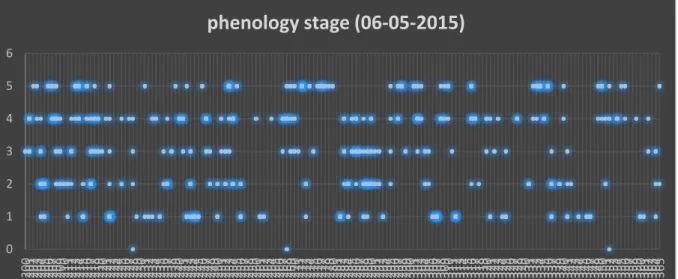
In order to determine the phenology stage effect on genetic diversity and paternal contribution to the progeny, the phenology stage was assigned to each individual in the seed orchard. The flushing patterns of analyzed trees might explain why some fathers are represented in high number of different clones while some are present in only one clone. We also expected that the most of the clones flushing in same time have higher chance of possible crossings. The clones which were represented by several copies show at least three different phenotypical stages. Only on the second date we have seen the diversity of phenological stages (Fig 2).
Figure 2. Phenology stage of all the trees in the seed orchard measured on 6h May 2015. The copies of each clone are represented with the blue points designated to certain flushing stage. The brightness and the diameter of the point are the measure of the number of copies with the same flushing state value.
Of all the analyzed fathers, only clone 272 is an early flusher (Fig 3). It has the greatest paternity contribution, clonal diversity of fertilized seeds and abundance in the seed orchard, which is not expected. But it could be explained by a fast flowering period.
0 1 2 3 4 5 6 200 201 202 203 204 205206 207 208 209 210 211 212 213 214 215 216 217 218 219 220 221 222 223 224 225 226 227 228 229 230 231 232 233 234 235 236 237 238 239 240 241 242 243 244 245 246 247 248 249 250 251 252 253 254 255 256 257 258 259 260 261 262 263 264 265 266 267 268 269 270 271 272 273 274 275 276 277 278 279 280 281 282 283 284 285 286 287 288 289 290 291 292 293 294 295 296 297 298 299 300 301 302 303 304 305 306 307 308 309 310 311 312 313 314 315 316 317 318 319 320 321 322 323 324 325 326 327 328 329 330 331 332 333 334 335 336 337 338 339 340 341 342 343 344 345 346 347 348 349 350 351 352 353 354 355 356 357 358 359 360 361 362 363 364 365
phenology stage (06-05-2015)
17
Figure 3. Phenology stage of all the trees in the seed orchard measured on 24th April 2015. Yellow circle highlights the clone 272 with the highest paternal contribution, greatest clonal diversity and the most abundant clone in the seed orchard.
2.4. The impact of the environment
Each clone should be surrounded by 8 other clones but due to mortality it was not always the case. We collected information on the local environment of each seed source clone. With the determined father clones in the orchard and the number of trees surrounding each maternal clone, we tried to determine the effect of the environment on the genetic diversity of progeny. From the results shown in Figure 4 it can be concluded that the progeny diversity increases proportionally to the number of its neighbouring trees. However, several individuals seem to fall out of the observed trend (encircled points in the Figure 4). Different values of their expected heterozygosity might be due to their placement in the seed orchard or phenology asynchrony.
0 1 2 3 4 5 6 200201 202 203 204 205 206 207 208 209 210 211 212 213 214 215 216 217 218 219 220 221 222 223 224 225 226 227 228 229 230 231 232 233 234 235 236 237 238 239 240 241 242 243 244 245 246 247 248 249 250 251 252 253 254 255 256 257 258 259 260 261 262 263 264 265 266 267 268 269 270 271 272 273 274 275 276 277 278 279 280 281 282 283 284 285 286 287 288 289 290 291 292 293 294 295 296 297 298 299 300 301 302 303 304 305 306 307 308 309 310 311 312 313 314 315 316 317 318 319 320 321 322 323 324 325 326 327 328 329 330 331 332 333 334 335 336 337 338 339 340 341 342 343 344 345 346 347 348 349 350 351 352 353 354 355 356 357 358 359 360 361 362 363 364 365 366 367 368 369 370 371 372 373 374
18
Figure 4. The figure shows the dependence of heterozygosity of an individual on the number of surrounding trees. Each spot represents an analyzed ramet of a particular clone in a seed orchard. The observed trend shows that more diverse environment will result in higher heterozygosity. The encircled spots represent the individuals whose deviations are the consequence of their placement in the seed orchard.
3. DISCUSSION AND CONCLUSION 3.1. The quality of genetic markers
The high variability of SSR markers that we used allowed us the precisely estimate gene flow. Compared to using isozyme markers, less effort is needed to verify genotypes and controlled crosses between selected parents. SSRs allow cheap and precise estimation of pollen and seed contamination in seedlots. They also facilitate the estimation of the success of seed orchard management techniques such as bloom delay and supplemental mass pollination. Finally, the high polymorphism of these markers can be used to directly determine the relative maternal and paternal contributions in open-pollinated seedlots from seed orchards.
However, in this study, the excess of homozygotes was observed for all the analyzed markers in progeny population. In adult population the excess was significant in 5 of the 11 utilized markers. The mean fixation indices F (FIS) were significantly different from Hardy– Weinberg expectation. This difference attests that a high frequency of null alleles and allelic dropout in the SSR loci were the major reasons for false homozygote genotyping that inflated fixation indices in our study (e.g., Pompanon, 2005). Allelic dropout and null alleles are the most prevalent source of genotyping error in general (Miller, 2002; Dufang, 2015). Null alleles, allelic dropout, and stutter bands have all been observed in other studies using microsatellite loci from this marker set (Krutovsky, 2009; Fussi, 2013). The existence of null alleles was previously mentioned by Slavov et al. (2004), but only for the PmOSU_3F1 marker and at higher rates. In order to reduce the possible genotyping errors, we obtained several laboratory practices. PCR
0 2 4 6 8 0.600 0.650 0.700 0.750 0.800 0.850 NUMBER OF TREES E X PE CTE D H E TE R OZYGOSI TY
19 controls were used to reduce the errors which might have been caused by reading allele size slippage. Also, we used the same concentrations of DNA to avoid preferential amplification of small alleles. However, possible genotyping errors cannot be completely avoided in this way. Slippage during amplification can cause microsatellite sizes which are different from their original size, with one repeat more or less (stuttering, Shinde, 2003).
Another possible way of explaining the excess of homozygotes is the Wahlund effect. Indeed, large populations could contain sub-populations. Then, there are fewer homozygotes than in the average for the set of subdivided populations. A consequence of the Wahlund effect is that when a number of previously subdivided populations merge together, the frequency of homozygotes decreases. This geographical structure affects allele frequencies over space and consequently the proportions of different genotypes in the local populations. The seed orchard’s clones were selected in different populations and could be considered as a set of subdivided population.
Consanguinity is another possible explanation of the high level of homozygotes. Available data from other conifers suggests that homozygote excess, due to selfing or consanguineous mating in seed orchards, present at the embryo stage had been removed after a few years of field growth (Neale, 1985; Yazdani, 1985; Gomory, 1992). Nevertheless, we cannot exclude this possibility because in our seed orchard some clones are originated from the same progenies and could be full-sibs. These clones are suspectible to inbreeding what could produce more related seeds than expected and decrease the level of heterozygosity.
3.2 Changes in diversity between population
Multiple processes cause changes in allele frequencies and observed genetic diversity between generations. In studied seed orchard, high pollen flow and relatively equal parental contributions acted to increase diversity, while high selfing rates and random sampling of alleles between generations acted to diminish some expected gain in diversity.
In our case, negative change in means of heterozygosity was observed in progenies. Gain and loss of alleles were also observed across loci, with a greater number of alleles being gained than lost. Gain of alleles across loci is expected as a result of pollen flow from outside-orchard sources, introducing novel alleles and genotypes. The observed loss of alleles could be due to
20 self-fertilization, decreased gametic contribution of adults carrying these alleles or sub-sampling of progeny seeds. Our results showed that not all the clones in the seed orchard participate in the orchard gene flow (39 ramets do not participate).
Nevertheless, the comparison of the two populations (adults and progenies) shows Fst equal to 0.004, which is really weak.
3.3. Pollen contamination
Only 4 seeds could not be assigned in our study what is very weak and in accordance with the previous study of this seed orchard. But this result is not consistent with pollen contamination levels reported earlier for seed orchards of Douglas-fir and other conifers (Adams and Burczyk, 2000; Pakkanen, 2000). The difference could be due to the substantial spatial isolation from other stands of the same species, and a very good pollen management techniques. Indeed, as shown in the figure 5A most of the clones could have fertilized each other. In our seed orchard there is a pollen saturation of all the clones by these clones, which did not allow fertilization with exogenous pollen.
3.4. Parentage analysis
Low selfing rates are typically detected in seed orchards of Douglas-fir and other conifers (Adams and Birkes, 1991; Stoehr, 1998; Stoehr and Newton, 2002). Our results agree with these findings. Although self-pollination can be as high as 50% in Douglas-fir, severe inbreeding depression during seed development reduces selfing at the developed seed stage to levels that do not appear to be a serious problem for the production of seed lots with high genetic quality (Sorensen, 1999). Thus, self-pollination has a greater negative impact on seed yields than on the genetic efficiency of Douglas-fir seed orchards. The clone which showed highest selfing rate is early flushing.
The abundance of paternal ramets affects the paternal contribution to the genetic diversity of the seed orchard. It plays important role in the clonal diversity of its progeny, but the male flowering has an impact, too. The similar impact of flowering on male mating success was previously detected by Erickson et al., 1998 and Burczyk et al., 1997. The individuals whose flowering is very early or very late have a significantly reduced mating success (Burczyk, 1997). It can be also stated that the father clones that are placed on the borders of the seed orchard or are isolated have a less chance of participating in the progeny.
21
3.5. Effect of the local tree density on the gene flow
When there are fewer nearby trees available as a pollen donor, the proportion of pollen from distant trees increases in the local pollen pool, and consequently the average realized pollination distance will be larger (Robledo-Arnuncio, 2004; Bacles and Ennos, 2008; Wang, 2010). Based on parentage assignment, Robledo-Arnuncio et al., (2004) demonstrated that the Euclidean distances between pollen donors and mother trees were strongly negatively correlated with the tree density of the forest stands. It has been shown before in Fraxinus excelsior, Q.
robur and Q. petraea that low conspecific tree density increased the average distance between mates (Robledo-Arnuncio, 2004; Bacles and Ennos, 2008; Wang, 2010). The most likely explanation for this observation is that pollen competition between distant and nearby trees decreases when there are fewer nearby trees available as a pollen donor, through which the average realized pollination distance will be greater. Furthermore, in more open landscapes, airborne pollen movement will be facilitated, as winds in open landscapes are typically stronger than winds in a canopy closed forest matrix (Nathan, 2002; Bacles, 2005).
The obtained results showed that the individuals which have a crowded surrounding have a greater chance of producing more genetically diverse progeny. If an individual tree in a seed orchard is surrounded by many other trees, there is a higher chance that the fertilizing pollen will originate from its closest neighbours. On the other hand, the pollen cloud which is produced by tree´s closest neighbours represents certain shield which prevents pollen from more distant trees to fertilize them. But, the trees that are in close proximity to them represent sufficiently high pool of genetic diversity so that their progeny can keep high levels of heterozygosity. Although tree isolation in orchard is reflected in their low genetic diversity and higher selfing-rate, our results showed that certain rate of spatial isolation (Annex 1) enables fertilization with more diverse pollen from all over the orchard. Because there is no pollen shield around, pollen from more distant ramets can reach those isolated individuals. However, if isolated individuals have low level of heterozygosity in their progeny, the main cause might be the flowering asynchrony with the most of the orchard.
Conclusion
Production of improved seed for reforestation relies on seed orchards functioning as closed, perfect populations, so genetic gain and diversity are packaged and delivered in terms of
22 improved seed and seedlings. Deviations in reproductive synchrony and equality within seed orchards will alter predicted genetic diversity and genetic gain. In this study, highly variable markers were used to assign paternity. They show few pollen contamination and male biased contribution to the seed’s progenies. The reason of this unbalanced contribution could be due to the number of clone’s copy or to the neighboring. Other studies with increased number of progenies or deeper analysis on flower synchrony and parental assignment must be conducted to get a more precise answer.
PART II
1.
BIBLIOGRAPHIC STUDYSince the seed quality and genetic variability determine the properties of orchard progeny, estimating the optimal seed harvest time is of great relevance. Highly important for seed harvesting is the climate and environment in which the trees are growing, for example elevation, latitude and the growth aspect (Portlock, 1996). Global warming is evidently and rapidly causing biological responses. It is just a matter of time when these changes are going to be noticeable (Aitken, 2008). These global climatic changes can negatively affect seed maturation process which can be devastating for orchard tree breeding. Adaptation to climatic alterations can be observed on molecular level. It is, therefore, intuitive to assume that better understanding of, for example, seed protein patterns can lead to better resolution of eventual environmental changes affecting seed maturation processes.
Conifer seeds consist of three main genetically different structural tissues: 1) seed coat (derived from maternal sporophytic integument); 2) megagametophyte (developed from haploid megaspore), and 3) diploid zygotic embryo (results from the fusion of a male gamete and an egg cell; Chatthai and Misra, 1998). Although progeny trees are under control of both paternal and maternal genotypes, development of embryos and young seedlings is predominantly affected by maternally derived megagametophytes that act as a nutritive tissue (Misra, 1994).
Two major energy and nutritive sources important for the seed germination and plant development are proteins and lipids. Seed storage proteins represent the major source of nitrogen for the germinating seed and developing plantlet so they tend to be rich in asparagine, glutamine,
23 and arginine or proline. The storage tissue of nitrogen-rich proteins is megagametophyte which begins to accumulate storage proteins after fertilization.
The most of the storage proteins can be divided in insoluble crystalloids and soluble matrix proteins and both are localized in megagametophyte and embryonic axis of maturing seed (Forward, 2000). Seed storage proteins can be classified as albumins, globulins, glutelins or prolamins, respectively (Higgins, 1984). Vicilin- and legumin-like proteins, two globulins, are considered to be the main storage proteins in conifers (Klimaszewska, 2004) and soluble proteins 2S albumine, vicilin- (also called 7S-vicilin-like) and legumin-like proteins (or 11S-legumin-like) comprise 10-30% of storage proteins. In most plants, these proteins are hexamers (legumin-like proteins) or trimers (vicilin-(legumin-like proteins) with subunit around 45-60 kDa, consisting of 2 peptides (between 27 and 38 kDa) linked by disulfide bridge. Albumin is a monomer of about 25-29 kDa peptide. Abscisic acid plays the crucial role in synthesis of storage proteins in early seed development (Silveira, 2008). In Douglas, the 2S albumin has been identified by its transcript which appears earlier in megagametophyte than in zygotic embryos (Chatthai, 1998). The legumin-like protein has been also identified in the seeds (Lait, 2001). Its maximal synthesis occurs between mid and late cotyledonary stages in Picea glauca (Misra, 1991). A study made in Douglas showed that the embryonic part of the seed contains less storage proteins and more housekeeping proteins and maturation and developmental regulators. Proteins in zygotic embryo start to accumulate evidently in the end of the morphogenetic phase, and at this point of seed development it contains energetic reserves originated from megagametophyte (Owens, 1993). As the embryo subsequently maturates, the quantity and complexity of megagametophyte-derived protein bodies increases (Owens, 1993). Since the germination starts in Douglas, the protein content changes both in megagametophyte and embryo axis as a consequence of proteinase activity (Forward, 2000).
Differential protein abundance analysis has established itself as a helpful tool for several purposes. For example, the differences between protein content of somatic and zygotic embryos in culture conditions have brought up several predictive protein markers for somatic embryo development and for the adaptive response of a culture to maturation conditions (Morel et al., 2014). Furthermore, the study of pathogenesis-related (PR) proteins in Douglas-fir-P.
Sulphurascens pathosystem, has shown that the expression profile of Douglas-fir seed proteins
24 With existing evidence of the environmental impact on the plant development, it can be assumed that climatic conditions and changes can affect the kinetics of protein accumulation of conifer seeds. Since protein content affects seed quality, environmental changes could project on the physiological processes of the plant, particularly seed maturation. The purpose of the protein studies in this research was to determine whether harvest time of the Douglas-fir seeds can be changed depending on the protein content of the seeds. The impact of the temperature treatment on the seed quality was investigated, too. This treatment is applied in commercial seed harvest process. It helps to release the seeds from the cone, and acts positively in the long-term conservation of the seeds. The results could highlight the objectives of future protein analysis and detection of potential protein markers for climatic and environmental changes.
2. RESULTS
2.1. Optimization of the seed number
In order to determine the optimal number of seeds for protein extraction, we did a pretesting with 3 groups of samples differing in the number of seeds. Each group had 5 repetitions and average quantity of µg of proteins per mg of fresh mass was determined using Bradford assay. Each extraction was done using the same volumes of two extraction buffers for each sample. The results are shown in Table 1.
Table 1. The results of extraction efficiency comparison between samples of 2, 3 and 4 seeds. The result is shown as the average quantity of isolated proteins per 1 seed.
NUMBER OF SEEDS PER SAMPLE QUANTITY (µg of proteins/seed)
2 174.2
3 105.0
4 88.7
Preliminary testing showed that far better extraction efficiency is observed when the extraction is performed with the samples of 2 seeds using the same volume of extraction buffer.
2.2. Protein quantity estimation in seeds and two seed tissues
The protein quantity was estimated for 6 harvest times (Table 2) of temperature-treated and non-treated zygotic embryos, megagametophytes and seeds.
25
Table 2. The dates of seed collection during 2014, and their designation in the graphs.
THE DATE OF SEED COLLECTION DESIGNATION IN THE GRAPH
21stJuly 201
10thAugust 222
1stSeptember 244
30thSeptember (kept from the 1st Oct at room temperature)
273RT
30thSeptember 273
10thJanuary 375
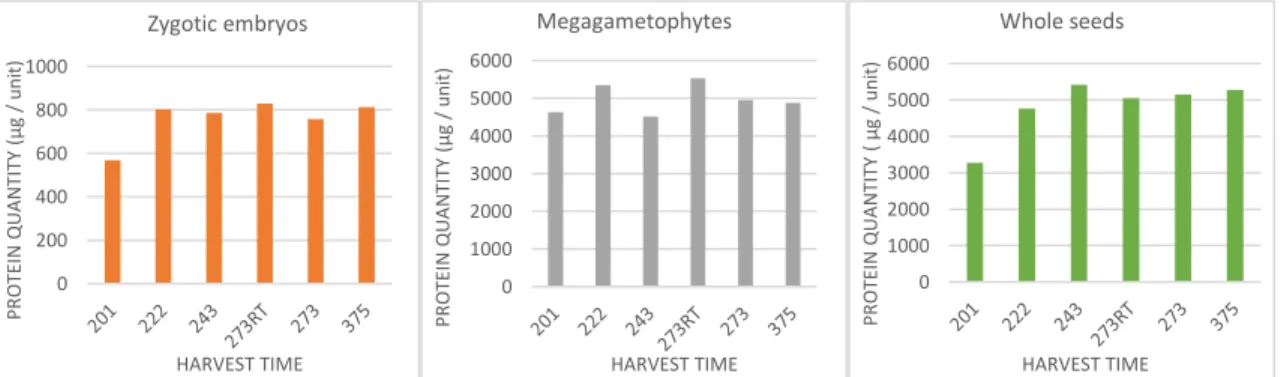
Figures 1 a and b show the estimation of protein concentrations for zygotic embryos of both genotypes. Although differences in protein concentration for two consecutive harvest times do exist, they are not statistically significant and there is no observed general tendency in difference of protein content.
The protein concentrations of megagametophytes in non-treated and treated samples of both genotypes do not show any general increasing or decreasing tendency (Figures 1 c and d). The differences between non-treated and treated samples in the same harvest time are not statistically significant in neither of genotypes.
Estimated seed protein concentrations are shown in Figures 1 e and f. After initial decrease, a constant increase in protein concentration can be observed for non-treated seeds of genotype x.
26
Figure 1. The figure represents the change of protein quantity per unit of zygotic embryo (a and b), megametophyte (c and d) and per seed (e and f) in each harvest time and for both gentoypes.
Altogether, the given results imply several generalities for all three analysed sample types: The temperature treatment of the seeds has no real effect on protein content. No significant change in protein quantity during maturation process except
between the first two dates.
0 0.2 0.4 0.6 0.8 1 PR O T E IN QU A N T IT Y ( m g / u n it ) HARVEST TIME
Zygotic embryos, genotype X
Non-treated embryos Treated embryos 0 0.2 0.4 0.6 0.8 1 PR O T E IN QU A N T IT Y ( m g / u n it ) HARVEST TIME
Zygotic embryos, genotype Y
Non-treated embryos Treated embryos 0 1 2 3 4 5 6 PR O T E IN QU A N T IT Y ( m g / u n it ) HARVEST TIME Megagametophytes, genotype X Non-treated megagametophytes Treated megagametophytes 0 1 2 3 4 5 6 7 PR O T E IN QU A N T IT Y ( m g / u n it ) HARVEST TIME Megagametophytes, genotype Y Non-treated megagametophytes Treated megagametophytes 0 1 2 3 4 5 6 PR O T E IN QU A N T IT Y ( µg / s ee d ) HARVEST TIME
Whole seeds, genotype X
Non-treated seeds Treated seeds 0 1 2 3 4 5 6 7 PR O T E IN QU A N T IT Y ( µg / s ee d ) HARVEST TIME
Whole seeds, genotype Y
Non-treated seeds Treated seeds
a b
c d
27 Graphs in Figure 2 represent the mean values for both genotypes and for both treated and non-treated samples. Figures 2 a and b highlight the difference in protein content of the first two harvest times of zygotic embryo and seeds.
Figure 2. The comparison of the average value of all conditions (average value for both genotypes and both temperature conditions) for all three sample types. Graphs highlight the difference in protein quantity between the harvest days 201 and 222 in zygotic embryos and seeds.
Statistical analysis of the protein content comparison between treated and non-treated samples of the same harvest time of one genotype did not give any significant results. Because of that, we did the statistical analysis with the samples regrouped in several different ways. Firstly, we analyzed only the differences between two consecutive harvest times of the same genotype, with neglecting the temperature treatment difference between samples. Significant differences were observed between the day 201 and 222 in the zygotic embryo of genotype x. In seeds, the differences were significant between the day 222 and 243 harvest time in genotype x and days 201 and 222 in genotype y. In the second regrouping, we analyzed the difference between the same harvest times of two different genotypes. Significant differences were observed for megagametophyte (P<2.03*10-6) and seeds (P<0.034), but not for zygotic embryo. Finally, we compared protein accumulation according to the harvest times without distinction of the genotypes to obtain more general behavior. Significant differences were then observed in zygotic embryos (P<3.5*10-4) and in seeds (P<2.235 *10-3).
2.3. Protein profiles of the seeds and its tissues
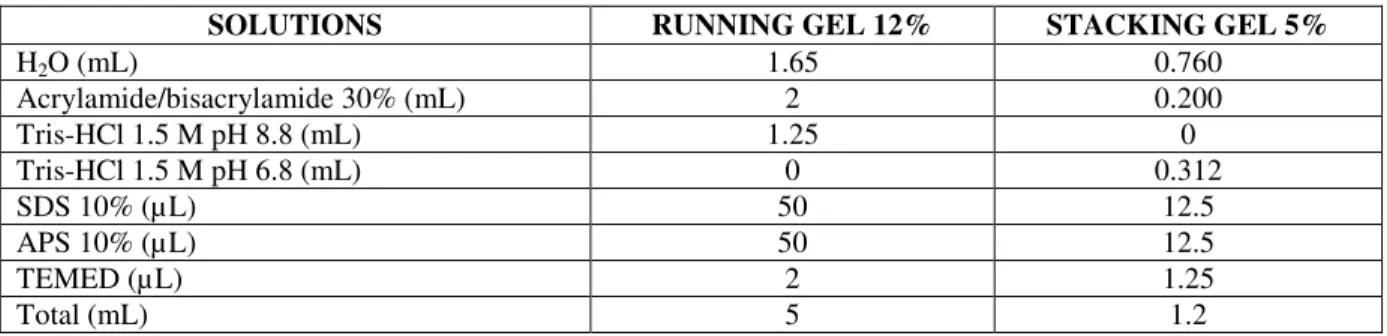
After isolation from the seeds and seed tissues, proteins were separated in denaturing conditions on SDS-PAGE gels. In both seed tissues, there are several hypothetical seed storage proteins which constitute the majority of the total protein content.
0 200 400 600 800 1000 PR O T E IN QU A N T IT Y ( µg / u n it ) HARVEST TIME Zygotic embryos 0 1000 2000 3000 4000 5000 6000 PR O T E IN QU A N T IT Y ( µg / u n it ) HARVEST TIME Megagametophytes 0 1000 2000 3000 4000 5000 6000 PR O T E IN QU A N T IT Y ( µg / u n it ) HARVEST TIME Whole seeds
28
Figure 3. Protein profiles of isolated seed proteins. A shows the protein profile of zygotic embryo for genotype y. Numbers 1-6, +/- T represent harvest times with or without temperature treatment. From A it is visible that the quantity of some proteins during the last phases of seed collection. Numbers 1-4 (left side of the gel) represent major protein bands. B represents protein profile of proteins isolated from megagametophyte of genotype x. Megametophyte proteins appear to be more abundant and their concentration is constant during all of the harvest times. The major proteins are represented with the bands numbered 1-5 (left side of the gel).
In zygotic embryos of both genotypes, one protein appears to comprise the majority of hypothetical storage proteins (Fig. 3A, lane 1), with three less abundant storage proteins (Fig. 3A, lanes 2, 3 and 4). The quantity of all four major proteins is decreasing from the first towards the last harvest time.
There are five major storage proteins present in megagametophyte tissue in each of the genotypes (Fig. 3B, lanes 1-5, genotype y not shown). Proteins in bands 1, 4 and 5 represent the three most abundant proteins. There is no change in protein content of megagametophyte between different harvest times. One of the proteins appears just in the second and remains until last harvest time (Fig 3B, arrow 1) and one of the proteins is present only during the second harvest time (Fig 3B, arrow 2). The overall protein content of megagametophyte is higher than the protein content of zygotic embryo.
According to the literature and the apparent molecular weight of the proteins in the major protein bands, we assume that they are members of the vicilin- and legumin-like group of proteins. To confirm this assumption, we excised these protein bands for the analysis by mass spectrometry.
29
2.4. Antibody detection of the legumin-like seed proteins
Because the primary antibody (Legumin (1.BB.78)) used for the detection of seed proteins was too diluted, we did not obtain positive results for legumin-like proteins of the seeds. The analysis should be repeated with higher concentration of primary antibody.
2.5. Mass spectrometry analysis of several hypothesized seed storage proteins
The whole set of numbered bands of the gels (Fig 3 A and B) have been submitted to mass spectrometry identification.
3. DISCUSSION AND CONCLUSION
Since there are no significant changes in protein quality and quantity between non-treated and treated seeds for both genotypes and all three analyzed sample types, it can be proposed that: The seed germination will not be affected if the seeds undergo temperature treatment (at least up to 40°C overnight). This additional treatment for facilitating the commercial seed harvest process can still be kept in use as it does not have an impact on the seeds;
The seed quality, regarding its protein composition, does not statistically change between the evaluated harvest times. Nevertheless, the first date seems to be too early for harvest and the seeds seem to still be immature.
However, in order to confirm these assumptions, it is necessary to conduct germination tests with temperature-treated and non-treated seeds collected in different harvest times. Statistically more significant results should be obtained by analyzing more unit repetitions of each tissue, especially between the first date and the others.
The overall protein content of both genotypes appears to be higher in megagametophyte than in zygotic embryo what is understandable since the megagametophyte is the major protein storage tissue.
However, in zygotic embryos, some qualitative and quantitative changes in protein content of particular hypothesized storage proteins can be observed from the electrophoretic results for both genotypes. The decrease of protein content towards the last harvest times might be the consequence of the higher susceptibility of zygotic embryo proteins to degradation by the beginning of the germination process.
30 The complete protein profile of megagametophyte tissue seems to appear in the second harvest time, with the appearance of high-weight protein (Fig. 3B, arrow 1). This result suggests that seeds can be collected even before commercial harvest time. But, before revealing this information to the seed industry, these results need to be further confirmed and it has to assured that they can be applied each year. It is, therefore, necessary to analyse the samples from another collection drive with contrasted temperatures.
Conclusion
To sum up, we can say that temperature treatment does not really affect the protein content of seeds, so this treatment which facilitates the seed harvest can be left in use. The whole protein set seems to appear three weeks before the current commercial seed harvest time, so this date can be potentially changed after some further investigations and confirmations.
ANNEXES
4. MATERIALS AND METHODS PART I
4.1. Seed orchard composition
The sample material was collected in an open-pollinated seed orchard France2, located in the south-western France in Lavencantière (Lot department). This seed orchard arose from the selection of the best, 10-years old, French massif central’s individuals in a progeny test which took place in Argein (near Saint Girons). The selection criteria included: the vigor (total height), the lateness of budburst and form (stem straightness, angle of open branch insertion, and absence of growth in August). The orchard is composed of 134 clones (534 tree individuals, 1-13 individuals per clone). This seed orchard was grafted in 1989 and 1990.
In 2011, all ramets of harvest area were partially girdled to stimulate heavy flowering the following year and to approximately equalize pollen production for all the ramets. That is important for obtaining a panmictic reproduction.
31
4.2. Phenology and flowering measurements
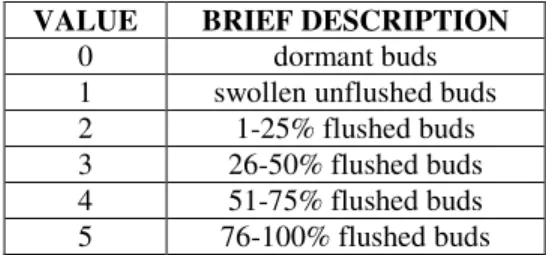
The flushing phenology and pollen abundance were measured for each ramet in the seed orchard. The flushing phenology state is a good approximation of flowering phenology. Early flushing trees are also early flowering trees. For phenology measurements, general BBCH scale was used (Hack et al., 1992). Notations were made in three times during 2015 spring (30th April, 6th May and 13th May). Each ramet of a certain clone was assigned a value 0-5 according to its bud abundance and state (Table 1).
Pollen abundance was measured in spring 2012 for all the ramets. The scale is 0% to 100%, 0 indicate no male flower on the ramet and 100% more than 3000 male flowers on the ramets. Phenological observations were made one time when all the flowers were whither.
Table 1. The main criteria for assigning a certain bud flushing value to each tree.
VALUE BRIEF DESCRIPTION
0 dormant buds
1 swollen unflushed buds
2 1-25% flushed buds 3 26-50% flushed buds 4 51-75% flushed buds 5 76-100% flushed buds 4.3. Sample material
The genotypes of all the clones present in the seed orchard were determined prior to offspring genetic analysis. Those results represented adult (maternal and paternal) genotypes. Based on the labels attached to each tree, we detected 4 mistakes: mislabeled ramets whose genotypes matched a different clone or graft rejection (Jacques, 2014). The data were corrected for this study.
In 2014’s spring, each progeny was sown separately in a greenhouse. We collected Douglas-fir needles from 50 individuals of 46 progenies. The plant material of each progeny was stored as separate sample at -80°C. In total, 2150 individuals from 43 progenies were analyzed.
4.4. DNA extraction and genetic analysis
DNA was extracted using NucleoSpin® 96 Plant II kit. The wet weight of sample material was approximately 100 mg per each sample. After DNA extraction, the quantity of DNA was spectrophotometrically measured using NanoDrop. The aliquots were conserved at -20°C until
32 further use. The genotypes of the 2150 individuals were determined using 11 microsatellite markers (Table 2) divided in 3 multiplex mixes (developed for CGAF laboratory for B.Le Guerroué). DNA was amplified according to the protocol (Annex 2) designed for Guichoux et al. (2011) using Mastercycler® thermo-cycler (Eppendorf). The quality and approximate quantity of amplified DNA fragments was determined by gel electrophoresis and ethidium-bromide staining. The DNA extractions and amplifications were done on the 96-well plates in order to facilitate reproducibility of the experiment and sequencing analysis. For the sequencing, 2 µL of PCR product were diluted with 7.7 µL of formamide (Life Technologies) and 0.3 µL GeneScanTM 600 LIZ® Size Standard (Life Technologies). The sequencing was done on a capillary of the automatic genetic analyzer ABI3500.
4.5. Data analysis
4.5.1. The product visualisation and genotyping
The microsatellites were determined by GeneMapper v4.1 and the microsatllite sizes were adjusted using macro Excel AUTOBIN (https://www6.bordeaux-aquitaine.inra.fr/biogeco_eng/Scientific-Production/Computer-software/Autobin).
The genetic analysis was done using Excel macro GeneAlEx 6.501. The analysis enabled the determination of the number of alleles (Na), the number of effective alleles (Ne), observed heterozygosity (Ho) and expected heterozygosity (He), Fis and FST value, as well as the disparity of Hardy-Weinberg equation.
4.5.2. Parentage analysis
The paternity analysis was performed for 43 progenies and their parents using CERVUS 3.03. The utilized parent assignation methods were proposed by Marshall et al. (1998) and are based on LOD score (log-likelihood score). LOD score is calculated by the following equation: LOD= T (g0/gm,ga) / T (g0/gm). T (g0/gm,ga) is the transition probability or Mendelian segregation, where g0, gm and ga are gentoypes of the offspring, known mother and alleged father, respectively. T (g0/gm,ga) is Mendelian segregation or transition probability, probability of the offspring's genotype given the genotypes of known mother (gm) and alleged father (ga), rather than arbitrary male. T (g0/gm) is the probability of offspring's genotype given the mother's genotype.
33 The most probable father was determined utilizing CERVUS 3.0.3. For each analyzed seedling, two most probable fathers were assigned the value Δ as criterion. Δ is the difference between LOD values of two most probable fathers. The Δ estimation was done in CERVUS 3.0.3 performing 10,000 simulations with defined parameters: standard error of 0.01,standard error of 0.01, all the seed orchard’s clones (i.e 134) as possible fathers and with the threshold value for the assignment certainty set at "strict" value of 95% and "loose" value of 80%. For the paternity assignment to potential individual, the Δ should have been above critical value. CERVUS analysis was used to estimate the genotyping error rate through detection of null alleles in parentage inference (Kalinowki et al. 2007).
4.5.3. Quantification of genotyping error
Genotyping error can arise from several sources: null alleles due to mutation in priming sites or poor DNA template quality, sutter bands caused by polymerase slippage, human mistake as allele miscalling and mutations generating new alleles. Genotyping error caused primarily by inconsistently amplifying (null and stutter) alleles has been encountered in many studies of pollen flow (Dow and Ashley 1996; Piotti, 2013) leading to observed mismatches between seeds and maternal parent trees. Null alleles, allelic dropout, and stutter bands have all been observed in other studies using microsatellite loci from this marker set (Krutovsky, 2009; Fussi et al. 2013). However, these microsatellites remain the most polymorphic marker set with the highest polymorphic information content available for Douglas-fir, and these markers can still be effective tools for population and progenies genetic analysis. The presence of null alleles was also suggested in allele frequency analysis. However, CERVUS quantifies null allele by identifying excess observed homozygosity which also arises from nonrandom mating or relatedness within a sampled population.
PART II
4.1. Biological material
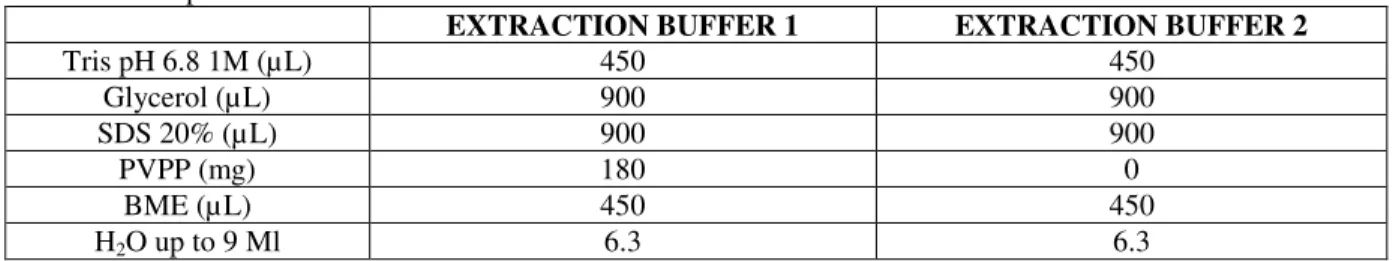
The plant material, Douglas-fir seeds, was collected in 5 different time periods (21st July 2014, 10th August 2014, 1st September 2014, 30th September 2014, 10th January 2015). After harvest, only those seeds considered full were collected for further analysis. Seeds were collected