RESEARCH OUTPUTS / RÉSULTATS DE RECHERCHE
Author(s) - Auteur(s) :
Publication date - Date de publication :
Permanent link - Permalien :
Rights / License - Licence de droit d’auteur :
Bibliothèque Universitaire Moretus Plantin
Institutional Repository - Research Portal
Dépôt Institutionnel - Portail de la Recherche
researchportal.unamur.be
University of Namur
Private health investments under competing risks
Rossi, Pauline; Villar, Paola
Published in:
Journal of Health Economics
DOI:
10.1016/j.jhealeco.2020.102330
Publication date:
2020
Document Version
Publisher's PDF, also known as Version of record
Link to publication
Citation for pulished version (HARVARD):
Rossi, P & Villar, P 2020, 'Private health investments under competing risks: Evidence from malaria control in
Senegal', Journal of Health Economics, vol. 73, 102330. https://doi.org/10.1016/j.jhealeco.2020.102330
General rights
Copyright and moral rights for the publications made accessible in the public portal are retained by the authors and/or other copyright owners and it is a condition of accessing publications that users recognise and abide by the legal requirements associated with these rights. • Users may download and print one copy of any publication from the public portal for the purpose of private study or research. • You may not further distribute the material or use it for any profit-making activity or commercial gain
• You may freely distribute the URL identifying the publication in the public portal ?
Take down policy
If you believe that this document breaches copyright please contact us providing details, and we will remove access to the work immediately and investigate your claim.
Private
health
investments
under
competing
risks:
Evidence
from
malaria
control
in
Senegal
Pauline
Rossi
a,∗,
Paola
Villar
b,1aUniversityofAmsterdam,officeE6.21,Roeterstraat11,1018WBAmsterdam,Netherlands bUniversityofNamur(UNamur),CRED,office633,RempartsdelaVierge8,5000Namur,Belgium
a
r
t
i
c
l
e
i
n
f
o
Articlehistory: Received12July2019
Receivedinrevisedform9April2020 Accepted22April2020
Availableonline27April2020 JELclassification: D1 H51 I1 J13 O15 Keywords: Healthexpenses Malaria Africa Humancapital Competingrisks
a
b
s
t
r
a
c
t
Thisstudyexploitstheintroductionofhighsubsidiesforanti-malariaproductsinSenegal in2009toinvestigatewhethermalariapreventsparentsfrominvestinginchildhealth.A simplemodelofhealthinvestmentsundercompetingmortalityriskspredictsthatprivate expensestofightmalariaandotherdiseasesshouldincreaseinresponsetoanti-malaria publicinterventions.Wetestandvalidatethispredictionusingoriginalpaneldatafroma householdexpendituresurveycombinedwithgeographicalinformationonmalaria preva-lence.Wefindthathealthexpendituresinmalariousregionscatchupwithnon-malarious regions.Thesameresultholdsforparentalhealth-seekingbehavioragainstotherdiseases likediarrhea.Thesepatternscannotbeexplainedbydifferentialtrendsbetweenregions. Ourresultssuggestthatbehavioralresponsestoanti-malariacampaignsmagnifytheir impactonall-causemortalityforchildren.
©2020TheAuthors.PublishedbyElsevierB.V.ThisisanopenaccessarticleundertheCC BYlicense(http://creativecommons.org/licenses/by/4.0/).
∗ Correspondingauthor.
E-mailaddresses:p.rossi@uva.nl(P.Rossi),paola.villar@unamur.be
(P.Villar).
1 Theauthorsaregratefultotwoanonymousreferees,ManishaShah, LaurentGobillon,SylvieLambert,PascalineDupas,EricaFieldandAdriana Lleras-Muneyfortheircarefulreadingofthepaperandtheir numer-oussuggestions,andtoKennethHoungbedji,RozennHotte,andKarine Marazyanfortheirinvaluablehelpwithdatamatching.Thepaperwas inspiredbydiscussionswithDenisCogneauandPascalineDupas.The authorswouldliketothankWilliamDow,RachidLaajaj,KarenMacours, PaolaManzini,HesselOosterbeek,YaoPan,ErikPlug,andLiam Wren-Lewisforhelpfulcomments,aswellasparticipantsofseminarsatPSE, UvA,Lille,UNamur,UNU-Wider,LavalandWageningen,andseveral con-ferences:CSAE,JMA, LAGV,DIAL,AFSE,EEA,Oxdev,ESPE,EALE,and NEUDC.PaulineRossigratefullyacknowledgesfinancialsupportfromthe NetherlandsOrganisationforScientificResearch(NWO)throughthe indi-vidualstartinggrantVeni451-17-012.
1. Introduction
Malariahaslongbeentheleadingcauseofchilddeathin Sub-SaharanAfrica,andisexpensivetotreatanddifficult toprevent.Inthiscontext,doesmalariadepressparental investmentinchildhealth?Toanswerthisquestion,we exploitrecentinterventionsthathavemadeanti-malaria productssuddenlyaffordabletomosthouseholds.
Atthebeginningofthe21stcentury,therewasaseries of initiatives coordinated by the international commu-nityundertheRollBackMalariapartnershiptogalvanize thefightagainstmalariainAfrica.Verylarge-scale inter-ventions were implemented to distribute anti-malaria products for free or at highly subsidized prices. On thepreventiveside, 900millioninsecticide-treatednets (henceforth ITNs)have been distributed since theearly 2000s. Nowadays, an estimated two-thirds of children
https://doi.org/10.1016/j.jhealeco.2020.102330
0167-6296/©2020TheAuthors.PublishedbyElsevierB.V.ThisisanopenaccessarticleundertheCCBYlicense(http://creativecommons.org/licenses/by/
sleepunderanITNcomparedtovirtuallynonebeforethe distributionstarted.2 Onthecurativeside,freeaccessto treatmentscalled artemisinin-based combination thera-pies(henceforthACT)hasbeenpromoted.Thescopeofthis interventionismoremodestwithanestimated16%of chil-drentreatedin2015,butthecoverageisincreasingrapidly. Overthepast15years,malariaprevalenceandmortality havebeenhalved(WorldHealthOrganization,2015).
Inthispaper,weexaminehowhealth-seekingbehavior haschangedinresponsetotheseinterventions.Weargue that,beforeRollBackMalaria,poorhouseholdshadfew incentivestoinvestinchildhealthbecausefightingamajor causeofdeathwasunaffordable.Substantiallydecreasing theprice of preventiveand curativeanti-malaria treat-mentsmadeitprofitabletoinvestinhealth,notonlyto avoidmalariabutalsoothercausesofdeath. Dowetal. (1999)werethefirsttoclaimthatsubsidizingtreatments againstonediseasemightboosthouseholds’expensesto preventotherdiseases,becausepeopleallocateeffortsto equalizelifetimesfromallcausesofdeath.Weadapttheir frameworktoshowthatcomplementaritiesalsoariseina stochasticsettingattheextensivemargin.Ourmodel pre-dictsthathouseholdsshouldstartspendingonchildhealth inresponsetoanti-malariapublicinterventions.
Totestthisprediction,weexploitoriginalpaneldata froma Senegalesehousehold survey providing detailed informationonhealthexpenses.Malariacontroleffortsin Senegaltookoffbetweenthetwowavesofthepanel(2006 and2011),providingaperfectsettingtoanalyze house-holds’responses.Ourempiricalstrategyistocomparethe evolutionofchildhealthexpendituresbetweenmalarious andnon-malariousregionsofSenegal.Wefindthatchild health expenditures were initially lower and increased more, principallyat theextensive margin,in malarious regions.Thecatch-upwasnotonlyinlevelsbutalsoin com-position,withparentsspendingmoreonpreventativecare. Tripledifferencesexploitingintra-householdcomparisons andvariationinintensityofcampaignsacrosshealth dis-trictssupporttheideathatanti-malariacampaignscaused thechangein spending behavior: thecatch-up(i) does nothappenfor healthspending onadults,who areless atrisk;and(ii)isstrongerin districtswheremore bed-netsweredistributed.Finally,weexploitDemographicand HealthSurveysconductedroughlyatthesametime(2005 and2010)toshowthathealth-seekingbehavioragainst otherdiseases,likediarrhea,increasedmoreinmalarious regions.
Ourresultscouldpotentiallybedrivenbydifferential pre-trendsorchangesinotherdeterminantsof expendi-tures.Weprovideevidencethatthisisnotthecase.When weaccountfortotalincome,distancetohealthfacilities, otherlarge-scalepublichealthcampaigns,rainfallpatterns andregion-specificlineartrends,ourestimatesareeven largerandmoresignificant.Last,ourresultsare qualita-tivelyunchangedonceweaccountforselectivemigration, attrition,changesinfamilystructure,andusealternative
2 Anotherpreventiveinterventionistohavepublicagentsspraythe insideofdwellingswithaninsecticide(indoorresidualspraying, hence-forthIRS),butitcoverslessthan5%ofthepopulationatriskinAfrica.
definitionsofhighprevalence.Wefinallydiscussthe rel-ativerolesofthesubsidycomponentandtheinformation componentofanti-malariainterventions.
Broadly speaking, ourpaper fits in the literatureon privateinvestmentsinhumancapitalindeveloping coun-tries. We examine how health investmentsrespond to changes in a specific mortality risk, while most exist-ingstudieslookateducationalinvestments.Forinstance,
JayachandranandLleras-Muney(2009)showthat
reduc-tions in maternal mortality risk lead to an increase in girls’educationalattainmentinSriLanka.Similarresults havebeenestablishedbytheHIVliterature.Areaswiththe largestincreaseinHIVprevalenceexperiencethelargest declineinschoolinginSub-SaharanAfrica(Fortson,2011). Thisislatermitigatedbyaccesstotherapies,whichreduces perceivedmortalityrisksand promptsparents tospend moreonchildeducation(BaranovandKohler,2018;Lucas et al.,2019).Asforhealth outcomes,Oster(2012)finds that reductions in risky sexual behavior in response to theHIVepidemicinAfricaarelargerinareaswithlower non-HIVmortality.Arelatedstrandoftheliteratureis pri-marilyinterestedinwhetherparentsreinforceorattenuate differences in endowmentsacrosschildren. These stud-ies usepublicinterventionsas anexogenous change in endowmentsandtypicallyfindthatparentalinvestments arehigherforchildrenwhobenefitfromtheintervention (AlmondandMazumder,2013).Ofparticularinterestfor us arethearticlesby AdhvaryuandNyshadham (2014)
andRavindran(2018).Thefirstoneshowsthat children
arebreastfedlongerandvaccinatedmoreoftenifthey pre-viouslyreceivediodineinTanzania;andthesecondone arguesthatparentalinvestmentsreinforcetheimpactofan early-childhooddevelopmentprograminIndia.Ourfocus is different: we aim toexplain why complementarities arise, rather thanexploring theconsequences for intra-householdallocations.
Specifically,wearethefirsttousedataonprivatehealth expenditurestovalidateamodelwithcomplementarities betweendisease-specificinvestments.Intheirpaper,Dow
et al.(1999)provideempiricalsupportbyshowingthat
birthoutcomesimproveafterchildvaccinationcampaigns in Sub-Saharan Africa. The evidence is only suggestive, becausewe do not know what additionalinterventions wereembeddedinthecampaigns,andtheymighthave directlyinfluenced maternalhealth. Weargue thatdata onhealthoutcomesisnotenoughandthatdataonhealth expensesisnecessarytoimplementaproper,directtestof themodel.Providingempiricalsupportforsuchamodel isusefultoexplainwhypoorpeopleininsalubrious envi-ronmentsinvestlittleintheirchildren’shealth.Treatments toavoidagivendiseasemightbeaffordable,butoncewe recognizethattherearemanydiseases,thetotalcostof fightingagainstallofthemmaybeprohibitive.
Anothercontributionistoprovideevidenceof behav-ioralresponsestohealthsubsidiesinAfrica.Whetherthese responsesundermineormagnifytheintendedimpactof programsisalong-lastingdiscussion.Alargeliteraturein economicsstudieswhetherpublicinterventionscrowdout privateinvestments.In thecase ofhealthinpoor coun-tries, the debateis not over. On theone hand,Bennett (2012)arguesthatthepublicprovisionofhealthproducts
therelationshipbetweenaprivate(ITN)andapublic(IRS) investment to fightmalaria in Eritrea. In line withour results,theyfindthathouseholdsweremorelikelytobuy a bednet when public health agents had sprayed their owndwellingswithinsecticide.Inourcontext,weargue thatbehavioralresponsesmagnifytheimpactofRollBack Malariabecausethereisacomplementaritybetween pub-licandprivatehealthexpenditures.
Our paper has strong implications for health poli-cies in Africa. It is often arguedthat horizontal (health system-wide)interventionsshouldbepreferredover verti-cal(disease-specific)interventions,becausetargetingone diseasemayleadtonegativespillovereffectsinthehealth systembydrawingresourcesawayfromotherconditions. Ourresultssuggestthat,inthecaseofanti-malaria cam-paigns, spilloverscanalsobepositive:peoplereallocate theirresources tofight otherdiseases. This mechanism helps explain “one of the surprising results to emerge from large-scale trials of insecticide treated bednets – that the reduction in all-cause mortality with the use ofbednets isconsiderablygreaterthanthereduction in malaria-attributedmortality”(SachsandMalaney,2002, p.684).
The paperisorganized asfollows.Section2 reviews existingevidenceonmalariacontrolandchildhealth. Sec-tion 3 presents a simple model of health investments. Section4 describesthedataand Section5explainsour empiricalstrategy.Section6providesthemainempirical results.Sections7and8dealwithalternativeexplanations androbustnesschecks.Section9discussesthepriceand informationchannelsandconcludes.
2. MalariacontrolandchildhealthinSub-Saharan Africa
Since2000,theevolutionofmalariainAfricahasbeen closelymonitoredbymedicalstudies.3Thegeneral consen-susisthatRollBackMalariasubstantiallycontributedto reducingmalariaprevalenceandmortalityacrossthe con-tinent(Bhattetal.,2015).InSenegal,threearticlesprovide evidenceofacausalrelationshipbetweenmalariacontrol interventions and progress in child health using differ-ent,complementarymethods:across-sectionalmatching model(Limetal.,2011),alongitudinalstudyofa surveil-lancesite(Trapeetal.,2014)andaplausibilityframework designed by the American Journal of Tropical Medicine
3SeereviewsbyWorldHealthOrganization(2015),Kestemanetal.
(2017)andAppendixAformoredetails.
DemographicandHealthSurveysconductedin19African countries,weestimatethetrendsinchildmortalitybefore andafterthestartofRollBackMalaria,forregionswithlow andhighinitialmalariaprevalence,distinguishingbetween richandpoorhouseholds.Beforetheintervention,overthe period1995–2001,childmortalitywasdecreasingforboth richandpoorhouseholdsinregionswithlowinitial preva-lence.Whereasinregionswithhighinitialprevalence,only therichhouseholdsdisplayadecreasingtrend;therewas noprogress forpoorhouseholds.Aftertheintervention, mortalityalsostartedtodeclinealsoforpoorhouseholds inhighlymalariousregions;theyaretheonlyoneswho exhibitasignificantbreakintrends.
Thedifferent pre-trendscannot beexplained by dif-ferenthealthinterventionsbetweenregionsbecauserich householdsinmalariousregionswereabletoprogressas muchasrichhouseholdsinnon-malariousregions.They cannot be explained either by a poverty trap, because innon-malarious regions poorhouseholdswere ableto progress as much as rich households. There seems to be some obstacles specific to being poor and living in malariousenvironments.Theexplanationweputforward in this paper is that malaria makes health investments unprofitableforpoorhouseholdsandpreventsthemfrom benefitingfromimprovementsinothercausesofdeath.For richerhouseholds,anti-malariaproductswereaffordable priorto2002,makinghealthexpensesonotherdiseases worthwhile.4
3. Conceptualframework
The main insight from the theoretical literature on healthinvestmentsdecisionsisthatcompetingmortality risksgeneratecomplementaritiesbetweendisease-specific investments.Inaseminalpaper,Dowetal.(1999)argue thattheproductionfunctionofoveralllifetimeunder com-peting risks is Leontief. In a deterministic setting, this impliesthattheoptimalallocationofinvestments equal-izesthetimesofdeathacrossallcauses.Therefore,apublic subsidyrelatedtoaspecificdiseaseraisesprivate incen-tivesto fightall causesof deaths. Chang(2005)further introducesuncertaintyaboutlifetimesin themodeland specifies the conditions under which a disease-specific
4 Analternativeexplanationwouldbethatmalariadepressesadult healththatis,eithermaternalhealthorthebreadwinner’shealth.This wouldlimitpoorhouseholds’abilitytocareandpayfortheirchildren’s health.However,theadulthealthchannelfailstoaccountforthepatterns intotalexpendituresthatwedocumentinSection7.
Table1
Stylizedfact:trendsinchildmortality.
Highprevalence Highprevalence Lowprevalence Lowprevalence
Poor Rich Poor Rich
LineartrendbeforeRollBackMalaria −0.0014 −0.0038*** −0.0054*** −0.0044***
(0.0015) (0.0013) (0.0007) (0.0010)
LineartrendafterRollBackMalaria −0.0053*** −0.0042*** −0.0057*** −0.0043***
(0.0007) (0.0005) (0.0005) (0.0005)
Observations 134,806 196,943 296,879 317,598
pValueBefore=After 0.033 0.765 0.698 0.950
DHSin:Benin,BurkinaFaso,Cameroon,DRC,Ethiopia,Ghana,Guinea,Kenya,Liberia,Malawi,Mali,Namibia,Nigeria,Rwanda,Senegal,SierraLeone, Uganda,Zambia,Zimbabwe.
Thetablepresentsestimatesofthelineartrendinchildmortalitybefore(1995–2001)andafterthestart(2002–2011)ofanti-malariacampaignsfor differentpopulations:therichesthalfandpooresthalfofhouseholds(accordingtodurablegoodsownership)inregionswithhighandlowinitialmalaria prevalence(≥50%or<50%ofchildrenaged2to10areinfectedbytheparasite).
Wekeptonlychildrenbornatmost10yearsbeforethesurveytoperformtheestimation. Thelastlinereportsthep-valueofatestofequalitybetweenlineartrendsbeforeandafter2002. S.e.in().*p≤0.1,**p≤0.05,***p≤0.01.
reductionin priceis predictedtoincreaseother invest-ments.
Thesemodelsonlydiscussinteriorsolutions,whereas cornersolutionsplayacrucialroleinourcontext.Indeed, themajorityofparents do notspend anythingonchild health.InourSenegalesebaselinedata,lessthan40%report havingsomechildhealthexpendituresduringthe previ-ousyear, and seekingsome medical care when a child issick.Childhealthexpendituresaccountfor3%oftotal expenditures.5InAppendixA.2,weproposeasimplemodel explaininghow competing mortalityrisksinfluence the extensivemargini.e.,thedecisiontoinvestornotinchild health.Themainideaisthattheexpectedbenefitof pre-ventingonecauseofdeathdependsontheoverallsurvival function,whichisitselfaproductofcause-specificsurvival functions.Thisgeneratescomplementaritiesbecausesome healthinvestmentsareonlyworthitwhenthemortality riskfromcompetingcauseshasbeensufficientlyreduced. Iftheriskofdyingfromonediseaseishigh,andlittlecan bedonebecausetreatmentsareunaffordable,thismakes otherinvestmentsunprofitable.
Ourmodelpredictsthatprivatehealthexpensesshould increase in response to Roll Back Malaria. Before the intervention,malariawasamajorcauseofdeath.The dis-easeaccounted for 17% of deaths among children aged underfiveinSub-Saharan Africain 2000(WorldHealth Organization,2015).Ifweexcludeneonataldeaths, result-ingprimarilyfromprematurity,birthasphyxiaandbirth trauma,roughlyonedeathinfourwascausedbymalaria.6 Anti-malaria products were very expensive, represent-ingbetween 20%and 40% of total out-of-pocket health expenditures (Mugisha et al., 2002; Onwujekwe et al., 2000).In acompeting riskframework, this impliesthat those households thatcould not affordto fightmalaria alsogaveuponsomeotherhealthinvestments.RollBack
5 Togivesomeperspective,out-of-pockethealthexpenditures– includ-ingadulthealth–representabout8–10%oftotalhouseholdexpenditures inruralKenyaandurbanIndia(Dupas,2011).
6 Othermajorcauseswereupper andlowerrespiratoryinfections (influenza,diphtheria,pneumonia,bronchiolitis,earinfections),diarrheal diseases,andmeasles,accountingtogetherforonehalfofpost-neonatal deaths.
Malariaradicallychangedthesituationbyreducingthecost of preventingandcuringthedisease.Onceanti-malaria treatments becameaffordable,otherhealthinvestments became worthit. Sothedramatic decreasein theprice ofanti-malariaproductsispredictedtoincreasenotonly investmentsagainstmalariabutalsoinvestmentsagainst other diseases.7 Besidesthechange in prices,Roll Back Malariamayalsohavechangedbeliefsaboutthemortality riskofmalaria.Thediseaseisclearlyperceivedbyparents asthemain threattotheirchildren –e.g.,Ndiaye etal.
(1994) inSenegal, Tarimoetal. (2000)in Tanzania and
DeressaandAli(2009)inEthiopia.Informationcampaigns arelikelytomaketheriskofdyingfrommalariaevenmore salientandtoincreaseconfidenceintreatments(Armand etal.,2017).Inourframework,thiswouldaccentuatethe cross-diseaseeffect.Inthelastsectionofthisarticlewe dis-cusstherelativecontributionofpricesandinformationin explainingthechangesweobserve.
Empirically,asdescribedinthenextsection,weobserve total expenditures on child health and health-seeking behavior against otherdiseases. To formalize, denoteq treatments(curativeandpreventative)boughtby house-holdsatpricep,andQtreatmentsprovidedforfree;malaria is subscriptedby mand other diseases by o. We have data on (pm.qm+po.qo) and Pr((qo+Qo)>0), whereas
ourtheoreticalpredictionsareforqmandqo.Changesin
totalexpenditurescapturebothchangesinquantitiesand changesinprices.Changesinhealth-seekingbehaviorare drivenbychangesinbothcostlyandfreetreatments.To singleoutthevariationinprivateinvestments,wecombine threepredictions:
P1Totalexpendituresonchildhealthshouldincrease. P2The proportion of households with no child health
expendituresshoulddecrease.
P3Health-seekingbehavioragainstotherdiseasesshould increase.
7Notethatastandardmodelofinvestmentinhumancapital,without complementarities,wouldfailtoexplainwhysomeparentsstartspending onotherdiseaseswhenthepriceofadisease-specifictreatmentdecreases.
wheremalariacontrolendeavorsstartedin2009.We com-binethreedatasetsprovidinginformationbeforeandafter 2009.
4.1. Paneldataonhouseholdexpendituresonchild health
OurmaindatasetisthePovertyandFamilyStructure8 (PauvretéetStructureFamiliale,PSFbyitsFrenchacronym) panelofindividuals.ThePSFdatasetisauniquepanelof individuals,withthefirstwavein2006–2007andthe sec-ondone in2011(DeVreyeretal., 2008).Thefirst wave (PSF1)isrepresentativeofthenationalpopulationandwas conductedon1800households.Allindividualsfromthis sampleweretrackeddownduringthesecondwave(PSF2) andinterviewedalongwithallthemembersofthe house-holdtheywerefoundtobelongtoatthatpoint.Thenumber ofhouseholdsplitsissizeableandthesecondwavecovers about3200households.
Oneoriginalfeatureofthisdatasetisthathouseholds weredividedintosub-unitsaccordingtotheirbudgetary arrangements.Thesurveyprovidesinformationon non-healthexpendituresmadeduringthelast12monthsatthe sub-unitlevel.Thisisparticularlyrelevantwhenthe house-holdheadliveswithhisbrother(s)orhasmultiplewives.In thatcase,eachmotherandherdependentchildren9form onesub-unit,sincethemotherisusuallythemaincaregiver andresponsibleforherchildrenneedsandwell-being.In therestofthepaper,weusetotheterm“household”to refertothesub-unit.Importantlyforourpurpose,the sur-veyregistersinformationonprivatehealthexpenditures paid during thelast 12 monthsbefore theinterview.10 Roughlytwo-thirdsofhealthexpendituresaredevotedto medicationpurchase,followedbyconsultation, hospital-ization,andcommutingtohealthfacilities.Theseexpenses arerecordedattheindividuallevelsowehavetwo poten-tialunitsofobservation:eitherthechildorthesibship(all dependentchildrenofthesamemother).Inthechild-level analysis,wehave moreobservations andwe followthe
8MomarSyllaandMatarGueyeoftheAgenceNationaledela Statis-tiqueetdelaDémographieofSenegal(ANSD),andPhilippeDeVreyer (UniversityofParis-DauphineandIRD-DIAL),SylvieLambert(ParisSchool ofEconomics-INRA)andAblaSafir(nowwiththeWorldBank)designed thesurvey.ThedatacollectionwasconductedbytheANSD.
9Adependentchildisachildunder18oranunmarriedchildliving withthemother.Inbothwaves,about17%ofchildrendonotliveinthe samehouseholdastheirmother.
10Only1%oftheseexpendituresarereimbursedbyhealthinsurance schemes.
robustnesstestspresentedinSection8.
The first column of Table2 shows somedescriptive characteristics.Oursampleofinterestismadeupby1594 householdsthatweobserveinbothwaves.Inaddition,789 householdsareonlyobservedinthesecondwave:these mothersdidnothaveanydependentchildreninthefirst wave.Inaddition,573householdsareonlyobservedinthe firstwave:368mothersnolongerhadadependentchild inthesecondwave,and205motherscouldnotbefound. ImplicationsofthisattritionarediscussedinSection8.The mainadvantage ofPSF isto providea panelsowe can estimateregressionswithmotherfixedeffects.Themain disadvantageofthisdatasetisthatonlyexpensesare reg-istered,andnothealth-seekingbehaviorbrokendownby disease.11
4.2. Repeatedcross-sectionsonchildhealthstatus
Togetinformationbydisease,weexploitthe Demo-graphicandHealthSurveys(DHShereafter)conductedin Senegalin2005and2010–2011.Theymeasuretrendsin childmorbidityandhealth-seekingbehavior.DHSreport casesofchildrenagedfiveandundersufferingfrom diar-rhea,fever,andcoughing.Parentswereaskediftheysought treatmentwhenthechildwassick.DHSalsocollectsdata on vaccination but we do not consider vaccines as an outcome of interest for two reasons. First, they reflect changesinpublicratherthanprivatehealthinvestment. AspartoftheExpandedProgramonImmunization, chil-drenarevaccinatedforfreeinpublichealthcarefacilities orduringoutreachactivitieslikemobilevaccinationteams orannualnationalvaccinationcampaigns.Second, cover-agewasalreadyhighin2005:dependingonthevaccine, betweenthreequartersand90%ofchildrenhadbeen vac-cinated(NdiayeandAyad,2006).Themaindrawbackis thatthesurveyisarepeatedcross-section,sochangesover timemaycapturebothchangesinbehaviorandchangesin population.
4.3. Geographicaldataonmalariaprevalence
Ouridentificationstrategyexploitsthespatialvariation intheinitialexposuretomalaria.WeusetheMalariaAtlas, amapconstructedbyepidemiologists,togetameasure oftheprevalencebeforeanti-malariainterventions(Bhatt
11 PSFcontainsquestionsaboutthehealthstatusofchildrenand health-seekingbehavior,butunfortunatelytheyarenotcomparablebetweenthe twowavesofthepanel.
Table2
Summarystatistics.
Fullsample Highprevalence Lowprevalence pval(diff)
(1) (2) (3) (4)
Baselinecharacteristicsin2006/2007(PSF1)
Malariaprevalencein2000 0.20 0.37 0.09 0.00
HouseholdinDakarregion 0.30 0.00 0.48 0.00
Householdinotherurbanarea 0.20 0.17 0.22 0.00
Householdinruralarea 0.50 0.83 0.30 0.00
Householdtotalconsumption(thousandsofCFAfrancs) 310.06 185.40 384.33 0.00
Mother’sage 34.99 34.50 35.28 0.11
Panelcharacteristics
NumberofchildreninPSF1 2.60 2.70 2.55 0.02
NumberofchildreninPSF2 2.67 2.74 2.62 0.07
AverageageofchildreninPSF1 7.45 7.42 7.47 0.80
AverageageofchildreninPSF2 7.55 7.22 7.75 0.01
Motherinsamemalariaprevalenceclusterbtw2waves* 0.93 0.93 0.93 0.94
#ofclusters 150 48 102
#ofhouseholdsinPSF1 2167 809 1358
#ofhouseholdsinPSF2 2383 908 1475
#ofhouseholdsinbothwaves 1594 616 978
Data:PSFPanel.PSF1isthefirstwavein2006–2007;PSF2isthesecondwavein2011.
*Computedonlyformothersfoundinbothwaves.Wedefineahouseholdasanuclearfamilycomposedofamotherandherdependentchildren. Thelastcolumnshowsthep-valueofthedifferencebetweenhighandlowprevalenceareas.
1euro≈656CFAfrancs.
etal.,2015).Wechose2000asouryearofreferencebecause ofmeasurementissuesinlateryears.12BothPSFandDHS containGPSinformationaboutthevillageorcityblock(that wecall“cluster”)wheretherespondentlives,makingit possibletomergethemwiththeMalariaAtlas.
5. Empiricalstrategy
Ourmodelpredictshowprivateinvestmentsinchild healthshouldrespondtoanti-malariacampaignsinregions wheremalariaisendemic.Thefirstsourceofvariationthat weexploitistemporal,comparinghouseholdexpenditures onchildhealthbeforeandafterthecampaign.However, expenditures may change over time for many reasons unrelatedtotheinterventionof interest.Toaccountfor thetime-varyingdeterminantsofexpenditures,weexploit anothersourceofvariation,comparingmalariousand non-malariousregionsofSenegal.Undertheassumptionthat trendsinthesedeterminantsarethesameinallregions, ourdifference-in-differencesstrategyidentifiesresponses toanti-malariacampaigns.
In 2008, the Programme National de Lutte contre le Paludisme (PNLP; National Malaria Control Program) initiatedafour-year-planofmassiveanti-malaria interven-tions.ThePNLP actionswerecoordinatedtoachievethe goalsof theRollBackMalaria partnershipand involved nearly all national and international partners engaged
12 Fortheyear2000,estimatesofprevalencearebasedonamapof cli-maticsuitabilityformalariatransmission.Forlateryears,estimatesare derivedfromanepidemiologicalmodelcombininginformationoninitial conditionsaswellascoverageandimpactofanti-malariainterventions. Thismodelreliesonstrongassumptionsintermsofexternalvalidity, lin-earityandexogeneity,thatwearenotwillingtomake.Therefore,we prefertousetheestimatesbasedoninitialclimaticconditionsonly.As arobustnesstest,weconsiderestimatesofprevalencein2006andfind comparableresults(cf.TablesA.1andA.2intheappendix).
with malaria preventionand control in thecountry. As shown by Fig. 1, the funds allocated to fight the dis-ease jumped in 2009, once USAID joined the team of donors. The US aid agency coordinates the President’s MalariaInitiative,whichstartedinAngola,Tanzania,and Uganda,andwasgraduallyextendedtootherAfrican coun-tries. Senegal was partof thesecond wave, along with Malawi,Mozambique, and Rwanda.We therefore argue thatlarge-scaleinterventionsweretheresultofan exoge-nouspushbyforeignaiddonors.Beforehand,intheperiod 2002–2008,onlyverytargetedandsmalldistributionsof bednetsandothermalaria-relatedgoodsandservicestook place(President’sMalariaInitiative,2008).Thefirst nation-wideITNsdistributioncampaigntookplaceinJune2009 and targeted specifically children under five and preg-nantwomen.Morethan6millionITNsweredistributed between2008and2010throughoutthecountry,andno specific areawassingled out (PlanNational, 2015). For pregnantwomenandmothersofunder-fivechildren,ITNs couldbeobtainedeitherforfreeorataverysubsidized price:maximumof1euro,insteadofthe10–12euros mar-ketprice(President’sMalaria Initiative,2008).Themain coverage scheme involved a door-to-door approach to deliver a voucher for anITN tobe redeemedlater at a distributionpoint.Thecampaignalsocommunicatedthe importanceofusingITNs.Asaresult,theITNcoverage mea-suredintheDHS-MICSdoubledfrom20%in2006to40% in2010.Moreover,in2010curativetreatments(ACT)were madefreeforallagesinpublichealthfacilities.Tosumup, in2009–2010,thepriceofpreventiveandcurative treat-mentsagainstmalariadecreasedsubstantiallytobecome virtuallyzero.
Beforeanti-malariacampaignsstarted,therewas con-siderablevariationinmalariaprevalenceacrossregionsof Senegal.ThemapinFig.2representstheproportionof chil-dreninfectedbytheparasitein2000.Theproportionranges frombelow2%inthearidregionofLougatoabove60%in
Fig.1.Temporalvariation:Fundsallocatedtoanti-malariainterventions.
Source:WorldHealthOrganization(2015).Thefigureshowstheamountoffundsallocatedtoanti-malariainterventionsinSenegal.Thereisajumpin 2009,whichcoincideswiththefirstnationwidedistributionofbednetsandthefreedeliveryofcurativetreatmentsinpublichealthfacilities.Wehavedata onprivatehealthinvestmentsbefore(in2005–2006)andafter(in2010–2011)thejump.
theareasborderingGuinea.Thenationalaverageis24%. Weusethisthresholdtodefineareaswithalowmalaria prevalence(belowaverage,indarkblueonthemap)and areaswithahighprevalence(aboveaverage,inlightblue andyellowonthemap).Inlowprevalenceareas,the aver-ageprevalencerateisbelow10%,whichisconsideredby epidemiologistsashypoendemic(Bhattetal.,2015).Atthe bottomofFig.2,amapshowsthelocationofthe150 clus-terssurveyedinPSF,eitherinhighprevalenceareas(black triangles)orinlowprevalenceareas(graycircles).Weuse theHigh-Lowcategories inthedescriptivestatistics, for clarityofexposition,whereasintheeconometric specifi-cation,weexploitthecontinuousvariationinprevalence.
Weproceedtoadifference-in-differencesanalysiswith individualfixedeffects:
Yi,t=˛0+˛1 Prevalencei+˛2 Postt
+˛3 Postt×Prevalencei+ui+εi,t (1)
Yi,t is theoutcome ofinterest:theannuallevelof child
healthexpenditurespercapitainthehousehold (predic-tion1),adummyvariableequaltooneifthehousehold hasnohealthexpenditure(prediction2),adummy indicat-ingwhetherachildwassickandleftuntreated(prediction 3).Prevalenceiindicatestheinitiallevelofprevalencein
thecityblockorvillage(the“cluster”)wherehouseholdi lives.Posttequalsoneifthesurveytookplaceafter2009.
Standarderrorsareclusteredattheclusterlevelbecause malariaprevalenceismeasuredatthatlevelandwehave enoughclusters.Wetestpredictions1and2usingpanel data,in which casewe include amother fixedeffectui
(notethat˛1cannotbeestimated).Wetestprediction3
usingrepeatedcross-sections,inwhich casewe arenot abletoincludeamotherfixedeffect.InSections7and8, weintroducetime-varyingcontrolstoaccountforpotential confounders.
Theidealexperiment would betorandomlyallocate freeanti-malariatreatmentsinendemicareasandto exam-inetheimpactonhouseholds’health-seekingbehavior.13
13ThisexperimentisruninDupas(2014)withanotherobjective:check whethersubsidizingITNdecreasesthewillingnesstopayforanother healthproduct,waterchlorine.Shefindsnosignificantimpactand there-forerulesoutcross-productentitlementeffects.Butthesamplesizeis
Inoursetting,anti-malariacampaignswereimplemented inthewholecountryatthesametime.Thereisnoarea excludedortargetedatalaterstagethatcanbeusedasa controlgroup.Instead,weuseareaswherethecampaign couldnotmakeadifferencebecausemalariawasalready undercontrol.Ourcounterfactualisnotwhatwouldhave happenedinmalariousregionsintheabsenceofthe inter-vention, but what would have happened if there was nomalaria in theseregions. Such a strategy is used by
Bleakley(2010),Cutleretal.(2010),andLucas(2010)to assess the impactof childhood exposureto malaria on socio-economicoutcomes.Theyexploitmalaria eradica-tioncampaignsinseveralAmericanandAsiancountries. In the same vein, we exploit Roll Back Malaria to test thehypothesisthat,whenanti-malariatreatmentsarenot heavilysubsidized,thediseasepreventspoorhouseholds frominvestinginchildhealth.
This strategy was recently formalized and named “difference-in-differencesin reverse” in an econometric articlebyKim andLee(2019).In astandard difference-in-differences(DD),thetreatmentandcontrolgroupsare similarinthepre-periodanddifferentinthepost-period. In adifference-in-differences inreverse (DDR),theyare differentat thestart, and becomesimilar.Thischanges the interpretation of the coefficient on the interaction term.DDidentifiespost-periodeffects, whileDDR iden-tifiespre-periodeffects.Inourcontext,wecandefinethe treatmentas“beingaffectedbymalaria.”Inthepre-period, malariaprevalenceishigherinsomeareas:theyformour treatmentgroup.Inthepost-period,malariaprevalenceis loweverywhere,asdocumentedinSection2.The interac-tiontermthereforecapturestheimpactofmalariainthe pre-period,providedotherdriversofhealthexpenditures evolvedinthesamewayforallhouseholds.
Isthisassumptionlikelytohold?Columns2and3of
Table2 provide somedescriptive statistics of our
sam-ple,byinitialmalariaprevalence.Householdstructureis roughlythesameeverywhere: thereare2.6childrenon average,themotherisaround35yearsoldandtheaverage ageofchildrenisseven.Butruralandpoorerareastend
smallandthecoefficientispositiveandlarge,suggestingthatsubsidizing ITNmighthavefosteredtheadoptionofwaterchlorine.
Fig.2.Spatialvariation:Initialmalariaprevalence.
Notes:TheMalariaAtlasmapshowstheproportionofchildrenbetweenage2and10infectedbyPlasmodiumfalciparumin2000.Itrangesfrombelow 2%toabove60%.Weusethenationalaverage,24%,todefineareaswithalowmalariaprevalence(belowaverage,indarkblue)andareaswithahigh prevalence(aboveaverage,inlightblueandyellow).ThemaponthebottomshowsthelocationofPSFclustersinhigh(blacktriangles)andlow(gray circles)areas.(Forinterpretationofthereferencestocolorinthisfigurelegend,thereaderisreferredtothewebversionofthisarticle.).
tobemoreaffectedbythedisease.Wearguethat,despite thesedifferences,comparingareaswithhighandlowinitial prevalencecanbeinformativeforfourreasons.First,weuse previousDHSwavestolookatpre-trendsinhealth-seeking behavior and show that the catch-up had not started beforehand.Second,weexploitthepanelstructureofPSF toaccountforcompositioneffectsinhealthexpenditures.
Indeed,mother fixedeffects allowustodisentanglethe effectofpublicsubsidiesfromthatofchangesinpopulation characteristics.Whatremainstobediscussedarechanges intheenvironmentthatcouldhaveaffectedlowandhigh prevalenceareasdifferentlyduringourperiodofinterest. Thisis ourthirdtest:we examinedifferentialtrendsin otherdeterminantsofchildhealthexpenses:totalincome,
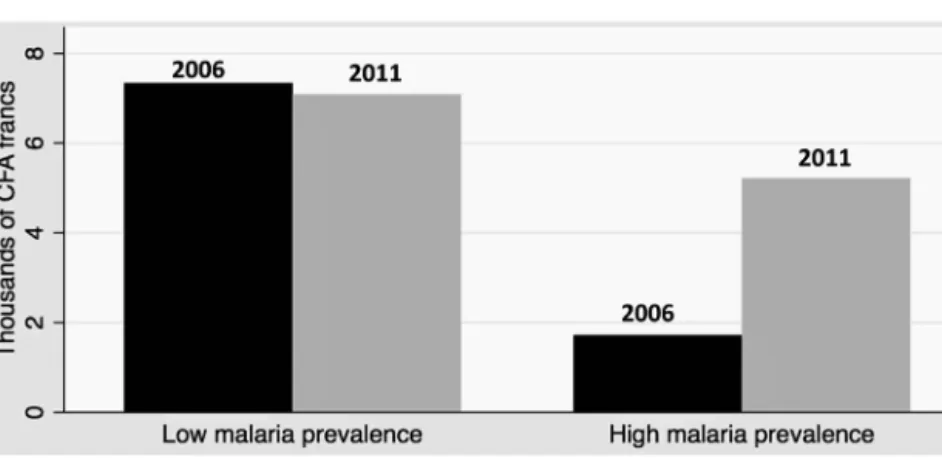
Fig.3.Childhealthexpenditures,beforeandafteranti-malariainterventions,byinitialprevalenceofmalaria.
Notes:Data:PSFPanel.Thefigureshowstheevolutionof(a)annualhealthexpendituresperchild,inthousandsofCFAfrancs(1euro=656CFAfrancs)and (b)thefractionofhouseholdswithzerospendingonchildhealth,inlowandhighmalariaprevalenceareas,before(2006inblack)andafter(2011ingray) anti-malariainterventions.Graph(a):thedifference-in-differencesisequalto3739CFAfrancs(p-value=0.051).Graph(b):thedifference-in-differences isequalto−13p.p.(p-value=0.012).
healthinfrastructure,otherhealthcampaigns,rainfall pat-terns,andgeographicaldynamics.WeshowinSection7
thattheyareunlikelytoexplainourresults.Fourth,weuse twotripledifferencestocircumventtheconcernthat unob-servedtime-varyingheterogeneitybetweenhighandlow prevalenceareasisdrivingthecatch-up.
6. Results
6.1. Healthexpenditures
Fig.3ashowsdescriptivestatisticsonhealth expendi-turesinthetwowavesofPSF,comparingareaswithahigh andlowprevalenceofmalaria.Inthefirstwave,households inhighprevalenceareasspentmuchless:onaverage,1720 CFAfrancsperchildperyearagainst7335inlowprevalence areas.Betweenthetwowaves,theytripledtheir consump-tionofhealthcommodities,upto5215,whiletherewas nosignificantchangeinlowprevalenceareas.Fig.3b dis-playstheextensivemargin.Householdsinhighprevalence
areaswere15.7p.pmorelikelytonotpayexpensestoward healthin2006thantheothers.In2011,theyhadalmost caughtup.BetweenthetwoPSFwaves,theproportionof householdswithzeroexpendituredecreasedby17.7p.p whereasamoremoderatedownturnof4.7p.phappened inlowprevalenceareas.14
InTable3,weincludemotherfixedeffectsandexploit thecontinuousvariationinprevalence.Regardingthe aver-agelevel of expenditures, in column 1, resultsare less strong,suggestingthatpartofthecatch-upisdrivenby compositioneffects.Butthereisalsoevidenceofachange inbehavior:thecoefficientontheinteractiontermisno longersignificantatconventionallevels,butthemagnitude remainslarge.Giventhedistributionofinitialprevalence, it corresponds to a catch-up of 3835 (resp. 1726) CFA
14 Estimationofthedifference-in-differencesregressionwithoutfixed effectscanbefoundinTableA.3intheappendix.Thecoefficientsonthe interactiontermsaresignificantlydifferentfromzero.
Table3
Difference-in-differences:childhealthexpenditures.
Specification Level Withouttop1% Log Ihs Zerospending
(1) (2) (3) (4) (5)
Post×Prevalence 6.392 3.375* 3.092** 0.929** −0.345**
(5.800) (1.885) (1.348) (0.369) (0.168)
Post 0.546 −0.139 0.098 0.014 −0.015
(1.776) (0.589) (0.342) (0.105) (0.040)
MotherFE Yes Yes Yes Yes Yes
N 4550 4504 4550 4550 4550
Meanofdep.var.in2006 5.24 3.22 −3.67 0.88 0.61
Data:PSFPanel.
Difference-in-differencesregressionwithmotherfixedeffects.Linearprobabilitymodels.Thelevelofobservationisahousehold,composedofamother andherdependentchildren.
Dependentvariables:healthexpenditurespercapitaforchildreninthehousehold(thousandsofCFAfrancs)incolumns(1)–(4);dummyfornohealth expendituresforanychildinthehouseholdincolumn(5).
Column(1):specificationinlevel;column(2):excludesthetop1%;column(3):logtransformation–adding0.001todealwithzeros;column(4):inverse hyperbolicsinetransformation.
Standarderrors,in(),areclusteredatthePSFclusterlevel. *p≤0.1,**p≤0.05,***p≤0.01.
francsbetweenareaswiththehighestandthelowest ini-tialprevalence(resp.aboveandbelowtheaverageinitial prevalence).Toputthesenumbersinperspective,Lépine andLeNestour(2012)reportthat,inruralSenegalin2009, healthfacilitieschargedanaverageof200and 100CFA francsfor adultand child outpatient care, respectively. Sohouseholds increasedtheirexpensesonchild health byanamountwhichisnotnegligible.Butthisamountis lowerthanthepriceofa bednetbeforemalariacontrol effortsstarted–around6500–8000CFAfrancs(President’s MalariaInitiative,2008).Thisisconsistentwithourclaim that,inthefirstwave,householdscouldnotafford preven-tativemalariameasures.
ResultsattheextensivemarginarereportedinTable3, column5.Thecoefficientontheinteractiontermremains of similar magnitude and significance as without fixed effects.Thefractionofhouseholdsthatstartedinvesting inchildhealthafteranti-malariacampaignswashigherby 21p.p.(resp.9p.p.)inareaswiththehighestinitial preva-lence,comparedtothelowestprevalence(resp.inareas abovethe averageinitialprevalencecompared toareas below).Theextensivemarginspecificationgivesmore pre-cise results than the average spending per capita. The reasonisthathealthexpenditurestypicallydisplaylong righttails.Thereareseveraloptionstodealwiththistype of distributions: excluding outliers (column 2), using a logtransformation (column3) oran inversehyperbolic sinetransformation(column4).Inallspecifications,the difference-in-differencescoefficientisstatistically signifi-cantatconventionallevels.
Wefurtherinspectthedistributionofnon-zerohealth expenditures to understand responses at the intensive margin.Fig.4aplotsthekerneldensityestimatesbefore and after the campaigns, in high and low prevalence areas.Asexpected,distributionsareheavilyskewed, fea-turinglowmodesandlongrighttails.Inlowprevalence areas,thedistributiondoesnotchangebetweenthetwo waves. In high prevalence areas, people switch from very low amounts toslightly higher amounts, converg-ingtoward thedistributionin low prevalenceareas.To formallytestwhetherthechangeinthedistributionof
non-zerohealthexpenditureswasdifferentbetweenhighand lowprevalenceareas,weestimateaquantileregression.
TableA.4intheAppendixreportsthequantile difference-in-differences estimates. Coefficients on Post are never significant, confirming the absence of changes in low prevalenceareas.Coefficientsontheinteractiontermare allpositive,confirmingthatthedistributionshiftedtothe rightinhighprevalenceareas.Importantly,thequantile difference-in-differencesestimateatthemedian(Q50)is 1500CFAfrancs,significantat1%,representinganincrease by75%relativetothebaseline.Asexpected,coefficientsare preciselyestimatedforlowerquantiles,whereasstandard errorsarelargeforupperquantiles.Thus,thereisapositive responseattheintensivemarginaswell.Butitisdifficult todetectduetothelargevarianceinhealthexpenditures, especiallyatthetop.
Last,wediscusschangesinthecompositionofhealth expendituresillustratedbyFig.4b.Inlowprevalenceareas, medicationaccountsfor60%ofexpenses,consultationfor 31%,commutingtohealthfacilitiesfor6%and hospitaliza-tionfor3%.Thebreakdowndoesnotchangeatallbetween thetwowaves.Thepictureisdifferentinhighprevalence areas. Before anti-malaria campaigns, households spent a much larger shareon medication(75%) and hospital-ization(10%)andonly9%onconsultation.Thescopefor preventative care seemed very limited. The breakdown changes markedly aftertheintroductionofanti-malaria subsidiesandconvergestowardthecompositionobserved inlowprevalenceareas:lessonmedicationand hospital-ization,moreonconsultation.Parentsallocatedadditional expensesdifferently,withasmallersharespentoncuring episodesofmalariaandalargersharespentonmedical examination.Anotherwaytodistinguishbetween preven-tativeandcurativetreatmentsistolookatsickandnon-sick childrenseparately(cf.Fig.A.1intheappendix).Thebulk ofhealthexpendituresismadeonsickchildren.Still,we observeaninterestingpatternonnon-sickchildren: spend-inginhighprevalenceareasincreasedfromvirtuallyzero inthefirstwavetoaround2000CFAfrancsinthesecond wave,whileremainingstableinlowprevalenceareas.The difference-in-differencesissignificantat10%.Allinall,we
Fig.4.Non-zerochildhealthexpenditures,beforeandafteranti-malariainterventions,byinitialprevalenceofmalaria.
Notes:Data:PSFPanel.Figure(a)plotsthekerneldensityestimatesofnon-zeroexpendituresonchildhealthbefore(graphontheleft)andafter(graph ontheright)anti-malariacampaigns,inlow(grayline)andhigh(blackline)malariaprevalenceareas.Figure(b)showsthecompositionofchildhealth expendituresbefore(graphsontheleft)andafter(graphsontheright)anti-malariainterventions,inlow(graphsatthetop)andhigh(graphsatthebottom) malariaprevalenceareas.Example:inlowprevalenceareasin2006,31%ofexpenditureswerespentonconsultation;6%oncommutingtohealthfacilities; 60%onmedication;and3%onhospitalization.
Table4
Difference-in-differences:health-seekingbehavior.
Sample Allchildren Allchildren Sickchildren
Dependentvariable Childissickanduntreated Childissick Childisuntreated
Diarrhea Feverandcough Diarrhea Fever Cough Feverandcough Diarrhea Feverandcough
(1) (2) (3) (4) (5) (6) (7) (8)
PanelA:Usingalinearprobabilitymodel
Post×Prevalence −0.050 −0.115* −0.000 −0.137** −0.021 −0.092 −0.216* −0.129 (0.054) (0.059) (0.061) (0.064) (0.067) (0.076) (0.113) (0.111) Post −0.038*** −0.029* −0.022 −0.047** −0.053** −0.059** −0.128*** 0.002 (0.014) (0.017) (0.017) (0.021) (0.022) (0.024) (0.036) (0.032) Prevalence 0.067 0.052 0.019 −0.014 −0.195*** −0.130** 0.240*** 0.357*** (0.045) (0.051) (0.048) (0.050) (0.054) (0.061) (0.081) (0.081) Constant 0.148*** 0.206*** 0.205*** 0.293*** 0.299*** 0.399*** 0.726*** 0.512*** (0.011) (0.014) (0.012) (0.015) (0.017) (0.018) (0.026) (0.023) MotherFE No No No No No No No No N 21,251 21,251 21,218 21,225 21,226 21,234 4221 6702
Meanofdep.varin2005 0.17 0.22 0.21 0.29 0.25 0.36 0.79 0.60
PanelB:Usingalogitmodel
Post×Prevalence −0.319 −0.774** 0.009 −0.879** −0.419 −0.566 −1.379** −0.572 (0.429) (0.373) (0.381) (0.349) (0.409) (0.351) (0.602) (0.474) Post −0.349*** −0.185* −0.140 −0.226** −0.242* −0.238** −0.547*** 0.016 (0.122) (0.111) (0.109) (0.111) (0.124) (0.109) (0.180) (0.132) Prevalence 0.483 0.303 0.117 −0.068 −1.062*** −0.563** 1.479*** 1.515*** (0.315) (0.296) (0.286) (0.245) (0.304) (0.265) (0.506) (0.354) Constant −1.746*** −1.347*** −1.354*** −0.881*** −0.839*** −0.406*** 0.946*** 0.036 (0.083) (0.083) (0.075) (0.073) (0.087) (0.077) (0.148) (0.096) MotherFE No No No No No No No No N 21,251 21,251 21,218 21,225 21,226 21,234 4221 6702
Meanofdep.varin2005 0.17 0.22 0.21 0.29 0.25 0.36 0.79 0.60
Data:DHS2005andDHS2010.Samples:Allchildrenunderage5incolumns(1)–(6).Sickchildrenunderage5incolumns(7)–(8). Difference-in-differencesregressionwithoutmotherfixedeffects.PanelA:Linearprobabilitymodel.PanelB:Logitmodel. Dependentvariablesin:
Columns(1)–(2)and(7)–(8):Dummyequalto1ifthemotherdidnotseekanymedicaladviceormedicaltreatmentincaseofdiarrhea(columns(1)and (7)),andfeverand/orcough(columns(2)and(8)).
Columns(3)–(6):Dummyequalto1ifthechildsufferedfromdiarrhea(column(3)),fever(column(4)),cough(column(5)),andfeverand/orcough(column (6))inthelasttwoweeks.
Standarderrors,in(),areclusteredattheDHSclusterlevel. *p≤0.1,**p≤0.05,***p≤0.01.
findevidenceofacatch-upinhealthexpendituresnotonly inlevelsbutalsoincomposition.
6.2. Health-seekingbehavioragainstotherdiseases
Table 4 Panel A presents the estimates of Eq. (1)
for health-seeking behaviors related to diarrhea and a fever/cough.15Incolumns1and2,welookatthe probabil-ityofbeingsickandleftuntreatedamongallchildrenunder agefive.Betweenthetwowaves,thisprobabilitydecreased everywhere,andthedeclinewasstrongerin areaswith higherprevalence.Istheprogressdrivenbyfewerdisease episodesorbymoreremedialcare?Inanutshell,wefind evidenceofchangesinhealth-seekingbehavioronthe pre-ventivesideforfever,andonthecurativesidefordiarrhea. Incolumns3to6,welookattheprobabilityofbeingsick. Thelikelihood of a fever, a major symptomof malaria, decreasedmoreinmoremalariousareas,supportingthe ideathatthedistributionofITNswaseffectivein
prevent-15 Thesearetheonlydiseasesonwhichwehaveinformation.Inthedata, wecandistinguishbetweenfeverandcoughsfortheprobabilityofbeing sick,butnotfortheprobabilityofbeingtreated.
ingmalariousepisodes.16 Trendsfordiarrheaandcough arenotstatisticallydifferentbetweenareas.Incolumns7 and8,werestrictthesampletosickchildrenandlookat theprobabilityofbeingleftuntreated.Inthecaseof diar-rhea,parentsweresignificantlylesslikelytoseekmedical adviceortreatmentinhigherprevalenceareasin2005.The correlation entirelydisappearsbetweenthetwo waves, suggestingthatparentsstartedactingupondiarrheaonce theyhadbeenrelievedfrommalaria.Inthecaseoffeverand coughs,thecoefficientontheinteractiontermisnegative, butsmallerandnotsignificant.Thismaybeexplainedbya strongattenuationbiasgeneratedbyselectionintoillness, since thepool of children sufferingfromfever changed inmalariousareasafterthecampaigns.Duetodata lim-itations, we cannot run the regression for only coughs.
16Inlevels,parentsarenotmorelikelytoreportthatachildwassickin malariousareas,whichisatoddswiththemedicalliteraturedescribing malaria’stollonchildhealth.Oneexplanationisthatmeasuresof self-reportedhealthareinfluencedbysocio-economicstatus.Forinstance,
Sen(2002)showsthatKerala,thestatewiththehighestlifeexpectancyin
India,consistentlydisplaysthehighestratesofreportedmorbidity.This mayexplainwhyreportedmorbidityisnotlowerinlowerprevalence areas,wherepeopleareonaveragebetteroff.
samepatternholdsinbothcountries:highprevalenceareas catchupwithlowprevalenceareasinthesecondwave.The intensityofthecatch-updependsontheinitialgap–higher inRwanda,lowerinKenya.
6.3. Tripledifferencesexploitingadultsandcampaign intensity
Accordingtothemodel,theperceivedchangeinmalaria mortalityriskisthekeydriveroftheresponse.Holding initialprevalenceconstant,healthexpensesaretherefore predictedtoincreasemoreinsubpopulationswithahigher initialriskorwithastrongerchangeinrisk.Childrenare more likely to diefrom malaria than adults.17 We can thereforeusetheevolutionofadulthealthexpendituresto accountforconfoundingchangesinthedemandandsupply ofhealth.Sofar,weonlyexploitedinformationon chil-dren,butweobserveannualhealthexpendituresforeach memberofthehousehold.Wearethusabletoconstruct theaveragehealthspendingperadultineachhousehold.18 Toidentifyacausalimpact,weneedtoassumethatother driversofhealthexpendituresspecifictochildrenevolved inthesamewayinhighandlowinitialprevalenceregions. ResultsarereportedinTableA.6intheappendix.Between thetwowaves,adulthealthexpenditurestendtoincrease, andthechangeisnotcorrelatedwithmalariaprevalence. The coefficient on Post×Prevalence is small and never statisticallysignificant.Bycontrast,childhealth expendi-turesdoincreaseproportionallywithmalariaprevalence. Coefficientsonthetripleinteractionhavethesamesign andmagnitudeasthedifference-in-differencesestimates reportedinTable3.Thissuggeststhatthedemandand
sup-17In2000,91%ofmalaria-relateddeathsaffectedchildrenagedunder five:694,000deathsinchildrenoutof764,000deathsinallagesinAfrica
(WorldHealthOrganization,2015).
18Specifically,weestimatethefollowingequation:
Yi,m,t=
ˇ0+ˇ1 Postt+ˇ2 Postt×Prevalencem+ˇ3 Childreni +ˇ4 Prevalencem×Childreni+ˇ5 Postt×Childreni +ˇ6 Postt×Prevalencem×Childreni+um+εi,m,t
(2)
WhereYi,m,tistheannualhealthspendingperadultifChildren=0andper childifChildren=1inthehouseholdofmotherminwavet.Weincludea motherfixedeffectumtocomparetheevolutionofadultsandchildrenin thesamehousehold.ˇ2capturesanychangeinhealthexpenditures cor-relatedwithinitialmalariaprevalence.Thesechangesmaybecausedby reasonsunrelatedtomalariacontrol–theseregionsaredifferenttostart with.Ortheymayhappenbecauseofmalariacontrol,butnotthroughthe competingriskschannelsincemalariamortalityislowamongadults.The competingriskchannel,peculiartochildren,iscapturedbyˇ6.ˇ6 iden-tifiesanadditionalchangeinhealthexpendituresonchildren,compared toadults,whichiscorrelatedwithinitialprevalence.
intensecampaigns.EstimatesareshowninTableA.7inthe appendix.Thecatch-uphappenseverywhereand seems tobe faster in districts where more bednets were dis-tributed.CoefficientsonPost×Prevalencearethesameas thedifference-in-differencesestimates,andcoefficientson thetripleinteractionarelarge,butnotsignificant.Bya pre-ponderanceoftheevidence,wethereforearguethatpeople indeedrespondedmorestronglywhentheyexperienceda strongerchangeinmalariamortalityrisk.
7. Alternativehypotheses
Overall,wefindthat,afteranti-malariacampaigns, pri-vatehealthinvestments,intotalandagainstotherdiseases, increased more in highly malarious areas than in low prevalenceareas.Thisisconsistentwithourframework ofinvestmentsundercompetingrisks.Inthissection,we discussfivealternativehypothesisthatmaygeneratethe sameempiricalpatterns:pre-trends,totalincome,access tohealthcare(infrastructureandcampaigns),rainfall,and geographical dynamics.We explain whythese explana-tionsdonotconfoundourresults,andinfactmakethem stronger.
7.1. Pre-trends
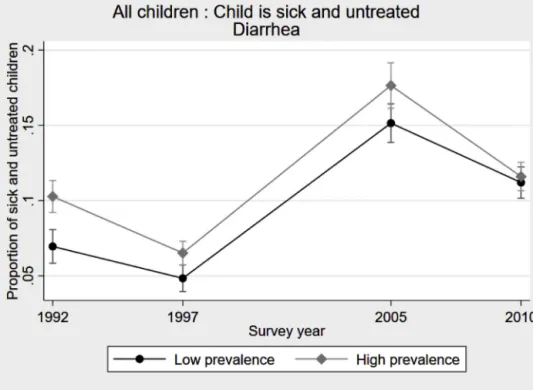
Thefirstconcernweneedtoruleoutisthat malari-ousareasmayhavestartedtocatchupwithnon-malarious areaslongbeforethecampaigns.UsingDHSconductedin 1992and1997,wecanlookattheevolution of health-seekingbehavioragainstotherdiseases. Fig.5plots the proportion of sick and untreated children in the case ofdiarrhea. Therearesomefluctuations,1997 beingan especiallygoodyear.19Butthesefluctuationsaresimilar everywhere;inparticular,thecatch-upobservedbetween 2005and2010wasnotunderwayintheearly2000s. 7.2. Totalincome
The second alternative hypothesis argues that total income grew faster in highly malarious areas. It might bedue toconfoundingfactors,orspecificallybecauseof malariacontrolifhealthimprovementsbenefitedadults,
19 Weinvestigatedwhetherthiscouldbedrivenbyseasonalityin diar-rhoealdiseasesbutitdoesnotseemtobethecase.Allwaveswere conductedinthewinterandamethodologicalreportassessingthe qual-ityofDHShealthdatafindsnoevidenceofseasonalityofdiarrheainthe 1997Senegalesesurvey(Pullum,2008).
P. Rossi and P. Villar / Journal of Health Economics 73 (2020) 102330 Table5
Testsforalternativeexplanations.
Hypothesis Income Healthinfrastructure Othercampaigns Communityhealthworkers Rainfall Dependentvariable Household
total expenditures Distanceto health facilitiesisa concern Childis untreatedin caseof diarrhea Expenditures inlevel Expenditures inlog Zero spending Expenditures inlevel Expenditures inlog Zero spending (1) (2) (3) (4) (5) (6) (7) (8) (9) Post×Prevalence −84.226 0.064 −0.309** 11.253 3.094* −0.325* 8.881 3.940*** −0.442** (68.264) (0.144) (0.133) (7.316) (1.582) (0.194) (7.096) (1.447) (0.177) Post 23.223 −0.041 −0.125*** 0.734 0.098 −0.014 0.588 0.112 −0.017 (22.569) (0.044) (0.036) (1.770) (0.341) (0.040) (1.772) (0.343) (0.041) Prevalence 0.578*** 0.240*** (0.109) (0.081) Constant 0.250*** 0.726*** (0.032) (0.026)
Controls No No Zincdistribution Numberofhealthworkers Rainfallshocks
MotherFE Yes No No Yes Yes Yes Yes Yes Yes
N 4550 19,098 4221 4550 4550 4550 4548 4548 4548
Meanofdep.var.in2006 310.1 0.40 0.79 5.24 −3.67 0.61 5.24 −3.67 0.61 Data:columns(1)and(4)–(9):PSFPanel.Thelevelofobservationisahousehold,composedofamotherandherdependentchildren.Columns(2)–(3):DHS2005andDHS2010.Samples:mothersofchildren under18incolumn(2)andsickchildrenunderage5incolumn(3).
Difference-in-differencesregression.LinearProbabilityModel.
Dependentvariables:column(1):Totalexpendituresforthehouseholdinthelast12monthsinthousandsofCFAfrancs;column(2):Dummyequalto1ifdistancetothenearestfacilityisamajorproblemwhen therespondentissickandwantstogetmedicaladviceortreatment;column(3):Dummyequalto1ifthemotherdidnotseekanymedicaladviceormedicaltreatmentincaseofdiarrhea;columns(4)and(7): Healthexpenditurespercapitaforchildreninmother’shousehold(thousandsofCFAfrancs),inlevel;columns(5)and(8):logtransformation–adding0.001todealwithzeros;columns(6)and(9):Dummyfor nohealthexpendituresforanychildinthemother’shousehold.
Controls:Column(3):Quantityofzinctabletsdeliveredintheregion.Columns(4)–(6):numberofcommunityhealthworkersintheregion.Columns(7)–(9):annualrainfalldeviationfromthecluster-level mean.
*p≤0.1,**p≤0.05,***p≤0.01.
Fig.5.Pre-trendsinhealth-seekingbehavior.
Notes:Data:DHS1992,DHS1997,DHS2005,andDHS2010.Sample:Allchildrenunderage5.Thefigureshowstheproportionofsickanduntreated childreninthecaseofdiarrhea.Barsrepresentthe90%confidenceintervals.
inparticularmothersandbreadwinners.Thiscouldlead toapositiveincomeeffectinhighlymalariousareas,for example,throughanenhancementoflaborproductivity. If health investmentsare normal goods,an increase in incomeshouldtranslateintoanincreaseinhealth expen-ditures. To tackle this issue, we test whether there is a differentialrisein all expenditures.We measuretotal consumption at the household level, including adults. DescriptivestatisticsinTable2indicatethathouseholds inhighlymalariousareaswerepoorerthantheothersto startwith:185vs.384thousandsofCFAfrancs.Column
1 inTable5 showsthat theydidnotcatchupbetween
thetwowaves.Thecoefficientontheinteractiontermis small, insignificant,and ifanything negative.Compared tolow prevalenceareas, households inhighprevalence areasdidnotbecomericher;theymerelyreallocatedpartof theirexpensestochildhealth.Wetriedtoidentifywhich expenseitemsexperienceda decrease,buttheamounts in question are toosmall tobe detected.20 We specifi-callylookedatadulthealthexpenditurestoseeifexpenses arereallocatedfromparentstochildren. Thisis notthe case: adult health expenditures have increased every-where betweenthe two waves. This is consistentwith thecompetingriskchannelandnotwiththeadulthealth channel.
20Childhealthexpendituresaccountfor3%ofthehouseholdtotal con-sumption.
7.3. Accesstohealthcare
The third alternative hypothesis is about access to healthcare.Wefocusonthreekeyelementsthatchanged duringourperiodofinterest.21First,weexploit informa-tionaboutdistancetohealthfacilitiesrecordedintheDHS. Mothers areasked whetherdistance is a main concern whenseekingmedicaladviceortreatmentforthemselves. AsshownbyTable5,column2,accesswasagreater prob-leminareaswithmoremalariain2005andtherewasno catch-upbetweenthetwowaves.Ifanything,accessseems tohave improvedless in higher prevalenceareas. Sec-ond,therewasaconcomitantcampaignagainstdiarrhea.22 In2010,approximately6millionzincdispersibletablets weredeliveredtoSenegalbyUNICEF,andtheywereonly distributed in a few regions (Derosena, 2011).If these regionswerepredominantlyhighlymalariousareas,this mayexplainthechangeinhealth-seekingbehavioragainst diarrheadescribedinTable4,column7.Infact,the oppo-sitehappened:theinterventionwaspilotedfirstinthelow prevalenceregionofThies.Usingdatapublishedina tech-nicalreportfromUNICEF(Derosena,2011),weareableto controlforthequantityoftabletsdistributedineachregion
21 Ideally,wewouldneedgeo-codeddataonhealthprovisionbeforeand after2009tocomprehensivelyexaminethismechanism.ServiceProvision Assessmentsurveysprovidethistypeofinformationbutthefirstwave wascollectedin2012–2013,sowecannotmeasurevariations.
22 Anothercampaignagainstmeasleswasimplementedbetween2005 and2010.UsingDHSdata,wecheckedthattheprogressinimmunization coveragewasnotcorrelatedwithinitialmalariaprevalence.
whentestingprediction3inTable5,column3.Asexpected, thecoefficientontheinteractiontermincreasesinsizeand significance.Third,weexaminetheintroductionof com-munityhealthworkersundertheprogramPECADOM(Prise EnChargeADomicile).Healthworkersconduct door-to-doorvisitsintheirvillagetoimprovesurveillance,testing, andtreatment.Thesystemwasintroducedinthreedistricts in2008andgraduallyexpandedto37districtsby2011, coveringbothhighandlowprevalenceareas(PlanNational deLutteContrelePaludismeauSénégal,2012).Duringthat period,healthworkersfocusedexclusivelyonmalaria,so theseeffortstoreachout toeveryonecannot driveour cross-diseaseresult.Still,theylowertransactioncostsand mightexplainwhypeoplestartspendingonmalaria.Plan
NationaldeLutteContrelePaludismeauSénégal(2012)
providesdetailedinformationonthechangeinthe num-berofcommunityhealthworkersineachregionbetween thetwowavesofourpanel.Whenweincludethiscontrol inTable5,columns4to6,ourcoefficientsremainstable. Sotheincreaseinspendinginhighprevalenceareasisnot drivenbyathickernetworkofhealthworkers.
7.4. Rainfall
Thefourthalternativehypothesisemphasizesthe cor-relationbetweenrainfall and malaria transmission.The occurrence and intensity of malaria infection is closely relatedtorainfallpatterns.Thesurgeinhealth expendi-turesinhighlymalariousregionscouldpotentiallyresult fromvariationsintheenvironment.Iftheyear2006was particularlydrywhile2011wasparticularlyrainy,people wouldhavespentmoreoncurativetreatmentsinthe sec-ondwave.Weruleoutthishypothesisusingageo-coded measureofyearlyrainfallprovidedbytheClimateHazards Group23thatwewereabletomergewiththePSFpanel, withtheexceptionofonecluster.Thisallowsusto com-putepositive(flood)andnegative(drought)rainfallshocks foreachPSFclusterandforbothwaves.24Itturnsoutthat theyear2006wasslightlymorerainythanusual(6clusters outof149experiencedaflood)whereastheyear2011was slightlymoredry(12clustersexperiencedadrought).As aconsequence,ourspecificationwouldtendto underesti-matethecausalimpactofanti-malariasubsidiesonhealth expenditures.Whenwecontrolfortheannualrainfall devi-ationfromthehistoricalmean,ourcoefficientsofinterest increaseinmagnitudeandinsignificance(cf.columns7to 9inTable5).
7.5. Geographicaldynamics
Thelast alternativehypothesis is that ourestimates capturedifferentdynamicsbetween geographicalareas,
23 WeusetheClimateHazardsGroupInfraRedPrecipitationwithStation data(CHIRPS)thatcombinessatelliteimageryandrainfallstationdatato produceannualprecipitationmeasurefrom1981to2015.Formore infor-mationonthisdataset,seehttp://chg.ucsb.edu/data/chirps/index.html.
24 Wedefineaspositive(resp.negative)rainfallshockstheobservations whoseannualrainfallmeasureisonestandarddeviationabove(resp. below)theclusterhistoricalmeanofannualrainfallcalculatedoverthe 1981–2015period.
forinstance,betweendifferentadministrativeregionsof Senegalorbetweenruralandurbanareas.Malariaismore prevalent in rural areas, as shown by Table 2. It may bethecasethatruralareascaughtupwithurbanareas during the period of interest, for at least two reasons. First,thereismoreroomforimprovement.Second,food andfuelpricesincreasedsubstantiallybetween2006and 2011,whichmighthaveconstrainedthegrowthofhealth spendinginurbanareas.Toruleoutthisconcern,wefirst lookaturbanandruralareasseparately.TableA.8inthe Appendixshowthatthesamespendingpatternisobserved in each subpopulation,although welosea lot ofpower whensplittingthesample.Estimatesarelargerinurban areas,whichisconsistentwiththetheoreticalprediction thatswitchersareinthemiddleoftheincome distribu-tion. In rural areas, the fractionof people for whom it becomesprofitabletoinvestinchildhealthislikelytobe small;otherconstraintsremainbinding.Moregenerally, inTableA.9intheAppendix,weaccountforpotentially divergingregionaltrendsbyinteractingPostwithdummies foreachadministrativeregionofSenegal(seebordersin
Fig.2).Bycomparingclusterswithadifferentprevalence locatedin thesameregion,wefindstronger resultsfor healthexpenditures(columns1to3)andhealth-seeking behaviors(columns4and5).Thedifference-in-differences coefficientsarelarger,suggestingthatspurious geographi-caldynamicstendtoattenuatethemechanismwewantto highlight.
8. Robustness
Finally, this section presents robustness tests using alternativedefinitionsofthetreatment,unitsof observa-tionsandstandarderrors.Wealsoaccountformigration andattrition.
8.1. Alternativedefinitionoftreatment
Thebaselineeconometricspecificationusesa contin-uousmeasureofprevalence. Alternatively,wecanusea binaryvariableandcheckthatourresultsholdupto dif-ferentcuts.TablesA.1andA.2intheAppendixreportthe estimates of interest using ascutoff points theaverage prevalencein2000andin2006aswellasthethresholds defininglowendemicity(10%)andhighendemicity(40%) in themedicalliterature.Coefficientsontheinteraction termareoftenmorepreciselyestimatedthanwiththe con-tinuoustreatment.Inparticular,theeffectattheextensive marginisstrongerandmoresignificantwhenthecut-off pointislower.Thisisinformativeaboutparentalbeliefs: inthemodel,thefractionofswitchersisrelatedtothe dif-ferencebetweentheperceivedchildsurvivalratewithand withoutinvestinginanti-malariaproducts.Thisfraction shouldbelargerwhentheinitialmalariamortalityriskis larger,buttheorydoesnotpredictwhetherthe relation-ship shouldbelinear,concaveor convex.Our estimates revealthatevensmallprevalencelevelsareperceivedas animportantmortalityriskbyparents.Onlypeople liv-inginamalaria-freeenvironmentdonotrespondtothe
tialchangeinhouseholdstructure.Forinstance,ifmothers inmalariousregionsaremorelikelytohaveanotherchild betweenthetwowavesandhealthexpendituresarehigher oninfantsthanonolderchildren,thenwewouldobserve arelativeincreaseinhealthexpensesintheseregions.To addressthisconcern,wechangetheunitofanalysisfrom the householdtothe child level.27 We include all chil-drenwhowerebornandlivingwiththemotherinPSF1. We followtheminPSF2,whatevertheresidencestatus, andexaminetheevolutionoftheirhealthexpenditures.In
TableA.10,columns1to3,intheappendix,weconfirm
thattestingpredictionsatthechildlevelleadstothesame conclusionasthehousehold-leveltest:individualexpenses increasemuchmoreinhighprevalenceareas.Incolumns4 to9,wesplitthesampleofchildrendependingontheirage atthetimeoftheintervention.Coefficientsarelargerfor childrenyoungerthanfivein2009.Thisisconsistentwith ourmodel:episodesofmalariadogreaterharmtoyounger children,inparticulartheunder-fives,thereforeparental health-seekingbehaviorshouldchangemoreinresponse tothecampaign.
8.3. Alternativestandarderrors
Weconsidertwotypesofadjustments.First,weusea spatialheteroscedasticity and autocorrelationconsistent (HAC)estimator(Conley,1999,2008).The difference-in-differencesp-valuesforvariousdistancecutoffs(from10 to250km)rangefrom0.14to0.18whenlookingat expen-dituresin levels,andfrom0.01to0.03whenlookingat theextensivemargin.Second,weimplementaprocedure toaccountformultiplehypothesistesting (Romano and Wolf,2005a,b).Thosecoefficientsthataresignificantly dif-ferentfromzerowithoutthecorrectionremainsignificant at10%withthecorrection.Wealsoperformajointtestof thethreepredictions,takingtogethercolumns1and5of
Table3andcolumns1and2ofTable4.Thesignificance levelofthejointtestis2%.
25Wecometothesameconclusionifweestimatearegressionwith PrevalenceandPrevalence2(notshown).
26Mortalityispotentiallyaconcernbutthenumberofhouseholds expe-riencingachilddeathbetweenthetwowavesistoosmall(below2%)to driveourresults.
27Anotheroptionistointroducesomecontrolsrelatedtothe house-holdstructure:averageageofchildren,numberofchildren,andshareof childrenunderfive.Ourcoefficientsremainverystableinmagnitudeand significance,asshownbycolumns1to3inTableA.11intheAppendix.
migrants,resultsareverystable,asshownincolumns4to 6inTableA.11intheAppendix.
8.5. Selectiveattrition
Anotherissuewouldariseiftheattrition observedin thePSFpanelwereselecteddifferentiallybetween malar-iousandnon-malariousareas.Attritionislimited:only5% ofmothersinmalariousareasand12%ofmothersin non-malariousareaswerenotfoundinthesecondwave.Our coefficientofinterestcouldpotentiallybebiasedupwards intwo cases.First, ifattritedmothers innon-malarious areaswerepreciselytheoneswithalargeincreaseinhealth expendituresbetweenthetwowaves.Second,ifattrited mothersinmalariousareaswerepreciselytheoneswith nochangeinhealth expenditures. Thefirstconditionis unlikelytoholdbecauseattritedmothersinnon-malarious areasarericherandspendtwiceasmuchasnon-attrited onesonchildhealthinPSF1.Forthemitisreasonableto supposethattheywerealreadyinvestinginthe preven-tionofalldiseases.Regardingthesecondcondition,attrited mothersinmalariousareaswerealsoricherbuttheyspent relativelylittleonhealthcommoditiesfortheirchildren.If anything,theyseemtobeinasituationwhereswitchingto positivehealthspendingislikely.Allinall,ourcoefficient ofinterestismorelikelytobeunderestimatedratherthan overestimatedbyattrition.
9. Discussionandconclusions
Therearetwopotentialchannelsthroughwhich anti-malariacampaignsmayaffectbehaviors:astrongdecrease inpriceandinformation.28Ontheonehand,Armandetal.
(2017) argue that public interventions raise awareness
ofthedangersofmalaria amongthepopulationsothat peoplechange theirbeliefs about thereturns to avoid-ingthedisease.Ontheotherhand,Dupas(2009)provides experimentalevidencethatdemandformalaria preven-tionisverysensitivetoprice,butisnotatallinfluenced
28 Athirdpotentialchannelcouldbethatdistributingfreeproducts impactedhealthcareutilizationviaincreasedfamiliaritywithhealth facil-ities.However,inourcontext,theroomforimprovementseemslimited becausethevastmajorityofmotherswerealreadyusedtovisitinglocal healthcenterstogetfreecareforthemselvesandtheirchildren.In2005, 87%ofpregnantwomenhadreceivedpre-natalcareandover95%of childrenhadreceivedatleastonevaccine(NdiayeandAyad,2006).