HAL Id: hal-02350085
https://hal.archives-ouvertes.fr/hal-02350085
Submitted on 20 Nov 2020
HAL is a multi-disciplinary open access
archive for the deposit and dissemination of
sci-entific research documents, whether they are
pub-lished or not. The documents may come from
teaching and research institutions in France or
abroad, or from public or private research centers.
L’archive ouverte pluridisciplinaire HAL, est
destinée au dépôt et à la diffusion de documents
scientifiques de niveau recherche, publiés ou non,
émanant des établissements d’enseignement et de
recherche français ou étrangers, des laboratoires
publics ou privés.
LC–MS/MS-based quantification of efflux transporter
proteins at the BBB
David Gomez-Zepeda, Méryam Taghi, Maria Smirnova, Philippe Sergent,
Wang-Qing Liu, Cerina Chhuon, Michel Vidal, Martin Picard, Elizabeth
Thioulouse, Isabelle Broutin, et al.
To cite this version:
David Gomez-Zepeda, Méryam Taghi, Maria Smirnova, Philippe Sergent, Wang-Qing Liu, et al.. LC–
MS/MS-based quantification of efflux transporter proteins at the BBB. Journal of Pharmaceutical and
Biomedical Analysis, Elsevier, 2019, 164, pp.496-508. �10.1016/j.jpba.2018.11.013�. �hal-02350085�
Contents lists available atScienceDirect
Journal
of
Pharmaceutical
and
Biomedical
Analysis
j o u r n a l h o m e p a g e :w w w . e l s e v i e r . c o m / l o c a t e / j p b a
LC–MS/MS-based
quantification
of
efflux
transporter
proteins
at
the
BBB
David
Gomez-Zepeda
a,b,c,∗,
Meryam
Taghi
a,b,c,
Maria
Smirnova
a,b,c,
Philippe
Sergent
d,
Wang-Qing
Liu
b,e,
Cerina
Chhuon
f,
Michel
Vidal
b,e,g,
Martin
Picard
b,h,1,
Elizabeth
Thioulouse
i,
Isabelle
Broutin
b,h,
Ida-Chiara
Guerrera
f,
Jean-Michel
Scherrmann
a,b,c,
Yannick
Parmentier
d,
Xavier
Decleves
a,b,c,g,
Marie-Claude
Menet
a,b,c,j,∗aInserm,UMR-S1144,ResponseVariabilitytoPsychotropics,Paris,France bUniversitéParisDescartes,Paris,France
cUniversitéParisDiderot,Paris,France
dTechnologieServier,Départementderecherchebiopharmaceutique,Orléans,France
eCNRS,UMR8638,ChimieOrganique,MédicinaleetExtractiveetToxicologieExpérimentale,Paris,France fPlateformeProtéomique3P5-Necker,SFRNecker,US24,UniversitéParisDescartes,Paris,France gUFBiologiedumédicamentettoxicologie,HôpitalCochin,APHP,Paris,France
hCNRS,UMR8015,LaboratoiredecristallographieetRMNbiologiques,France iServicedebiochimie,HôpitalArmandTrousseau,APHP,Paris,France jUFHormonologie,HôpitalCochin,APHP,Paris,France
a
r
t
i
c
l
e
i
n
f
o
Articlehistory:Received26March2018
Receivedinrevisedform29October2018 Accepted5November2018
Availableonline8November2018 Keywords: ABCtransporters LC–MS/MS MRMquantification Targetedproteomics
a
b
s
t
r
a
c
t
Targetedproteinquantificationusingtandemmassspectrometrycoupledtohighperformance
chro-matography(LC–MS/MS)hasbeenusedtoquantifyproteinsinvolvedintheabsorption,distribution,
metabolismandexcretion(ADME)ofxenobioticstobetterunderstandtheseprocesses.Atthe
blood-brainbarrier(BBB),theseproteinsareparticularlyimportantforthemaintenanceofbrainhomeostasis,
butalsoregulatethedistributionoftherapeuticdrugs.Absolutequantification(AQUA)isachievedby
usingstableisotopelabeledsurrogatepeptidesspecifictothetargetproteinandanalyzingthedigested
proteinsinatriple-quadrupolemassspectrometerinmultiplereactionmonitoring(MRM)modeto
achieveahighspecificity,sensitivity,accuracyandreproducibility.Themainobjectiveinthisworkwas
todevelopandvalidateanUHPLC-MS/MSmethodforquantificationoftheATP-bindingcassette(ABC)
transporterproteinsBcrpandP-gpandNa+/K+ATPasepumpattheBBB.Threeisoformsofthe␣-subunit
fromthispump(Atp1a1,2and3)werequantifiedtoevaluatethepresenceofnon-endothelialcells
intheBBBusingonecommonandthreeisoform-specificpeptides;whileBcrpadP-gpwere
quanti-fiedusing2and3peptides,respectively,toimprovetheconfidenceontheirquantification.Theprotein
digestionwasoptimized,andtheanalyticalmethodwascomprehensivelyvalidatedaccordingtothe
AmericanFoodandDrugAdministrationBioanalyticalMethodValidationGuidancepublishedin2018.
Linearityacrossfourmagnitudeorders(0.125to510pmol·mL−1)sub-pmol·mL−1LODandLOQ,
accu-racyandprecision(deviation<15%andCV<15%)wereprovenformostofthepeptidesbyanalyzing
calibrationcurvesandfourlevelsofqualitycontrolsinbothapuresolutionandacomplexmatrixof
digestedyeastproteins,tomimicthematrixeffect.Inaddition,digestionperformanceandstability
ofthepeptideswasshownusingstandardpeptidesspikedinayeastdigestormousekidneyplasma
membraneproteinsasastudycase.Thevalidatedmethodwas usedtocharacterizemousekidney
plasmamembraneproteins,mousebraincorticalvesselsandratbraincorticalmicrovessels.Mostof
theresultsagreewithpreviouslyreportedvalues,althoughsomedifferencesareseenduetodifferent
sampletreatment,heterogeneityofthesampleorpeptideused.Importantly,theuseofthreepeptides
Abbreviations:ADME,absorption,distribution,metabolismandexcretion;BBB,blood-brain;MRM,multiplereactionmonitoring;SIL,stableisotopelabeled. ∗ Correspondingauthorsat:Inserm,UMR-S1144,ResponseVariabilitytoPsychotropics,Paris,France.
E-mailaddresses:david.gomez.zepeda@cinvestav.mx(D.Gomez-Zepeda),marie-claude.menet@parisdescartes.fr(M.-C.Menet).
1 Currentaddress:LaboratoiredeBiologiePhysico-ChimiquedesProtéinesMembranaires,CNRSUMR7099,InstitutdeBiologiePhysico-Chimique(IBPC),Paris,France. https://doi.org/10.1016/j.jpba.2018.11.013
allowedthequantificationofP-gpinmousekidneyplasmamembraneproteinswhichwasbelowthe
limitofquantificationofthepreviouslyNTTGALTTRpeptide.Thedifferentlevelsobtainedforeach
pep-tidehighlighttheimportanceanddifficultyofchoosingsurrogatepeptidesforproteinquantification.In
addition,usingisoform-specificpeptidesforthequantificationoftheNa+/K+ATPasepump,weevaluated
thepresenceofneuronalandglialcellsonratandmousebraincorticalvesselsinadditiontoendothelial
cells.Inmouseliverandkidney,onlythealpha-1isoformwasdetected.
©2018ElsevierB.V.Allrightsreserved.
1. Introduction
Absolutequantificationofproteinsbymassspectrometry(MS) isusedinmanyfieldsofbiologytocharacterizecellsandtissuesas wellastheirbiologicalprocessesandproteinlevelchanges.These methods havegained popularitybecauseof itshighsensitivity, accuracy,reproducibilityandthepossibilityofanalyzingmultiple proteinsinasingleanalysis.Inbiopharmaceuticalresearch,thereis aparticularinterestintheuseofthesemethodstoquantifyproteins involvedintheabsorption,distribution,metabolismandexcretion (ADME)ofxenobioticsin ordertobetterunderstandthese pro-cesses.Therefore,targetedabsoluteproteinquantificationhasbeen usedtocharacterizetheexpressionoftransporters,receptors,tight junctionproteinsanddrugmetabolizingenzymesindifferentstudy models(invivo[1,2]andinvitro[3]),butalsoinhumansamples [4–7].
The ATP-binding (ABC) transporters family is particularly importantfortheADMEofnutrientsandexogenoussubstances. Theyaremostlylocatedattheplasmamembraneinthetissue inter-facessuchasendotheliaandblood-tissuebarrierswheretheyefflux ahighvarietyofsubstrates.Theyarefoundintheintestine,liver, kidney,heart,lungs,brain,placentaandtestis.TheABCtransporters arethusfundamentalforthemaintenanceofseveralphysiological functionssuchasprotectionfromtoxic substances,transportof importantmetabolitesandcellsignaling.Attheendothelialcells oftheblood brainbarrier(BBB),thesetransportersare particu-larlyimportanttomaintainthebrainhomeostasisbyregulating thepenetrationofdangeroussubstances butalsooftherapeutic drugsintothebrain;andthus,impacttheirpharmacologyeffects [8].Therefore,thestudyoftheirfunctionand expressioninthe endothelialand epithelialbarriersisnecessary tobetter under-standtheADMEofdrugsandtheirmetabolites.Thequantification ofABCtransportersattheBBBisgenerallyperformedonsamplesof micro-vesselsextractedusingaprotocolwelldescribedbyDauchy etal.[9].Itallowstoobtainasampleenrichedinendothelialcells butpollutedbydifferentcellsorcellularfractionssuchas peri-cytes,astrocytesandneurons[10].Thedetermination ofcertain markers,suchasATPase(a1,a2anda3)enablestoevaluatethe proportionofendothelialcellsinthesampleandbetterquantify the transporters[11]. MS-based absolute quantification of pro-teinsisusuallyperformedbyabottom-upapproach;whichimplies severalpreparationstepswherecaremustbetakenin orderto minimizevariabilityandensurereproducibility.Proteinextraction andfractionationisoftenfollowedbycleaningstepsbefore pro-teindenaturationandenzymatichydrolysis(mostfrequentlywith trypsin).Thesamplesarethenanalyzedbyliquidchromatography coupledtotandemmassspectrometry(LC–MS/MS)inmultiplexed selectedreactionmonitoring(SRM/MRM)toquantifyspecific tar-getpeptides[1,12]asasurrogateoftheprotein.Inordertoachieve anabsolutequantificationinnon-arbitraryunits(e.gpmol·mg−1of proteins),stableisotopelabeled(SIL)internalstandardsareadded tothesampleafterdigestionintheformofsynthetichomologous peptides(AQUAstrategy[12]).
OneofthemajorissuesofMS-basedproteinquantificationisthe lackofuniversalsampletreatmentbecauseofthehighvarietyof
physicochemicalpropertiesofproteins.Inaddition,protocolsoften consistofmultiplesteps,whichincreasetheriskforinter-or intra-assayvariability.Therefore,itisimportanttocarefullyevaluateand validateallthestepsoftheanalysistoachievethedesiredaccuracy andprecision[13].
ThequantificationofmembraneproteinsasATP-binding cas-sette(ABC)transportersattheBBBandotherbarriersisalready describedintheliterature.TheTableS-1summarizesthemajor analyticalfeaturesoftheseveralavailablemethodsinthefieldon P-gpandBcrp.Kamiieetal.[1]developedanAQUAmethodfor thequantificationofmembranetransporterproteins,includingthe selectionofcandidatepeptideprobesandthesensitivityand accu-racyofthemulti-channelMRManalyses.Nevertheless,theydidnot performananalyticalvalidationofthedosagemethodaccordingto theFDAguidelines[13]asPrasadetal.[6]didforthe determina-tionofBCRPintheliverand,independently,forP-gpinthesame tissue[5].Groeretal.[7]andHarwoodetal.[14]alsovalidated analyticallythequantificationofPgpandBCRPinhumanintestine inaccordancewiththeseguidelines.However,theseauthorsdid notvalidateanymembranemarkerproteins(suchasATPAse).
EachstudydescribedinTableS-1usedonlyonepeptideper proteinforthequantificationanddidnottakeintoaccountthat thedigestionefficiencymayvarydependingonthepeptideas dis-cussedbyPrasadetal.[15],whichimpliesthatdigestionprotocol mustbeproven.Inthesestudies,theauthorsuseddigestion proto-colsalreadydescribedintheliterature[1,5,6,14,16],controlledthe digestionthroughtheCVvalueofaQC(<5%)[16]oroptimizedthe protocolbythemselves[7].Zhangetal.[17]suggestedcontrolling theP-gpdigestionthroughtheuseofasurrogatedigestionpeptide intheQCsamplesandHarwoodetal.[14]throughtheQconCAT technique.
Gröeretal.[7]andZhangetal.[17]weretheonlyauthors dis-cussingthematrixeffect.Thefirstdidnotstudyitbecausethey supposedthatmatrixeffectsareofminorimportancebecausethey usedalonggradientelutionandhigh-resolutionchromatography. Zhang et al. [17] discussedthe roleof the internalstandard in theminimizationofthepotentialinconsistencyintheionization bymassspectrometerofanalytesincomplexbiologicalmatrixes. However,mostoftheauthorsmadestandardsandQCsamplesina complexmatrix.Tominimizeapotentialmatrixeffectonthe quan-tification,thesesolutionsshouldbemadeinamatrixidenticalto that ofthesamplestobeassayed.Butthelatteraremembrane extractsthatusuallycomefromhumanoranimaltissuesorcells that are not alwaysavailable in largequantities. To mimic the matrix ofthesamplestheauthorsusedthebufferofthe mem-braneextractionkit[5,6],orsolutionsofpeptidesresultingfrom thedigestionofBSA[7,17]or,morespecificallyforQC, ¨true¨samples (membraneextractionofMDCKorHEK293cells)[16,17]forwhich they knewthe membrane protein concentration and that they spikedwithpeptidestobeassayedatknownconcentrations.None ofthepreviousworkscomparedthematrixeffectthatmayoccur onthedetectionofthepeptidescontainedinthesesolutions(more orlesscomplex)versusthesamepeptidesinaqueoussolution.
Therefore,themainobjectiveinthisworkistodevelopand vali-dateaLC–MS/MSmethodaccordingtotheFDAguideline(released
inMay2018[13])forabsolutequantificationofthemouseandrat membraneproteinsBcrpandP-gp,inadditiontothemembrane marker Na+/K+ ATPase using isoform-specific peptides as cell-markers.Themethodwasusedtodeterminetheexpressionofthese proteinsatthebraincorticalvesselsofratandmouse,andplasma membraneproteinsofmousekidneyandliver.Wehavestudied moreparticularlythreecriticalpointswhichcanmodifythequality ofthequantification.First,weverifiedthatthedigestion proto-colusedwasoptimizedfordigestionofmembraneproteinsafter precipitationwith methanol-chloroform-watersystem.We also studiedtheabsenceofimpactfromahighcomplexmatrixonthe quantificationperformance,thequantificationlinearity,accuracy, precision,LODandLOQdeterminations.Andfinally,westudiedthe peptidestabilityforthewholesampletreatment.Importantly,to improvethequantification,weemployedtwodifferentpeptides forBcrp,threeforP-gpandisoform-specificpeptidesforAtp1a,in additiontoapreviouslyusedmulti-isoformprobepeptide[1].
2. Materialandmethods 2.1. Chemicalsandreagents
Bovineserum albumin(BSA)and dextran(molecularweight 70.000)weresuppliedbySigmaAldrich(SaintQuentinFallavier, France). Protease Inhibitor Cocktail cOmplete Mini® was pro-videdby Roche(Bâle, Switzerland).Sequencing grade Modified Trypsin,MS-graderLys-CandProteaseMAXsurfactantwere pur-chasedatPromega(Charbonnières-les-Bains).Someofthepeptides wereprovidedbyPepscan(Lelystad,TheNetherlands).AllFmoc protectedaminoacids,preloadedWangresinandpeptide synthe-sisreagentswereprovided byNovabiochem® (MerckMillipore, Darmstadt,Germany).15Nand13Clabeled(with98%ofisotopic enrichment) Fmoc-protected amino acids came from Sigma-Aldrich.DMF(dimethylformamide)andpiperidineweresupplied byCarloErbaReagents(ValdeReuil,France).
2.2. Peptidesynthesis
The synthesis of peptides was performed in solid phase by using Fmoc chemistry and Fmoc-amino acid preloaded Wang resin (0.1mmol, 0.6mmol·g−1) on microwave assisted CEM-Liberty1synthesizer,withDIC/Oxymapureascouplingreagents. Fmoc deprotectionwas achieved by20% (V/V) piperidine with 0.1mol·L−1 Oxymapure in DMF. After synthesis, peptides were cleaved from resin witha simultaneous removal of side chain protectionsthroughatreatmentwitha10mLsolutionofTFA con-taining 2.5%water and 2.5%triisopropylsilane (V/V)(TIPS). The resinwasthenfilteredoffandthefiltratewasconcentrated, pre-cipitatedintocolddiethyl esterand collectedbycentrifugation. PeptideswerethenpurifiedonShimadzusemi-preparativeHPLC systembyusingaGRACEVydacProteinandPeptide218TPcolumn (10×250mm)andanalyzedonaShimadzuProminenceLC-20AD HPLCbyusingaGRACEVydacProteinandPeptide218TPcolumn (4.6×250mm),withina linearA–Bgradient(A:0.1% (V/V)TFA aqueous;B:0.09%(V/V)TFAin70%(V/V)acetonitrileaqueous)ata flowrateof2mLmin-1forpurificationand1mLmin-1foranalysis. Puritywasabove99%forallthepeptidessynthetized,exceptfor AAVPDAV[+6]GK(98.7%).Themolecularweightofpeptides was characterizedbyhighresolutionMALDI-TOFmassspectrometer. Thepeptideconcentrationinstandardsolutionswasdetermined byAminoAcidAnalysis(AAA)aftertotalacidhydrolysis.
2.3. Biologicalsamples
2.3.1. Yeastmicrosomalfraction
Yeastmicrosomalfractionwasobtainedbylysingthecellswith anUltraturrax®
(IKA®
-WerkeGmbH&Co.KG,Staufen,Germany) ina250mmol·L−1sucrosebuffer(with20mmol·L−1TrispH7.4and 5.4mmol·L−1EDTA).Afterclarifyingthesamplebycentrifugation (15min.at10,000g,4◦C),themicrosomalfractionwaspelleted by ultracentrifugation (1hat 100,000g, 4◦C) and recovered in 250mmol·L−1sucrosebuffer.
2.3.2. Animals
Male C57BL/6 (10–12 weeks old) mice and male Sprague–Dawleyrats(5–7weeksold),bothprovided byJanvier Labs (Le Genest-Saint-Isle, France) were handledin accordance withtheEuropeanCommunitiesCouncilDirective.Theanimals werehousedinastandard(non-enriched)environmentona 12/12-hlight-dark cyclein atemperature-controlled room(22±1◦C). Foodandwaterwereprovidedadlibitum.Weendeavoredto mini-mizethenumberofanimalsusedandtheirdiscomfort.Theanimals wereanesthetized withKetamine/Xylasine, exsanguinated with physiologicalserumandeuthanizedbydecapitation.Themouse kidneysandbrainswereflashfrozeninliquidnitrogen,whilerat brainsweretreatedfreshly.
2.3.3. PlasmaMembraneProtein(PMP)fractionsofmousekidney andmouseliver
PlasmaMembraneProtein(PMP)fractionsofkidneyandliver wereobtainedaspreviouslydescribed[18]withminor modifica-tions,byusinganUltraturrax®forhomogenizationanddifferential centrifugationwitha38%(W/V)sucrosecushionforPMP enrich-ment.
2.3.4. Mousebraincorticalvessels
Mouse brain cortical vessels were obtained as previously described[9,19]withsomemodifications,whilekeepingthe sam-plesat4◦C.Afterthawingthebrains,thecortexesweredissected andcleanedofwhitematterandthemeninges.5braincortexes werepooledandchoppedinbuffer(HBSSand10mmol·L−1HEPES). The suspension was centrifuged(5min. at 600g, 4◦C) and the pelletwassuspendedinthesamebuffersupplementedbyan enzy-maticmixture.Thesampleswereincubatedat37◦Candpelleted by centrifugation (15min. at 5000g, 4◦C). The pellet was sus-pendedinsuspensionbuffer(HBSSwith10mmol·L-1HEPES)with 17.5%(w/w)dextranandcentrifuged(30min.at4500g)to sep-aratemyelinandothercontaminantsfromthebrainvessels.The supernatantwaseliminated,andthepelletsuspendedin suspen-sionbufferwith1%(w/w)BSA,beforefiltrationbyusinga10m nylonmesh.Theretainedvesselswererecoveredinthesamebuffer andcentrifuged(5min.at600g,4◦C).Thepelletwassuspended in suspensionbufferwithoutBSAand centrifugedagain(5min. at600g).Aftereliminatingthesupernatant,thevesselswere col-lectedinahypotonicbuffer(10mmol·L−1TrispH7.4,10mmol·L−1 NaCl,1.5mmol·L−1MgCl2)supplementedwithproteaseinhibitor cocktail,incubatedfor15minandsonicatedinBioruptor®inhigh modefor5minwithon/offcyclesof30s.Sampleswerecentrifuged (10min.at10,000g,4◦C)andthesupernatantwasrecovered. 2.3.5. Ratbraincorticalmicrovessels
Ratbraincorticalmicrovesselswereisolatedfromfreshtissueas previouslydescribed[19],byusingamechanicalhomogenization. Theprocedurewassimilartothemousevessels,butthe incuba-tionwithenzymeswasreplaced bymechanical disruption.The mincedsampleswerehomogenizedinaPotter–Thomas homog-enizer(KontesGlass,Vineland, NJ,USA) (0.25mmclearance)by using15to20up-and-downstrokesat400rpm.Microvesselswere
isolated by filteringthesamples thougha 100m nylonmesh followedbyasecondfilterof10m.Proteinswereextractedby suspendingthefinalpelletinthehypotonicbuffersupplemented withproteaseinhibitor cocktail,incubatedfor 15minand soni-catedinBioruptor®inhighmodefor5minwithon/offcyclesof 30s.Sampleswerecentrifuged(10min.at10,000g,4◦C)andthe supernatantwasrecovered.
2.4. Proteindigestion
ThetotalproteindeterminationwasperformedbyusingtheBCA ormicro-BCAProteinAssayKits,followingtherecommendations ofthesupplier(Thermo Scientific,Illkirch,France).Theproteins insamplesweredigestedinsolutionaspreviouslydescribed[1,2] withsomemodifications.Briefly,proteinsweredenaturedin dena-turing buffer (7mol·L−1 guanidine hydrochloride, 10mmol·L−1 EDTA,500mmol·L−1TrispH8.5),reducedbyDTT(1.4mmol·L−1) and alkylated by iodoacetamide (2.9mmol·L−1). Proteins were then precipitated by using a methanol-chloroform-water sys-tem. The pellets wereresuspended in 6mol·L−1 ureaand 0.2% (W/V)ProteaseMaxTMdetergent.Aftera10-minuteincubationand agitation at room temperature, thesamples were diluted with 0.1mol·L−1 Trisbuffer(pH 8.5)to afinal ureaconcentrationof 1.4mol·L−1 and0.05%(W/V)ofProteaseMaxTMbeforesonicating foracompleteresuspension.rLysCendoproteasewasaddedtothe samplesinanenzyme-proteinmassratioof1:50anddigestedat roomtemperaturefor3h.Proteinswerethendigestedwithtrypsin (enzyme-proteinmassratio=1:100)byovernightincubation(16h) at37◦C.Thestableisotope-labeled(SIL)peptidemixturewasadded beforestoppingthedigestionbyaddingformicacid.Thesamples weredriedinacentrifugalvacuumconcentrator(Maxi-DryLyo, HetoLabEquipment,Denmark),storedat−80◦Candsolubilized justbeforeanalysis,byusingamixtureof10%(V/V)acetonitrile, 90%(v/v)waterplus0.1%(V/V)formicacid.
2.5. Analysisbyultrahighperformanceliquidchromatographyon linewithtandemmassspectrometry
2.5.1. UHPLCMS/MS
All the Mass Spectrometry analyses were performed on an ACQUITY UPLC H-Class®
System on line with a Waters Xevo®
TQ-Smassspectrometer(Waters,Manchester,UK).5Lofa solu-tionat1gL−1ofproteins(beforetrypsicdigestion)wereinjected on thecolumn. Peptides were separated by using anACQUITY UPLCBEH®
C18column(PeptideBEH®
C18Column,300Å,1.7m, 2.1mmX100mm;Guyancourt,France)ina34mingradientgoing from100%aqueousmobilephase(waterand0.1%formicacid(V/V)) to35%oforganicmobilephase(ACNwith0.1%formicacid(V/V)) inaqueousmobilephase,ataflow-rateof0.5mL/min,at30◦C.
ThemassspectrometerwasoperatedinMRMmodebyusing positiveelectrosprayionization(ESI)withionspraycapillary volt-age at 2.80kV. The resolution of the quadrupoles was 0.75Da (FWHM)aftercalibrationusingortho-phosphoricacid(0.1%)and resolution verification with Sodium Iodide (0.1mgmL−1) and Cesium Iodide (2,5g mL−1) in positive mode (m/z 102.1300, 772.4610, 1372.0379 and 1971.6149), as recommended by the manufacturer (ref. 700005471, Waters, Manchester, UK). After manualoptimization,dryinggasflow-ratewassetto1000L/hwith atemperatureof650◦C.TheAQUAapproach[12]wasusedforthe targetedquantificationofselectedpeptides.Methoddevelopment isdetailedinFig.S-1.Skyline[20]software(version3.1.0.7382) wasusedfortheMRMmethoddevelopment,includingthe colli-sionenergyoptimization,andthepeakintegration.MassLynxv4.1 (Waters,Manchester,UK)wasusedtopilotthemass spectrome-terandinitialinspectionofchromatograms.Collisionenergieswere optimizedbothmanuallyandwiththehelpofSkylineaspreviously
described[21].Briefly,formanualoptimizationastandardsolution ofeachpeptideat100pmol·mL−1wasanalyzedbydirectinfusion whilechangingtheCEuntilhighestsignalintensitywasobtained.In addition,amixofstandardpeptidesat25pmol·mL−1wasanalyzed usingaMRMmethodcreatedbySkylinewith5differentvaluesof CEincludingthepredictedoptimalCE,-6,-3,+3and+6eV.Results wereimportedtoSkylineandtheCEgivingthehighestpeakareafor mostofthetransitionsofapeptidewasselected;obtainingsimilar resultstomanualoptimization(Table1).
2.5.2. Datatreatment
AllthechromatogramswereevaluatedwithSkylinesoftware byusingtheinternalstandardmethodandpeak-arearatiofor cal-culation.QuaSAR[22],integratedasaplugininSkyline,wasused tocalculate thelimit ofdetection (LOD),limit ofquantification (LOQ)andlinearregressionequationsfromthecalibrationcurves foreachtransitionsurveyed(Table2).ThispluginusestheAuDIT [23]algorithmtoevaluatethepresenceofinterferencesby calcu-latinganadjustedp-valueoftheprobabilityofsignalinterferences foreachtransitionaccordingtotherelativeratiosbetweenlight andheavytransitions.Atransitionismarkedas“bad”whenthe combinedp-valueisinferiortoathreshold(10−5)orthe%CVof thelight-to-heavyratiobetweentheinjectionreplicatesishigher thantheacceptedvalue(20%).Transitionsareconsidered“good” whennoneoftheseconditionsaresatisfied,makingthemsuitable forquantification.TheLODiscalculatedbyusingthelight-to-heavy ratioandtakesintoaccounttheestimatedaverageresponse (light-to-heavyratio)valuesofblanksamples,thestandarddeviationof blankandlowconcentrationpointsandthenumberofreplicates [23].LLOQwasthenestimatedas3xLOD.Thecalibrationequations areobtainedfromarobustlinearfitbyusingleastmedianofsquares regression.Thesecalibrationequationswereusedtocalculatethe LODandLOQvaluesinpmol·mL-1units.
Thepeptideabundanceinsamplesandqualitycontrols(QCs) were calculated for each transition of the target peptides by using the calibration equations and home-developed R scripts and thentransformedintofmolperg oftotal protein.Finally, home-developedRscriptswereusedforallsubsequentstatistical evaluations.Reportedexpressionvaluescorrespondtothemean from3or4transitions;exceptforAAVPDAVGKwhichwas quan-tified byusing2 transitions.Thereported accuracy(DEV%)and precision(%CV)werecalculatedbyusingthepeptideabundance fromthetechnicalreplicatesof sampletreatmentforbiological samplesorpeptidemixinganddilutionforthecalibrationcurves andQCs;therefore,thevariabilitybetweenthetransitionsofasame peptideisnotconsidered.
2.6. Developmentoftheabsoluteproteinquantification(AQUA) method
2.6.1. PeptideselectionforAQUAmethod
Theabsoluteproteinquantification(AQUA)[12]ofanalyte pro-teins(Bcrp,P-gpandNa+/K+ATPase)wasperformedbycombining aninsilicopeptideselectionwithanexperimentalvalidation(Fig. S-1).Briefly,thepossibleproteotypicpeptideswereselectedin sil-icobyusingcriteriasuggestedpreviously[1,24](TableS-2),with the help of bioinformatics tools (Table S-3). The Protein Infor-mationResource(PIR)peptidesearch(http://pir.georgetown.edu/ )[25]wasparticularlyusefultoverifypeptidespecificityasit per-formsaquicksearchforthesequencesversustheUniProtKBentries. The peptides selectedare specifictothecorresponding protein homologuesinmouse,ratandhumanproteome;exceptfor pep-tideVGTQFIRfromBcrp,whichisnotpresentintheratprotein. Finally, thetarget peptides for thecontrol proteinand interest proteinswerechosenbyanalyzingproteindigestsbyLC–MS/MS whichusesanunscheduledMRMmethod.Atleast2peptideswere
Table1
Targetpeptides,MRMparametersusedintheUHPLC-MS/MSanalysis.
Protein Peptide Light Heavy FragmentIon CV(V) CE(eV)
N◦ Sequence(light/heavy) Precursorm/z Productm/z Precursorm/z Product
P-gp(a) 1 NTTGALTTR/NTTGALTTR[+10] 467.8 719.4 472.8 729.4 y7 35 16 618.4 628.4 y6 561.3 571.3 y5 490.3 500.3 y4 2 LANDAAQVK/LANDAAQV[+6]K 465.3 816.4 468.3 822.4 y8 35 16 745.4 751.4 y7 631.3 637.4 y6* 516.3 522.3 y5 P-gp(a/b) 3 IATEAIENFR/IATEA[+4]IENFR 582.3 979.5 584.3 983.5 y8 35 21 749.4 753.4 y6 678.4 678.4 y5 Bcrp 1 SSLLDVLAAR/SSLLDVLA[+4]AR 522.8 757.5 524.8 761.5 y7 35 18 644.4 648.4 y6 529.3 533.4 y5 430.3 434.3 y4 2 VGTQFIR/VGTQFIR[+10] 410.7 721.4 415.7 731.4 y6 35 14 664.4 674.4 y5 563.3 573.3 y4 435.3 445.3 y3
Na+/K+ATPaseAtp1a1/2/3 AAVPDAVGK/AAVPDAV[+6]GK 414.2 756.4 417.2 762.4 y8* 35 14
685.4 691.4 y7
586.3 592.3 y6
489.3 495.3 y5*
Na+/K+ATPaseAtp1a1 IVEIPFNSTNK/IVEIPFNSTNK[+8] 631.3 1049.5 635.4 1057.5 y9 35 22
920.5 928.5 y8
807.4 815.4 y7
710.3 718.4 y6*
Na+/K+ATPaseAtp1a2 GIVIATGDR/GIVIATGDR[+10] 451.3 731.4 456.3 741.4 y7 35 16
632.3 642.3 y6
519.3 529.3 y5
448.2 458.2 y4
Na+/K+ATPaseAtp1a3 GVVVATGDR/GVVVA[+4]TGDR 437.2 717.4 439.2 721.4 y7 35 15
618.3 622.3 y6
519.3 523.3 y5
448.2 448.2 y4
selectedandusedforthequantificationofeachproteinincluding
somesequencespreviouslyusedfortheirquantification[1,5,6]and
somenovelsequences(Table1). 2.6.2. Proteindigestionoptimization
Theproteindigestionefficiencywasinvestigatedbyusing kid-neytissue(availableinhigherquantitythanmicrovessels)which wasdigestedfor4h(protocolA),16h(protocolB)and24h (proto-colC)at37◦CwiththereagentquantitiesdescribedinSection2.5; for16hat37◦CwithoutrLysCandtrypsinwithenzyme-protein massratio=1:100(protocolD),for 16hat37◦CwithrLysCand trypsinatverylowconcentration(1:1000insteadof1:100) (proto-colE)orahigherconcentration(1:50insteadof1:100)(protocolF). Proteinlinearizationbyheatingat95◦Cbeforethereductionstep androomtemperature(25◦C)trypsindigestionwerealsotested (protocolGandH,respectively).Ineachcase50gofproteinswere digestedintriplicateandthepeptideabundanceweredetermined forP-gp(a),P-gp(a/b),BcrpandNa+/K+ATPases.
2.7. Validationoftheabsoluteproteinquantification(AQUA) method
Themethodvalidationwasperformedbasedonthe recommen-dationsoftheFoodandDrugsAdministrationBioanalyticalMethod ValidationGuidanceforIndustry[13].
2.7.1. Preparationofcalibrationcurvesandqualitycontrols(QCs) Calibrationcurvesinpure solutionwereprepared inthree dilution replicates at three different days with three different batchesof peptides in a mixtureof 10%(V/V) acetonitrile,90% (V/V) water plus 0.1% (V/V) formic acidby successive dilution
beforeaddinga constantamountofstableisotope-labeled pep-tides. Lightpeptideconcentrations covered a range from 0.125 to 125pmol·mL−1 (0.125, 0.25, 1.25, 2.5, 12.5, 25, 62.5 and 125pmol·mL−1).TwoextrapointswereincludedfortheNa+/K+ ATPasepeptides(300and510pmol·mL−1).Calibrationcurveina complexmatrixwaspreparedasasurrogateofthesampleblank matrix.Thecalibrationpointswerepreparedin triplicate,using the samethree batches of stock standard peptidemixture and internalstandardsasinthepuresolutionbutinacomplex back-groundmatrixconsistingofadigestofmicrosomal-yeastproteins (S.cerevisiae)ataconcentrationof1gofhydrolysateperL (mim-ickingtheconcentrationofsamples).Thefinalconcentrationswere calculated tocover a rangefrom0.195to25pmol·mL−1 (0.195, 0.391,0.781,1.563,3.125,6.25,12.5,25pmol·mL−1).QCsamples werepreparedbyusingadigestofyeastmicrosomalproteins,as explainedabove,infourconcentrations:neartoLLOQ(belowthree timestheLLOQ,seeTables3andS-4),low,mediumandhigh(10, 20and60pmol·mL−1,respectively).Threebatcheswereprepared indifferentdays.
2.7.2. Peptidepurity,standardselectivity
Purityandconcentrationofreferencestandardswasassessed forallthepeptidessynthetizedinourlaboratoryasmentionedin section2.1.
Cross-interferencebetweenlabeledandunlabeledstandards wastestedbyanalyzingzerocalibrators;meaningthemixof heavy-labeledstandardpeptideswithoutlightpeptides,bothinpureand complexmatrix.
Table2
Targetpeptides,MRMparametersusedintheUHPLC-MS/MSanalysis,calibrationequations,R2andmatrixeffectcomparisonofslopes.
Protein:PeptideSequence(light/heavy) FragmentIon CalibrationEquation SlopeMatrixeffect
LowComplexity Highcomplexity
Slope Yintercept R2 Slope Yintercept R2
P-gp(a): NTTGALTTR/NTTGALTTR[+10] y7 0.0612 0.0008 0.9983 0.0587 0.0303 0.9973 −4.0% y6 0.0622 −0.0001 0.9988 0.0581 0.0001 0.9965 −6.5% y5 0.0618 0.0006 0.9990 0.0593 −0.0044 0.9916 −4.0% y4 0.0625 −0.0031 0.9995 0.0584 −0.0004 0.9969 −6.5% P-gp(a): LANDAAQVK/LANDAAQV[+6]K y8 0.0600 0.0014 0.9759 0.0578 −0.0014 0.9968 −3.6% y7 0.0574 0.0023 0.9931 0.0553 0.0008 0.9954 −3.5% y6* 0.0596 −0.0001 0.9968 0.0581 0.0043 0.9944 −2.5% y5 0.0586 0.0004 0.9939 0.0570 0.0018 0.9970 −2.8% P-gp(a/b): IATEAIENFR/IATEA[+4]IENFR y8 0.0594 0.0014 0.9994 0.0590 0.0013 0.9978 −0.8% y6 0.0614 0.0021 0.9992 0.0615 0.0016 0.9979 0.1% y5 0.0607 0.0024 0.9992 0.0589 0.0032 0.9972 −3.0% Bcrp: SSLLDVLAAR/SSLLDVLA[+4]AR y7 0.0709 0.0030 0.9982 0.0687 0.0040 0.9976 −3.1% y6 0.0710 0.0026 0.9985 0.0687 0.0014 0.9968 −3.3% y5 0.0713 0.0027 0.9989 0.0692 0.0019 0.9961 −3.0% y4 0.0709 0.0042 0.9989 0.0701 0.0024 0.9984 −1.0% Bcrp: VGTQFIR/VGTQFIR[+10] y6 0.0597 0.0008 0.9991 0.0540 0.0020 0.9969 −9.5% y5 0.0598 0.0003 0.9988 0.0562 0.0009 0.9951 −6.2% y4 0.0589 0.0021 0.9992 0.0560 0.0011 0.9973 −5.0% y3 0.0589 0.0006 0.9989 0.0564 0.0001 0.9972 −4.3% Atp1a1/2/3: AAVPDAVGK/AAVPDAV[+6]GK y8* 0.1100 −0.0066 0.9934 0.1383 −0.4152 0.9691 25.7% y7 0.1099 0.0026 0.9990 0.1097 −0.0026 0.9938 −0.2% y6 0.1098 0.0049 0.9989 0.1097 0.0012 0.9962 −0.1% y5* 0.1097 −0.0011 0.9890 0.1004 0.1065 0.9810 −8.5% Atp1a1: IVEIPFNSTNK/IVEIPFNSTNK[+8] y9 0.0555 0.0022 0.9948 0.0532 −0.0005 0.9982 −4.0% y8 0.0565 0.0031 0.9940 0.0539 0.0002 0.9957 −4.6% y7 0.0568 0.0019 0.9971 0.0530 0.0000 0.9977 −6.7% y6* 0.0541 0.0040 0.9863 0.0535 −0.0026 0.9908 −1.0% Atp1a2: GIVIATGDR/GIVIATGDR[+10] y7 0.0770 0.0009 0.9996 0.0723 −0.0001 0.9964 −6.1% y6 0.0796 0.0007 0.9997 0.0739 −0.0012 0.9986 −7.2% y5 0.0800 0.0008 0.9996 0.0745 −0.0022 0.9974 −6.8% y4 0.0776 0.0019 0.9991 0.0757 0.0003 0.9969 −2.4% Atp1a3: GVVVATGDR/GVVVA[+4]TGDR y7 0.0606 0.0025 0.9987 0.0584 0.0037 0.9956 −3.6% y6 0.0617 0.0028 0.9981 0.0611 −0.0001 0.9986 −1.0% y5 0.0633 0.0028 0.9986 0.0605 0.0028 0.9971 −4.3% y4 0.0600 0.0025 0.9942 0.0593 0.0048 0.9953 −1.2%
CalibrationequationsandR2wereobtainedfromtheanalysisofacalibrationcurvepreparedintriplicate(eachreplicatewasinjectedonce).Allthepeptidesarecommon betweenthemouseandratproteins,exceptforVGTQFIRwhichisnotpresentinratBcrp.Heavyisotopelabeledresiduesarefollowedbytheirmassshiftinbrackets(rounded tothenearestinteger;e.g.[+10])betweenbrackets(e.g.K[+8]).CV=ConeVoltage;CE=CollisionEnergy;IsotopeType:L=Light,H=Heavy.Thematrixeffect(ME)onslope wascalculatedusingthefollowingequation:ME=(SHC-SLC)/SLC;wereSHC=slopeinhighcomplexitymatrixandSLC=slopeinlowcomplexitymatrix.*:theseionswere notusedforquantificationduetopossibleinterferences.
Table3
Lowerlimitofdetection(LOD)andlowerlimitofquantification(LOQ)asdeterminedinlowandhighcomplexitymatrices.ValuesareinpmolmL−1.
Protein Peptide Conc.inLLOQQCs Lowcomplexitymatrix Highcomplexitymatrix RatioLOQHigh/Low
N◦ Sequence LOD LOQ LOD LOQ
P-gp(a) p1 NTTGALTTR 3 0.125 0.275 0.205 1.65 6.0 P-gp(a) p2 LANDAAQVK 2 0.085 0.334 0.292 1.02 3.1 P-gp(a/b) p3 IATEAIENFR 2 0.053 0.207 0.214 0.752 3.6 Bcrp p1 SSLLDVLAAR 1.5 0.117 0.468 0.227 0.751 1.6 Bcrp p2 VGTQFIR 1 0.086 0.285 0.164 0.567 2.0 Na+/K+ATPase Atp1a1/2/3 AAVPDAVGK 8 1.07 3.31 0.318 0.976 0.3 Atp1a1 IVEIPFNSTNK 1.5 0.598 1.86 0.270 0.817 0.4 Atp1a2 GIVIATGDR 1.5 0.047 0.158 0.261 0.750 4.8 Atp1a3 GVVVATGDR 2 0.078 0.316 0.290 0.961 3.0
2.7.3. Calibrationcurvelinearity,limitofdetection(LOD)and
limitofquantification(LOQ)
Thelinear equation,limit of detection(LOD)and limitof
quantification (LOQ) wereobtainedfrom theanalysisof three
batchesofcalibrationcurvesinpuresolutionandcomplexmatrix
analyzedseparately(singleinjection).Thevalueswereobtained
usingQuaSAR[29]asexplainedinsection2.5.
2.7.4. Accuracyandprecision
Accuracyis expressedasthedeviationtothenominalvalue (%DEV)andprecisionasthepercentofcoefficientofvariation(%CV).
Accuracyandprecisionofthecalibrationcurveswereevaluated bothinpureandcomplexmatrices.Within-runaccuracyand pre-cisionwerecalculatedbyanalyzingintriplicatethefourlevelsof QCsincomplexmatrixandonebatchofcalibrationcurvepointsin puresolution.Betweenrunaccuracyandprecisionwasassessed byanalyzingthethreebatchesoflow,mediumandhighQCsamples onthreedifferentdays.
2.7.5. Matrixeffect
Theabsenceofimpactfromthecomplexmatrixonthe quan-tification performance was evaluated by comparing the slope,
Fig.1.Comparisonofdigestionprotocolsperpeptide.Measuredexpressionvaluesweredividedbythecontrolprotocol(standardprotocol)with16hofdigestion)toobtain arelativedigestionefficiency.Thegraydashed-lineindicatesanefficiencyof1(thestandardprotocol).BLQ=belowthelimitofquantification.Significantdifferencesmarked byasterisksforp-valuelowerthan0.05(*),0.01(**)and0.001(***)werestudiedusinglog10abundancevaluestofittoanormaldistribution(t-testwithBonferroni’s correction).
accuracyandprecisionbetweenthepureandcomplexmatrices. Thevaluesfromtheyeasthydrolysateshouldbetterrepresentthe limitsoftheanalyticalmethodinthebiologicalsamples.
2.7.6. Peptidestability
Freeze-thawstabilitywastestedbyusingthestocksolution containingthemixofstandardpeptides.Individualpeptidestock solutionsareallstoredat−80◦Cin100Laliquot.When calibra-tionrangewasprepared,thesesolutionswerethawedandmixedto obtainastocksolutioncontainingeachpeptideattheconcentration of250pmol·mL−1.Thisstocksolutioncouldberefrozenandthawed forfurtherhandling.Therefore,itsstabilitywasevaluatedafter1, 2,4and6cyclesoffreezingandthawingwith3daysintervals.
The stability of thepeptides after several cyclesof thawing thesampleshasnotbeentestedbecause,inthisstudy,wenever reinjecteda sampleafterjustoneorseveralfreeze/thawcycles. Similarly,wheninternalstandardsorcalibratorsareprepared,they arealiquotedinsingleusevolumes.
Sampleprocessing(digestion)stabilitywasevaluatedby spik-ing the yeast microsome fraction with light standard peptides eitherbeforeorafterovernightincubation withtrypsin(16hat 37◦C)duringthe proteindigestionprocedure. The SILpeptides wereaddedaftertheincubationandsamplesweredriedand ana-lyzedasexplainedabove.
Autosamplerstabilityduringtheanalysis(i.e.at4◦C)was eval-uated for3 typesofsamples: calibrationcurve points,QCsand mousekidneyplasmamembraneproteins.Twodifferentbatchesof calibrationcurveswereinjectedtwicewithanintervalof approx-imately30hbetweenthefirstandthesecondanalysis.EachQC(3
levelsfrom3differentbatches)orproteindigestsample(in tripli-cateofdigestion)wasinjectedthreetimes:atthebeginningofthe analysisseries,45hlaterand75hlater.
3. Resultsanddiscussion 3.1. Methoddevelopment
3.1.1. PeptideselectionforAQUAmethodandCEoptimization Theselection ofpeptidesfor proteinquantificationwas per-formedinsilicofollowingcriteriapreviouslysuggestedbyKamiie et al. [1] and enriched with suggestions from Ludwig and Aeberesold[24](TableS-2).Theuseofseveralbioinformatictools (Table S-3)allowedustoselectthesurrogatepeptides.ThePIR PeptideSearchwasparticularlyusefulfortheselectionof protein-specificpeptidesthatarepresentinthehomologuesofP-gp,Bcrp andtheNa+/K+ATPasepump(Atp1a1,2and3)frommouse,ratand humanandotherspeciesofinterestforpre-clinicalanalysis(Table S-5).Skyline[20]wasusedforchromatograminspectionanddata treatment.Thisstate-of-the-artsoftwarefacilitatedthe develop-ment,validationandanalysisoftargetedproteomicsexperiments. Collisionenergywasoptimizedbothmanuallyandwiththehelp ofSkyline[21]asexplainedinsection2.6.1.TheoptimalCE corre-spondedtotheonepredictedbythesoftwareor3eVbelowforall thepeptidesasshowninFig.S-2.
3.1.2. Proteindigestionoptimization
Fig. 1 shows the relative digestion efficiency calculated by normalizingagainstthestandardprotocolwith16hofdigestion
(protocolB).Atp1a2andAtp1a3peptidesarenotincludedbecause theseprotein isoformsarenot expressedinmouse kidney[26] and thus werenot detected. Significantdifferences were stud-iedusinglog10abundancevaluestofittoanormaldistribution (t-testwithBonferroni’scorrection).Threereplicatesofeach pro-tocol wereevaluated andthus someapparentdifferences were notstatisticallysignificant;nevertheless,thisexperimentallowed thedetectionofcriticalparametersonthesampletreatment. P-gppeptideNTTGALTTRpresentsahighLLOQandwasBLQinall thesamples.P-gppeptidesLANDAAQVKandIATEAIENFRwerenot detectedwhenLysCwasnotused(protocolD),whentrypsinwas usedatverylowconcentration(1:1000;protocolE),aftersample heatingat95◦Cfor5min(protocolG)orroomtemperature(25◦C) digestion(protocolH).Thedifferencesindigestionefficiencywere significantforAAVPDAVG(Atp1a1,2,3)andIVEIPFNSTNK(Atp1a1) byusinglowconcentrationoftrypsin(protocolE)orheatingthe proteins (protocolG), and for VGTQFIR (Bcrp) in this last pro-tocol. There were nosignificant differences in thedigestion of all the proteins by using protocols A, B and C with LysC and trypsin(enzyme-proteinmassratio=1:100;416and24h diges-tion,respectively);neitherwithprotocolFwheretrypsin-protein ratiowasof1:50.Althoughatrypsin-to-proteinratioof1:50to 1:20isoftenusedinproteindigestion,ourresultsindicatedthat the1:100ratioisenoughforcompleteproteindigestionafter pre-digestionwithLysCinaccordancetopreviouslyreportedprotocols fortargetedproteomicsofABCtransporters[1]andotherproteins [27].TherecoveryofP-gppeptideswasespeciallysensibletoall theconditionspossiblyduetoitslowabundanceinmousekidney. Inaddition,ABCtransportersandothermembraneproteinssuch astheNa+/K+ATpasepumpareheat-sensibleascanbeobserved intheresultsfromprotocolG(speciallyforP-gp).Someprotocols usea95◦Cincubationtohelplinearizetheproteinsfordigestion, butthisshouldbeavoidedwhenquantifyingmembraneproteins. Otherprotocolsperformthetrypsindigestionunderroom tem-peraturetoavoiddegradation,butthishasproveninsufficientfor P-gpenzymatichydrolysis.Consequently,LysCandtrypsinwith enzyme-proteinmassratio=1:100areadequateandnecessaryto obtainacompletedigestionofproteinsat37◦Cfor16h.
3.2. Methodvalidation
Severalnationalorinternationalagencieshaveprovided reg-ulatory guides for the validation of LC–MS based methods for thequantificationofdrugsandmetabolitesinpharmacokinetics studies,buttheydonot directlydeal withthequantificationof endogenousproteinsorbiomarkers.Onlytherecentlypublished BioanalyticalMethodValidationGuidancefor Industryfromthe AmericanFoodandDrugsAdministration(FDA)[13]mentionthat itcanbeextendedtotheevaluationofproteinbiomarkerlevels inbiologicalmatrices.Therefore,weusedthisguidefortheAQUA methodvalidation.
TheFDA guidestatesthat thecalibrationrange and theQCs shouldbemadeinthesamematrixasthesamples.However,we donothaveaproteinsamplefrommicro-vesselsthatdoesnot con-taintheproteinstobeassayed.Someauthorshavesubstitutedthe matrixbydifferentsolutions.Jietal.[28]usedthemembrane pro-teinfractionofwild-typeHEKcellsastheblankmatrixtoprepare standard solutionand themembranefractionof controlmouse livertissuefortheQCsamples;Zhangetal[23]andGröeretal. [8],solutionsofpeptidesresultingfromthedigestionofBSAfor standardandQC.ThepreparationofstandardsolutionandQCina hydrolysateofbrainmicro-vesselsproteinsisimpossiblefor ethi-calreasonsbecausemanyanimalswouldhavetobesacrificedfor thematrixpreparation.Inaddition,thesamplewithouttheanalyte proteinsisnotavailable.Therefore,wetestedthelinearity, accu-racy,precisionandstabilityforalltargetpeptidesnotonlyinthe
lowcomplexitysolution(calibrationcurvespreparedin10%(V/V) acetonitrile,90%(V/V)water+0.1%(V/V)FormicAcid)butalsoin yeastmicrosomalproteinstotesttheeffectofacomplexmatrix inthequalityofthequantitativemethod.Weusedyeast microso-malproteinsbecauseitcontainsahighvarietyofproteinsandits complexitycanbecomparedtooursamplesofinterest.Moreover, yeastproteinscanbeobtainedatacheappriceandthedigestionof theseproteinsdoesnotproduceanypeptidesredundantwithour targetpeptides.
3.2.1. Peptidepurity,standardselectivity
Thepurityofallthepeptidesusedwasabove99%,exceptfor AAVPDAV[+6]GK(98.7%)(Fig.S-3).Theconcentrationofthestock solutionswasdeterminedbyAAA(TableS-6).Theisotope enrich-mentofheavylabeledstandardsusedforthesynthesiswasabove 98%tominimizecross-contaminationtounlabeledpeptides.
Thereislessthan1%ofinterference(ratioof0.01)foralmost allthepeptidesbothinthepureandcomplexmatrices,although higherinterferencesareobservedinthesamplespreparedonYeast hydrolysate.PeptidesAAVPDAV[+6]GK(ATP1a1/2/3)and IVEIPFN-STNK[+8] (Atp1a1) showslightly higher interferences, but they are still below the FDA acceptance criteria of 5%. Thus, cross-interference between labeled and unlabeled peptides (isotopic effects)arenegligible.Inaddition,thesignalsatthelight transi-tionsforpeptideswitham/zdifference>2donotco-elutewith theheavy-standardsignal(Figs.S-4andS-5)anddonothavethe samerelativeintensity;thus,thesignalobservedcouldbedueto backgroundnoiseinsteadofcross-interference.
3.2.2. Calibrationcurvelinearity
Eachpeptidewasquantifiedbysurveyingfourdifferent frag-mentsfromthe[M+2H]++precursorasMRMtransitions(Table1). Sometransitionsturnedouttobenoisyandwerethenusedonly forpeptideidentificationregardingtheircoelutionwiththeother transitions.Nevertheless,threetofourtransitionswereusedfor thequantificationofeachpeptide,exceptforAtp1a1/2/3 (AAVP-DAVGK)withonlytwo.Inordertoimprovethequantification,the averagepeptideabundanceswereobtainedthroughtheaverage valuesobtainedforitstransitions,whichhada%CVlowerthan15 inmostcases.
AlmostallthetransitionsevaluatedgaveR2valuesabove0.99 bothinthepureandcomplexmatrices(Table2), provinga cor-rectlinearfit;therebyshowingthattargetpeptidesaresuitable forquantification.Fig.2bshowsthechromatogramobtainedafter injectionofstandardsolutionsat12.5pmol·mL−1 inamixtureof 10%(v/v)acetonitrile,90%(v/v)waterplus0.1%(v/v)formicacid (Fig.2aandb)andinyeastproteindigest(Fig.2eandf).
3.2.3. Limitofdetection(LOD),limitofquantification(LOQ) Limitsofdetection(LOD)andquantification(LOQ)foreach tran-sition(TableS-4)wereobtainedfromcalibrationcurvesprepared eitherinpuresolutionorinyeastmicrosomalproteindigest.The highestvalueswereconsideredastheLODandLOQatthepeptide level,whicharepresentedinTable3.Itiswellknownthatcoeluting substancescanhaveamajoreffectintheionizationanddetectionof targetpeptides;therefore,itisnotsurprisingthatthequantification limitsarehigherintheyeastdigestmatrixthanthepuresolution formostofthepeptides.Furthermore,thedifferencebetweenthe highandlow complexitymatrixwasdifferentfor eachpeptide, fromaratioof0.3(AAVPDAVGK)to6(NTTGALTTR,P-gp(a)).This highlightsthateachpeptidecanbesubmittedtodifferentmatrix factorsaccordingtoitsretentiontime.Therefore,careshouldbe takenwheninterpretinglimitsofquantificationfromcalibration curvespreparedinpuresolution.Thus,theLOQvaluesobtained fromtheyeastdigestwereusedinotherexperimentsinorderto consideranestimationofthebackgroundnoiseofacomplex
bio-Fig.2.ChromatogramsobtainedfromtheMRManalysisofstandardsolutionsinlowcomplexitymatrix(left:a,b,c,d)andcomplexmatrix(right:e,f,g,h).Fromtopto bottomareshown:Internalstandardheavypeptidesexample(a,e),unlabeledstandardscalibratorsatconcentration12.5pmol·mL−1(b,f),nearLLOQ(c,g)andnearLOD(d, h).
logicalsample.Fig.2showsexamplesofchromatogramsfromthe injectionofcalibrationpointsneartotheLLOQandLODofmostof thepeptidesfromcurvespreparedinamixtureof10%(V/V) ace-tonitrile,90%(V/V)waterplus0.1%(V/V)formicacid(Fig.2candd) orinyeastproteindigest(Fig.2gandh).Thisstudyhighlightsthe impactofmatrixonthebackgroundnoise,muchhigherinFig.2g andhthaninFig.2candd.
3.2.4. Accuracyandprecision
AccordingtotheFDAguidanceforbioanalyticalmethod vali-dation,thecalculatedconcentrationofQCsandcalibrationpoints ofbioanalyticalmethodshouldhaveaprecisioninferiorto15%CV andaccuracyshouldbewithin15%ofthenominalconcentration, exceptfortheLLOQpointswherethethresholdissetto20%.At least75%ofthecalibratorpointsand67%oftheQCsshouldsatisfy thesecriteriaforalltheanalytes[13].
Inadditiontothecalibrationcurves,fourlevelsofQCswere ana-lyzedasproposedbytheFDAguidance.TheQCsclosetoLLOQwere preparedwithspecificconcentrationsofeachpeptide(seeTable3) within3-foldtheLLOQinyeast;exceptfortheAtp1a1/2/3 surro-gate.ThispeptidehasaconsiderablyhigherLLOQinpuresolution andtheconcentrationwassetto8becauseitisexpectedinhigh abundancelevelsinoursamples.
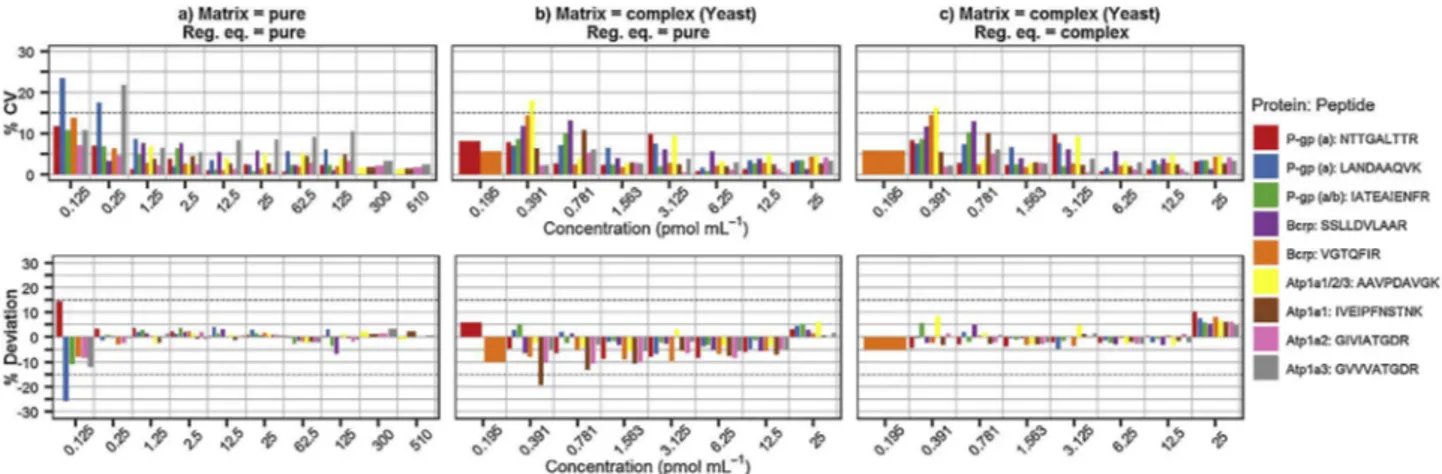
Accuracy and precision of the calibration curves were evaluatedbothinpureandcomplexmatrices.Theestimated con-centration inboth matrices wascalculated using theequations obtainedfromthepurecalibrationcurve(Fig.3aandb),butthe valuesfortheyeastcalibratorswerealsoobtainedusingtheirown equations(Fig.3c)tocomparethevaluesasanothermeasureofthe matrixeffect(Section3.2.4).Inouranalysis,allcalibrationpoints abovetheLLOQpresentedanerrorandprecisionbelowthe thresh-oldof15%,bothinthepure(Fig.3a)andcomplex(Fig.3c)matrices forallthetargetpeptides.
Within-runaccuracyandprecisionwereevaluatedusingQCs fromyeasthydrolysate.TheQualityControlsamples(QCs)(Fig.4a) alsopresentedaverylow%CV,below5%forallthepeptidesexcept for theAtp1a3 surrogateathighconcentration levels,but they
wereallbelow15%.Nevertheless,ahigheraccuracydeviationwas generallyobserved;probablyasaresultofthematrixeffecton ion-izationorinterferences(i.e.coelutingmolecules).Almostallthe peptidespresentedadeviationbelowthethresholdof15%andonly theLowQCsofLANDAAQVK(P-gp)andAAVPDAVGK(Atp1a1/2/3) werebetween15and25%.Theseresultsconfirmthatthis analyti-calmethodallowspeptidequantificationwithasatisfyingaccuracy andprecision.Inaddition,as3differentreplicatesofpeptidemix anddilutionwereused,thisindicatesthattherewasalow inter-batchvariability.
Between-runsaccuracyandprecisionwerecalculatedfrom theanalysisthreedifferentdaysofthreebatchesoflow,medium andhighQCsamples.Weobserveda%CVand%Deviationbelow 15%forallthepeptides(Fig.4b).
3.2.5. Matrixeffect
Itiswellknownthatotheranalytesinthesamplecaninterfere withthequantificationintheanalytesduetodifferentfactorssuch asionizationcompetitionorinterference,whicharesummarized asthematrixeffect.TheFDAguidancementionsthatthereshould notbeamatrixeffectinthequantificationofbiomarkers,butdonot giveclearinstructionstomeasurethis[13].Consideringthatitis notpossibletoobtainenoughmicro-vesselssamplestostudythis, weusedyeastproteinhydrolysatetomimicthematrix.The cali-brationpointswerepreparedusingthesamethreebatchesofstock standardpeptidemixtureandinternalstandardstoavoidbiasdue topreparation.AsdetailedinSection3.2.3,wegenerallyobserved ahigherLOQinthecomplexmatrix.Inaddition,wecomparedthe impactonthecalibrationequationslope(Table2)andobserveda generaldecreaseinthecomplexmatrixslope,goingfrom0to-5% in70%ofthetransitions.Similarly,thedeviationofthe concentra-tioninthecomplexmatrixcalibratorsestimatedwiththeequation frompurecalibrators(Fig.3b)waswiderthanwhentheequation fromthesamematrixwasused,althoughstillwithinthelimitsof 15%.Theprecisionvaluesaremoreindependentfromthe equa-tionusedandthevaluesinFig.3bandcaresimilarandbelow15% forthenonLLOQcalibrators.AlthoughtheFDAguidancedoesnot
Fig.3. Precision(%CV)andaccuracy(%Deviation)forcalibrators.Calibrationcurveswerepreparedinlowcomplexitymatrix(a)(90%water,10%ACN+0.1%formicacid)and highcomplexitymatrix(b,c)(yeastdigest).Concentrationvalueswereestimatedusingtheequationsfromeitherthelowcomplexitymatrix(a,b)orthehighcomplexity (c).
Fig.4. Precision(%CV)andaccuracy(%Deviation)forQCs.Threebatchesofqualitycontrol(QC)sampleswerepreparedinhighcomplexitymatrix(yeastdigest)infour concentrations:neartoLLOQ(below3-fold),10,20and60pmol·mL−1.ThefourQClevelswereanalyzedthreetimesthesamedayforwithin-runevaluation(a)andinthree
separatedaysforbetween-runevaluation(b)(LLOQ-nearwasnotincluded).
establishatolerancethresholdformatrixeffect,weconsiderthat valuesbelow15%andtheconservationoftheaccuracyalsobelow thisvalueshouldminimizetheimpactonthequantification. There-fore,weusedthecalibrationcurvepreparedinpuresolutionfor quantificationofsamples,tomakethemethodsimpler.
3.2.6. Peptidestability
Freeze-thawstabilitywasprovenforallthepeptides,asthey presentedarecoveryof98.5–100%aftersixfreezing/thawingcycles asshowninTableS-7.
Peptidestabilityduringdigestionwasstudiedinyeast pro-teinsamplesspikedwiththestandardlightpeptidesbeforeorafter thedigestion(TableS-8).Mostofthepeptidesusedinthepresent
studydidnotshowasignificantlydifferentpeptideamount(t-test onlog10abundancevalues,p-value>0.05).OnlyVGTQFIR(Bcrp) presented a significantly lowerconcentration (p-value=0.0109) whenthepeptidesfollowedthedigestionincubation, represent-ingaslightdegradation(-9%).Nevertheless,thesedifferencesare withintheacceptederrormargins(<20%)[13].Theseresults sug-gestthatthetargetpeptidesselectedaresufficientlystableinthe trypsinationconditionsused(16hat37◦C),indicatingthusthatthis quantificationshouldnotpresentbiasduetopeptidedegradation atthisstep.
Stabilityinautosampler(4◦C)wasevaluatedbyreinjectingall thecalibrationpoints30hafterthefirstanalysisandtheQC lev-elsafter45and75h(TableS9withoutobservinganydifference
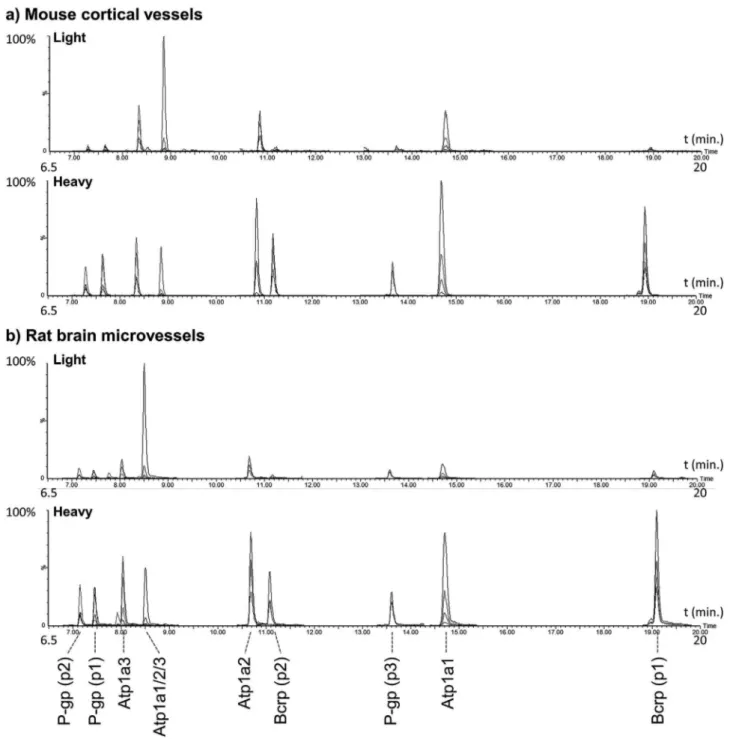
Fig.5.ChromatogramsobtainedfromtheMRMofratbrainmicrovessels(a)andmousemicrovessels(b).
Table4
TargetedabsolutequantificationbyLC–MS/MS(MRM)ofthesurrogatepeptidesfromtheendogenousproteinsBcrp,PgpandNa+/K+ATPaseinmouseandrattissues.
Protein Peptide Proteinamountperpeptide(fmolg−1±s.d.)
N◦ Sequence Mouse-kidney (PMP) MouseLiver (PMP) MouseCortical Vessels(WL) RatCortical Microvessels(WL) P-gp(a) 1 NTTGALTTR BLQ(<1.64) BLQ(<1.64) BLQ(<1.64) 15.3 ±0.21 P-gp(a) 2 LANDAAQVK 1.02 ±0.02 BLQ(<1.02) 1.22 ±0.10 23.8 ±0.32 P-gp(a/b) 3 IATEAIENFR 1.59 ±0.00 BLQ(<0.752) 1.04 ±0.09 17.9 ±0.07 Bcrp 1 SSLLDVLAAR 30.6 ±1.32 1.49 ±0.11 BLQ(<0.751) 0.854 ±0.00 Bcrp 2 VGTQFIR 28.4 ±1.33 1.35 ±0.06 BLQ(<0.567) BLQ(<0.567) Atp1a1/2/3 0 AAVPDAVGK 150 ±3.32 16.4 ±0.01 32.8 ±3.39 213 ±2.90 Atp1a1 0 IVEIPFNSTNK 134 ±3.82 11.1 ±0.40 5.06 ±0.34 32.9 ±0.54 Atp1a2 0 GIVIATGDR BLQ(<0.75) BLQ(<0.75) 3.49 ±0.05 22.1 ±1.13 Atp1a3 0 GVVVATGDR BLQ(<0.961) BLQ(<0.961) 11.3 ±0.52 68.1 ±3.07
Thevaluespresentedwerecalculatedasthemean(±sd.)oftwodigestionreplicates,eachsurveyedwith3or4MRMtransitions;exceptforAAVPDAVGK,thatwasquantified usingonly2transitions.Valuesbelowthelimitofquantification(BLQ)weredeterminedusingtheLOQsobtainedfromtheyeastdigestmatrix(showninparenthesis). VGTQFIRisnotpresentintheratBcrpsequenceandwasnotdetected(ND)inthesesamples.PMP=plasmamembraneproteins,WL=wholelysate.
neitherinthelight-to-heavypeptideratiolevelnorwhen
quantifi-cationwasperformed.Similarly,mousekidneyPMPdigests(n=3)
spikedwiththeheavypeptideswereinjectedthreetimestoverify
thepeptidestabilityinsampleafter45and75h(TableS-10).No
differencewasseeninthelight-toheavyratioorthedetermined
abundanceforanyofthepeptidesquantifiedinmouse.Thus,our
methodallowsthepeptidequantificationwithoutsignificantbias
forlargesamplesets.Inanycase,QCsshouldbeinjectedatdifferent
timesoftheanalysistochecktheaccuracyandprecision.
3.3. Applicationofthemethod-AQUAquantificationofP-gp,
BcrpandNa+/K+ATPase
Thedeveloppedandvalidatedmethodwasusedtoquantity
P-gp,BcrpandNa+/K+ATPase␣-subunit(Atp1a)isoformsinmouse
kidney,mousecorticalvesselsandratcorticalmicrovessels.Fig.5
showchromatogammsobtainedafter5Linjectionofsamples.The resultsoftheMRMpeptidequantificationinthesamplesare pre-sentedinTable4(valuespertransitionarepresentedinTableS-11). Thequantitativevalueswerecalculatedasthemean(±s.d.)of6 to8analyticalmeasuresfrom3to4MRMtransitions(exceptfor AAVPDAVGK,quantifiedwith2transitions)detectedin2digestion replicates;thereforetheydonottakeintoaccountbiological vari-ability.Thevariabilitybetweenthetransitions waslowforeach sample;presentinggenerallyCVsbellow20%.Noisiytransitions thatelevetadtheCVwerenottakenintoaccountforthe quantifi-cationofthesample(TableS-11).
InSprague–Dawley(SD)ratcortocialmicrovessels,the abun-dance of the IATEAIENFR and NTTGALTTR peptides were only slighlty different, 17.9±0.07 and 15.3+0.21fmol·g−1, respec-tively.Thesevaluesarecomparabletothosepreviouslyobtained by Hoshi et al. [2]. in SD and Wistar rat brain (19.0±2.0 and 24.9±1.1fmol·g−1 respectively)usingtheNTTGALTTRpeptide. Nevertheless,weobserved a1.5-foldhigherabundanceof LAN-DAAQVK(23.8±0.32fmol·g−1),whichcouldbeduetodifferences inthedigestionreleaseofthepeptide.Themousecorticalvessels presented aP-gp abundanceof 1.22±0.10 and1.04±0.09 with LANDAAQVKandIATEAIENFR,respectively,whileNTTGALTTRwas BLQ.Theabundanceswereconsiderablylowerthaninratcortical microvessels,probablybecauseofthepresenceofdifferencesin vesselsisolationmethod.P-gpinplasmamembraneofddymice renalcortex,renalmedullaandliverwasbelowthelimitsof quan-tificationinthestudyofKamiieetal.usingthepeptidesNTTGALTTR and ATVSASHIIR.WealsoobtainedBLQvaluesinC57BL/6 mice liverPMPwiththethreepeptides,probablybecauseitisexpressed in very low levels [1]. In mousekidney PMPwe also obtained BLQ values using NTTGALTTR, but the more sensitivepeptides LANDAAQVKandIATEAIENFRhadabundancesof1.02±0.02and 1.59±0.00fmol·g−1,respectively.
These inter-peptide abundances differences observed could be due to isoformsor differences in digestion release. Indeed, IATEAIENFRispresentinthetwoP-gpisoformsofP-gp(Abcb1a andb)expressedinrodents.Inratkidneyandliverbothisoforms arefound[29]anditcouldbeexpectedthattheisoformspecificity inmouseshouldbesimilar;thusthe0.57fmol·g-1higher abun-danceinIATEAIENFRcouldrepresenttheMdr1bisoform.Thisdo notexplainthedifferencesinratcorticalmicrovesselsandmouse corticalvessels,asithasbeenfoundinratcorticalmicrovesselsis almostexclusivelytheAbcb1aisoform[19].Therefore,the1.3-fold higherlevelsofLANDAAQVKthanIATEAIENFR(inbothanimals) and1.5-foldhigherthanNTTGALTTR(inrat)couldbedueto dif-ferentdigestionreleaseofthepeptides,aspreviouslysuggested [15].
BcrpwasBLQinmousecorticalvessels,butinSDratcortical microvesselstheabundanceofSSLLDVLAARwas0.854fmol·g−1. This waslower than measuredby Kamiee et al.[1] (using the
samepeptide),whichcanbeexplainedbyapossible heterogene-ityofthesamplebetweenthetwostudies.IndeedBcrpunlikePgp isexpressedindifferentcellsofthebrainsuchaspericytesand astrocytes [30].Theanalyzed samplesinthetwostudiesmight not havethe samecellcomposition andsooverexpressed Bcrp inKamiieetal.study.TheabundanceofSSLLDVLAARand VGTQ-FIRinmousekidneywere30.6±1.32and28.4±1.33fmol·g-1, whichissimilarmagnitudestolevelsobtainedbyKamiieetal.[1] (56.4±1.82and25.9±1.35fmol·g-1inrenalcortexandmedulla, respectively).Inmouseliverweobtainedabundancesof1.49±0.11 and1.35±0.06fmol·g−1.Inthesetissues,thelevelsofbothBcrp peptideswereverysimilar;althoughtheslightlylowervaluefor VGTQFIRcouldbeduetoslightdegradation,asshowninthe diges-tionstabilitysection.Inageneralway,P-gpwasfoundinhigher levelsthanBcrpintherodentscorticalvesselswhileinmouse kid-neyitisthecontraryasBcrpisalmost30-foldmoreexpressedthan P-gp.
Na+/K+ATPase␣-subunit(ATp1a)wasquantifiedasamarker oftheplasmamembrane.Thepreviouslyreportedpeptide AAVP-DAVGK[1]commontoisoformsa1,a2anda3wasusedforthe quantificationasamulti-isoformprobe,butwealsoselected pep-tidesspecificforeachoneoftheseisoforms.Thea1-isoformpeptide (IVEIPFNSTNK) wasdetectedinallthetissuesanalysed, butthe a2anda3peptides(GIVIATGDRandGVVVATGDR)werequantified onlyinbraincorticalvessels.Thisisinaccordancewithprevious studieswhichshowedthatrodentliverandkidneyexpressalmost exclusivelythea1isoformwhileinnervoustisues thea3isthe major isoformand a2can alsobefound[26]. Interestingly,we observedthatthea3amountis2-foldhigherthana1and3-fold higherthana2inmousecorticalvesselsandratcortical microves-sels.Inthesesamples,thetotalamountofatpa1,a2anda3peptides correspondto60% oftheamountof AAVPDAVGK;which could beduetodifferentdigestionrelease,butmorestudiesshouldbe performedtoverifythishypothesis.
Theabundancedifferencesbetweenpeptidesofasameprotein thatweobservedpointouttheimportanceoftheselectionof sur-rogatepeptidesforLC–MS/MSproteinquantification,asdifferent probesmaybiastheresults.Therefore,wheneverpossible,several peptideprobesshouldbeusedforthequantificationofeach pro-teintoincreasethecertaintyonthemeasuredvalues.Inaddition, itisadvisabletousethesamepeptideprobeswhenproteinlevels arecomparedbetweensamplesorexperimentalconditions.
4. Conclusion
WedevelopedamethodforthequantificationofP-gp,Bcrpand Na+/K+ATPase␣-subunitisoformsattheBBBbyLC–MS/MS(MRM) usingtheAQUAstrategywithseveralpeptidesperprotein.Allthe assayshavebeencomprehensivelyvalidatedintermsoflinearity, accuracy,precision,digestionefficiencyandpeptidestability.This methodwassuccessfullyappliedtothedeterminationofproteins inratmousekidney,mousecorticalvesselsandratcorticalmicro vessels. Thedifferentlevelsobtainedforeach peptidehighlight theimportanceanddifficultyofchoosingsurrogatepeptidesfor proteinquantification.
Authorcontributions
DGZ,PS,MV,MP,IB,ICG,JMS,YP,XDandMCMparticipatedin researchdesign.DGZ,MT,MS,WQ,CC,MP,ETandMCMperformed experiments.DGZdevelopedthequantitativeMSmethod.DGZand MCMperformeddataanalysis.ThemanuscriptwaswrittenbyDGZ andMCMwithcontributionsandapprobationfromallauthors.
Acknowledgements
ThisworkwaspartlyfinancedbyServierLaboratories(Orléans, France).TheauthorswouldliketoacknowledgeStéphanie Chas-seigneauxforherhelpinthepreparationofmousecorticalvessels, CatarinaChavesforkindlyprovidingusratcorticalmicrovessels proteinsandFranc¸ois Guillonneauofproteomicsplatform(3P5, ParisDescartesUniversity)forMALDIspectra.
AppendixA. Supplementarydata
Supplementarymaterial relatedto this articlecanbe found, intheonlineversion,atdoi:https://doi.org/10.1016/j.jpba.2018.11. 013.
References
[1]J.Kamiie,S.Ohtsuki,R.Iwase,K.Ohmine,Y.Katsukura,K.Yanai,Y.Sekine,Y. Uchida,S.Ito,T.Terasaki,Quantitativeatlasofmembranetransporter proteins:developmentandapplicationofahighlysensitivesimultaneous LC/MS/MSmethodcombinedwithnovelin-silicopeptideselectioncriteria, Pharm.Res.25(2008)1469–1483, http://dx.doi.org/10.1007/s11095-008-9532-4.
[2]Y.Hoshi,Y.Uchida,M.Tachikawa,T.Inoue,S.Ohtsuki,T.Terasaki, Quantitativeatlasofblood–brainbarriertransporters,receptors,andtight junctionproteinsinratsandcommonmarmoset,J.Pharm.Sci.102(2013) 3343–3355,http://dx.doi.org/10.1002/jps.23575.
[3]S.Ohtsuki,C.Ikeda,Y.Uchida,Y.Sakamoto,F.Miller,F.Glacial,X.Decleves, J.-M.Scherrmann,P.-O.Couraud,Y.Kubo,M.Tachikawa,T.Terasaki, Quantitativetargetedabsoluteproteomicanalysisoftransporters,receptors andjunctionproteinsforvalidationofhumancerebralmicrovascular endothelialcelllinehCMEC/D3asahumanblood–brainbarriermodel,Mol. Pharm.10(2013)289–296,http://dx.doi.org/10.1021/mp3004308. [4]R.Shawahna,Y.Uchida,X.Decle `ves,S.Ohtsuki,S.Yousif,S.Dauchy,A.Jacob,
F.Chassoux,C.Daumas-Duport,P.-O.Couraud,T.Terasaki,J.-M.Scherrmann, Transcriptomicandquantitativeproteomicanalysisoftransportersanddrug metabolizingenzymesinfreshlyisolatedhumanbrainmicrovessels,Mol. Pharm.8(2011)1332–1341,http://dx.doi.org/10.1021/mp200129p. [5]B.Prasad,R.Evers,A.Gupta,C.E.C.aHop,L.Salphati,S.Shukla,S.V.Ambudkar,
J.D.Unadkat,Interindividualvariabilityinhepaticorganicanion-transporting polypeptidesandP-glycoprotein(ABCB1)proteinexpression:quantification byliquidchromatographytandemmassspectroscopyandinfluenceof genotype,age,andsex,DrugMetab.Dispos.42(2013)78–88,http://dx.doi. org/10.1124/dmd.113.053819.
[6]B.Prasad,Y.Lai,Y.Lin,J.D.Unadkat,Interindividualvariabilityinthehepatic expressionofthehumanbreastcancerresistanceprotein(BCRP/ABCG2): effectofage,sex,andgenotype,J.Pharm.Sci.102(2013)787–793,http://dx. doi.org/10.1002/jps.23436.
[7]C.Gröer,S.Brück,Y.Lai,A.Paulick,A.Busemann,C.D.Heidecke,W.Siegmund, S.Oswald,LC–MS/MS-basedquantificationofclinicallyrelevantintestinal uptakeandeffluxtransporterproteins,J.Pharm.Biomed.Anal.85(2013) 253–261,http://dx.doi.org/10.1016/j.jpba.2013.07.031.
[8]C.Chaves,R.Shawahna,A.Jacob,J.-M.Scherrmann,X.Declèves,HumanABC transportersatblood-CNSinterfacesasdeterminantsofCNSdrug penetration,Curr.Pharm.Des.20(2014)1450–1462,http://dx.doi.org/10. 2174/13816128113199990466.
[9]S.Dauchy,F.Dutheil,R.J.Weaver,F.Chassoux,C.Daumas-Duport,P.-O. Couraud,J.-M.Scherrmann,I.DeWaziers,X.Declèves,ABCtransporters, cytochromesP450andtheirmaintranscriptionfactors:expressionatthe humanblood-brainbarrier,J.Neurochem.107(2008)1518–1528,http://dx. doi.org/10.1111/j.1471-4159.2008.05720.x.
[10]D.Gomez-Zepeda,C.Chaves,M.Taghi,P.Sergent,W.-Q.Liu,C.Chhuon,M. Vidal,M.Picard,E.Thioulouse,I.Broutin,I.-C.Guerrera,J.-M.Scherrmann,Y. Parmentier,X.Decleves,M.-C.Menet,Targetedunlabeledmultiplereaction monitoringanalysisofcellmarkersforthestudyofsampleheterogeneityin isolatedratbraincorticalmicrovessels,J.Neurochem.142(2017)597–609,
http://dx.doi.org/10.1111/jnc.14095.
[11]K.McGrail,J.Phillips,K.Sweadner,Immunofluorescentlocalizationofthree Na,K-ATPaseisozymesintheratcentralnervoussystem:bothneuronsand gliacanexpressmorethanoneNa,K-ATPase,J.Neurosci.11(1991)381–391,
http://dx.doi.org/10.1523/JNEUROSCI.11-02-00381.1991.
[12]D.S.Kirkpatrick,S.aGerber,S.P.Gygi,Theabsolutequantificationstrategy:a generalprocedureforthequantificationofproteinsandpost-translational modifications,Methods35(2005)265–273,http://dx.doi.org/10.1016/j. ymeth.2004.08.018.
[13]FoodandDrugAdministration,BioanalyticalMethodValidationGuidancefor Industry,2018http://www.fda.gov/Drugs/
GuidanceComplianceRegulatoryInformation/Guidances/default.htm. [14]M.D.Harwood,B.Achour,M.R.Russell,G.L.Carlson,G.Warhurst,A.
Rostami-Hodjegan,ApplicationofanLC–MS/MSmethodforthesimultaneous quantificationofhumanintestinaltransporterproteinsabsoluteabundance usingaQconCATtechnique,J.Pharm.Biomed.Anal.110(2015)27–33,http:// dx.doi.org/10.1016/j.jpba.2015.02.043.
[15]B.Prasad,J.D.Unadkat,Optimizedapproachesforquantificationofdrug transportersintissuesandcellsbyMRMproteomics,AAPSJ.16(2014) 634–648,http://dx.doi.org/10.1208/s12248-014-9602-y.
[16]T.Miliotis,L.Ali,J.E.Palm,A.J.Lundqvist,M.Ahnoff,T.B.Andersson,C. Hilgendorf,Developmentofahighlysensitivemethodusingliquid chromatography-multiplereactionmonitoringtoquantifymembrane p-glycoproteininbiologicalmatricesandrelationshiptotransportfunction, DrugMetab.Dispos.39(2011)2440–2449,http://dx.doi.org/10.1124/dmd. 111.040774.
[17]Y.Zhang,N.Li,P.W.Brown,J.S.Ozer,Y.Lai,Liquidchromatography/tandem massspectrometrybasedtargetedproteomicsquantificationof
P-glycoproteininvariousbiologicalsamples,RapidCommun.MassSpectrom. 25(2011)1715–1724,http://dx.doi.org/10.1002/rcm.5026.
[18]S.Ohtsuki,O.Schaefer,H.Kawakami,T.Inoue,S.Liehner,A.Saito,N.Ishiguro, W.Kishimoto,E.Ludwig-Schwellinger,T.Ebner,T.Terasaki,Simultaneous absoluteproteinquantificationoftransporters,cytochromesP450,and UDP-glucuronosyltransferasesasanovelapproachforthecharacterizationof individualhumanliver:comparisonwithmRNAlevelsandactivities,Drug Metab.Dispos.40(2012)83–92,http://dx.doi.org/10.1124/dmd.111.042259. [19]S.Yousif,C.Marie-Claire,F.Roux,J.-M.Scherrmann,X.Declèves,Expressionof
drugtransportersattheblood–brainbarrierusinganoptimizedisolatedrat brainmicrovesselstrategy,BrainRes.1134(2007)1–11,http://dx.doi.org/10. 1016/j.brainres.2006.11.089.
[20]B.MacLean,D.M.Tomazela,N.Shulman,M.Chambers,G.L.Finney,B.Frewen, R.Kern,D.L.Tabb,D.C.Liebler,M.J.MacCoss,Skyline:anopensource documenteditorforcreatingandanalyzingtargetedproteomicsexperiments, Bioinformatics.26(2010)966–968,http://dx.doi.org/10.1093/bioinformatics/ btq054.
[21]B.MacLean,D.M.Tomazela,S.E.Abbatiello,S.Zhang,J.R.Whiteaker,A.G. Paulovich,S.aCarr,M.J.MacCoss,Effectofcollisionenergyoptimizationon themeasurementofpeptidesbyselectedreactionmonitoring(SRM)mass spectrometry,Anal.Chem.82(2010)10116–10124,http://dx.doi.org/10. 1021/ac102179j.
[22]D.R.Mani,S.E.Abbatiello,S.aCarr,Statisticalcharacterizationof multiple-reactionmonitoringmassspectrometry(MRM-MS)assaysfor quantitativeproteomics,BMCBioinformatics13(2012)S9,http://dx.doi.org/ 10.1186/1471-2105-13-S16-S9.
[23]S.E.Abbatiello,D.R.Mani,H.Keshishian,S.A.Carr,Automateddetectionof inaccurateandimprecisetransitionsinpeptidequantificationbymultiple reactionmonitoringmassspectrometry,Clin.Chem.56(2010)291–305,
http://dx.doi.org/10.1373/clinchem.2009.138420.
[24]C.Ludwig,R.Aebersold,Frontmatter,in:C.E.Eyers,S.J.Gaskell(Eds.),Quant. Proteomics,1sted.,RoyalSocietyofChemistry,2014,pp.P001–P004,http:// dx.doi.org/10.1039/9781782626985-FP001.
[25]C.H.Wu,Theproteininformationresource,NucleicAcidsRes.31(2003) 345–347,http://dx.doi.org/10.1093/nar/gkg040.
[26]G.Blanco,R.W.Mercer,IsozymesoftheNa-K-ATPase:heterogeneityin structure,diversityinfunction,Am.J.Physiol.275(1998)F633–50,http://dx. doi.org/10.1152/ajprenal.00721.2010.
[27]I.R.León,V.Schwämmle,O.N.Jensen,R.R.Sprenger,Quantitativeassessment ofin-solutiondigestionefficiencyidentifiesoptimalprotocolsforunbiased proteinanalysis,Mol.CellProteomics12(2013)2992–3005,http://dx.doi. org/10.1074/mcp.M112.025585.
[28]C.Ji,W.R.Tschantz,N.D.Pfeifer,M.Ullah,N.Sadagopan,Developmentofa multiplexUPLC-MRMMSmethodforquantificationofhumanmembrane transportproteinsOATP1B1,OATP1B3andOATP2B1ininvitrosystemsand tissues,Anal.Chim.Acta717(2012)67–76,http://dx.doi.org/10.1016/j.aca. 2011.12.005.
[29]J.M.Brady,N.J.Cherrington,D.P.Hartley,S.C.Buist,N.Li,C.D.Klaassen,Tissue distributionandchemicalinductionofmultipledrugresistancegenesinrats, DrugMetab.Dispos.30(2002)838–844,http://dx.doi.org/10.1124/dmd.30.7. 838.
[30]G.Lee,K.Babakhanian,M.Ramaswamy,A.Prat,K.Wosik,R.Bendayan, ExpressionoftheATP-bindingcassettemembranetransporter,ABCG2,in humanandrodentbrainmicrovesselendothelialandglialcellculture systems,Pharm.Res.24(2007)1262–1274,http://dx.doi.org/10.1007/ s11095-007-9244-1. Powered by TCPDF (www.tcpdf.org) Powered by TCPDF (www.tcpdf.org) Powered by TCPDF (www.tcpdf.org) Powered by TCPDF (www.tcpdf.org) Powered by TCPDF (www.tcpdf.org) Powered by TCPDF (www.tcpdf.org) Powered by TCPDF (www.tcpdf.org) Powered by TCPDF (www.tcpdf.org) Powered by TCPDF (www.tcpdf.org) Powered by TCPDF (www.tcpdf.org) Powered by TCPDF (www.tcpdf.org) Powered by TCPDF (www.tcpdf.org) Powered by TCPDF (www.tcpdf.org) Powered by TCPDF (www.tcpdf.org) Powered by TCPDF (www.tcpdf.org)