HAL Id: hal-03066050
https://hal.sorbonne-universite.fr/hal-03066050
Submitted on 15 Dec 2020HAL is a multi-disciplinary open access archive for the deposit and dissemination of sci-entific research documents, whether they are pub-lished or not. The documents may come from teaching and research institutions in France or abroad, or from public or private research centers.
L’archive ouverte pluridisciplinaire HAL, est destinée au dépôt et à la diffusion de documents scientifiques de niveau recherche, publiés ou non, émanant des établissements d’enseignement et de recherche français ou étrangers, des laboratoires publics ou privés.
early-stage breast cancer
Antonio Di Meglio, Gwenn Menvielle, Agnès Dumas, Arnauld Gbenou,
Sandrine Pinto, Thomas Bovagnet, Elise Martin, Arlindo Ferreira, Laurence
Vanlemmens, Olivier Arsene, et al.
To cite this version:
Antonio Di Meglio, Gwenn Menvielle, Agnès Dumas, Arnauld Gbenou, Sandrine Pinto, et al.. Body weight and return to work among survivors of early-stage breast cancer. European Society for Medical Oncology, BMJ Journals, 2020, 5 (6), pp.e000908. �10.1136/esmoopen-2020-000908�. �hal-03066050�
Body weight and return to work among
survivors of early- stage breast cancer
Antonio Di Meglio ,1 Gwenn Menvielle,2 Agnes Dumas,3,4,5 Arnauld Gbenou,1 Sandrine Pinto,2 Thomas Bovagnet,2 Elise Martin,1 Arlindo R Ferreira,6Laurence Vanlemmens,7 Olivier Arsene,8 Mahmoud Ibrahim,9 Johanna Wassermann,10 Anne Laure Martin,11 Jerome Lemonnier,11
Lucia Del Mastro ,12 Lee W Jones,13 Ann H Partridge,14 Jennifer A Ligibel,14 Fabrice Andre,1,15 Stefan Michiels,15,16,17 Ines Vaz Luis 1,18
►Additional material is published online only. To view, please visit the journal online (http:// dx. doi. org/ 10. 1136/ esmoopen- 2020- 000908). To cite: Di Meglio A, Menvielle G, Dumas A, et al. Body weight and return to work among survivors of early- stage breast cancer. ESMO Open 2020;5:e000908. doi:10.1136/ esmoopen-2020-000908
This manuscript contains original material. Portions of the work described herein were presented in poster form at the 2019 ASCO Annual Meeting, May 31–June 4, Chicago, Illinois, USA. This work was awarded with a Conquer Cancer Foundation Merit Award to Antonio Di Meglio. Received 14 July 2020 Revised 8 August 2020 Accepted 23 September 2020
For numbered affiliations see end of article.
Correspondence to Dr Ines Vaz Luis; INES- MARIA. VAZ- DUARTE- LUIS@ gustaveroussy. fr © Author (s) (or their employer(s)) 2020. Re- use permitted under CC BY- NC. No commercial re- use. Published by BMJ on behalf of the European Society for Medical Oncology.
ABSTRACT
Background Many breast cancer (BC) survivors are employed at diagnosis and are expected to return to work after treatment. Among them, around 50% are overweight or obese. There are limited data about the impact of body weight on their ability to return to work.
Methods We used data from CANcer TOxicity (NCT01993498), a prospective, multicentre cohort of women with stage I–III BC. Professionally active women who were ≥5 years younger than retirement age were identified. Multivariable logistic regression models examined associations of body mass index (BMI) at diagnosis and subsequent weight changes with non- return to work 2 years after diagnosis, adjusting for psychosocial, treatment and behavioural characteristics.
Results Among 1869 women, 689 were overweight or obese. Overall, 398 patients (21.3%) had not returned to work 2 years after diagnosis. Non- return to work was more likely for overweight or obese than underweight or normal weight patients (adjusted OR (aOR) 1.32; 95% CI, 1.01 to 1.75; p=0.045). Weight loss (≥5%) was observed in 15.7% overweight or obese and 8.7% underweight or normal weight patients and was associated with significant increases in physical activity only among overweight or obese patients (mean change, +4.7 metabolic- equivalent- of- task- hour/ week; 95% CI +1.9 to +7.5). Overweight or obese patients who lost weight were more likely to return to work compared with those who did not lose weight (aOR of non- return- to- work, 0.48; 95% CI 0.24 to 0.97, p=0.0418), whereas weight loss was associated with increased odds of non- return to work among underweight or normal weight women (aOR 2.07; 95% CI 1.20 to 3.56, p=0.0086) (pinteractionBMI×weight changes=0.0002). The continuous trend of weight gain on non- return to work was significant for overweight or obese patients (aOR for one- percent- unit difference, 1.03; 95% CI 1.01 to 1.06, p=0.030).
Conclusions Excess weight may be a barrier to return to work. Among overweight or obese BC survivors, weight loss was associated with higher rates of return to work, whereas further weight gain was associated with lower likelihood of return to work. Employment outcomes should be evaluated in randomised studies of weight management.
INTRODUCTION
Due to early diagnosis and advances in multi-modal treatments, survival rates of patients with
breast cancer (BC) have markedly improved in the last decades, with a 5- year relative survival esti-mated at 80%–90% in women diagnosed with BC in developed Countries.1 2 However, cancer survivors may face long- term and late physical and psychosocial effects of BC treatment that
Key questions
What is already known about this subject? ► A large portion of breast cancer survivors are
em-ployed at the moment of diagnosis and are expect-ed to return to work after treatment. Employment concerns and inability to rejoin the workforce can lead to financial difficulties, depression, anxiety and relationship changes, and can negatively af-fect breast cancer survivors’ quality of life. Around 50% of women with breast cancer are overweight or obese at diagnosis and represent a significant part of the workforce. Previous studies have largely only included unemployment rates after cancer as a sec-ondary outcome and there are few data concerning how body weight and weight changes, which are common after breast cancer treatment, relate to post- treatment job reintegration.
What does this study add?
► This manuscript addresses the important topic of a cancer survivor returning to work post- treatment, using one of the largest contemporary cohorts of breast cancer survivors available, the CANcer TOxicity cohort. This paper highlights the rela-tionship between body weight at diagnosis, post- diagnosis weight changes and return to work 2 years afterwards. Over 20% of women in this study did not return to work overall and over 27% were still unem-ployed 2 years after breast cancer diagnosis among overweight and obese survivors. Our data show that excess weight may represent a significant barrier to rejoin the workplace and that, among overweight and obese patients, there is an association between weight loss and return- to- work. These findings sug-gest that addressing return to work adequately is still an unmet need in the survivorship arena, partic-ularly among overweight and obese survivors.
copyright.
on December 15, 2020 by guest. Protected by
http://esmoopen.bmj.com/
copyright.
on December 15, 2020 by guest. Protected by
http://esmoopen.bmj.com/
copyright.
on December 15, 2020 by guest. Protected by
http://esmoopen.bmj.com/
copyright.
on December 15, 2020 by guest. Protected by
http://esmoopen.bmj.com/
copyright.
on December 15, 2020 by guest. Protected by
http://esmoopen.bmj.com/
copyright.
on December 15, 2020 by guest. Protected by
http://esmoopen.bmj.com/
copyright.
on December 15, 2020 by guest. Protected by
could affect their ability to recover precancer social relations and work capacity or productivity.3 Unemployment has been shown to be higher in cancer survivors in general and particu-larly in BC survivors.4 Employment concerns can in turn lead to financial difficulties, depression, anxiety and relationship changes, and can negatively affect BC survivors’ quality of life (QoL). Conversely, return to work has been shown to be associated with better QoL and feelings of full recovery from cancer.5 6 Considering the growing number of BC survivors, of whom 25% are under the age of 60,7 8 and the importance of return to work for both survivors and society, strategies to facilitate their return to work should be further explored.
Overweight and obesity are a substantial public health problem in developed countries and higher body mass index (BMI) has been shown to be consistently associated with lower overall and BC survival.9 Randomised controlled trials have been conducted or are underway to evaluate the impact of weight loss interventions on BC recurrence and patients’ QoL.10 11 Although several factors have been
previously identified that may negatively affect return to work after BC, including sociodemographic features, such as lower education level and income,12 13 presence of concomitant medical problems,14 psychological factors such as anxiety and depression,15–17 higher disease burden,13 more aggressive BC treatment modalities,18 19 treatment- related side effects that lead to loss of functionality and reduced work capacity15–17 as well as disadvantageous working conditions,20 limited data are currently available on whether BMI at BC diagnosis and subsequent weight changes correlate with return to work among BC survivors.
We aimed to answer this question using the CANcer TOxicity (CANTO) cohort, a prospective, longitudinal dataset of survivors of early stage BC that includes exten-sive clinical, social and work- related information, purpose-fully designed to characterise long- term BC toxicities. PATIENTS AND METHODS
Data source
We used data from a prospective multicentre cohort of women with stage I–III BC enrolled in 26 French cancer centres since 2012; CANTO, NCT01993498).
Patients exit CANTO at any BC recurrence (other than local) or second cancers. Extensive sociodemo-graphic, clinical, tumour and treatment information were assessed. 21
Study cohort
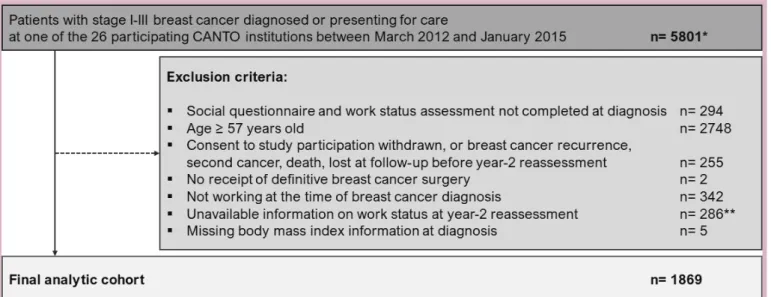
Information from 5801 patients enrolled between March 2012 and January 2015 was accessed. We included women who were professionally active, age 57 years or younger at the time of BC diagnosis (at least 5 years younger than legal retirement age in France) and who had updated work status 2 years after BC diagnosis (figure 1).
Figure 1 CONSORT diagram. *Total accural in CANTO = 12 012 patients. We accessed information from 5801 women who were enrolled from March 2012 to January 2015. **Response rate to work status reassessment questions was associated with age and receipt of endocrine therapy, without major differences in terms of tumour stage, comorbidities, type of breast or axillary surgery, receipt of chemotherapy and radiation therapy. CONSORT, Consolidated Standards of Reporting Trials; CANTO, CANcer TOxicity.
Key questions
How might this impact on clinical practice?
► Overweight and obese women with breast cancer are at risk of poorer outcomes, impaired quality of life and re- employment con-cerns. In addition to many physical and psychological benefits, weight management strategies may also facilitate job reintegration and help avoid premature exit from the workforce for a continuously growing number of overweight and obese survivors. This study sug-gests (1) that re- employment issues after cancer should be better and more systematically addressed in clinical practice and (2) that employment outcomes should be evaluated in randomised studies of weight management, to help mitigate the societal and economic impact of surviving breast cancer.
copyright.
on December 15, 2020 by guest. Protected by
Variables
Our outcome of interest was non- return to work 2 years after BC diagnosis. Exposure variables were objectively assessed BMI at diagnosis (baseline) and weight changes between diagnosis and 2 years afterwards. Covariates previously identified as associated with the outcome of interest were explored and these included baseline socioeconomic and clinical variables, treatment- related covariates, behavioural characteristics, including phys-ical activity (we considered physphys-ical activity as a mean of transportation (travel to/from places) and leisure- related domains (eg, sports and fitness), assessed using the Global Physical Activity Questionnaire-16 and measured as metabolic- equivalent- of- task(MET)- hours/week22; work- related domains were not included), psychosocial factors, including anxiety and depression (Hospital Anxiety and Depression Scale23) and baseline working conditions. Patient- reported measures of QoL were obtained using the European Organisation for Research and Treatment of Cancer (EORTC) QoL questionnaires (EORTC QLQ- C30 and QLQ- BR23).24 25 Objectively documented toxic-ities (Common Terminology Criteria for Adverse Events (CTCAE) V4.0) were obtained by trained clinical research nurses during health examinations. Variables were cate-gorised as per table 1 and online supplemental table 1. Statistical analyses
Patient characteristics were tabulated for the overall cohort. Then, distribution of variables by baseline BMI was described using χ2 tests for categorical variables
and Wilcoxon rank sum tests for continuous variables, as appropriate. BMI was categorised according to the WHO international classification, as follows: <25.0 kg/ m2=under or normal weight; ≥25.0 kg/m2=overweight or
obese. Multivariable logistic regression models were used to examine associations between baseline BMI with non- return to work 2 years afterwards and returned adjusted Odds Ratios (aORs) with respective 95% Confidence Intervals (CIs). Using multivariable logistic regression, we also assessed the association between weight changes occurring after BC diagnosis with non- return to work. Weight change was modelled both as categorical variable (weight loss (at least 5% of baseline weight), no weight loss (stable weight, within 5%, or weight gain, of at least 5%)) and as continuous (percent- unit weight difference compared with baseline weight). Covariates were selected for inclusion in the models in order to account for signif-icant differences between BMI groups at baseline (with a univariate p value <0.05) and for variables that had been previously identified to affect employment after BC.
Analyses that assessed the association between weight changes occurring after BC diagnosis with non- return to work were further stratified by baseline BMI (<25 vs ≥25.0 kg/m2), after testing for significant interactions
between baseline BMI and weight changes.
As sensitivity analyses, we entered in the models also patient- reported outcomes (fatigue (EORTC QLQ- C30) and arm symptoms (QLQ- BR23)) and late toxicities
(arthralgia and myalgia (CTCAE V.4.0)) evaluated at return to work assessment.26
All tests were two sided. P values <0.05 were considered significant. Analyses were conducted using SAS software (V.9.4; SAS Institute).
RESULTS
Cohort characteristics
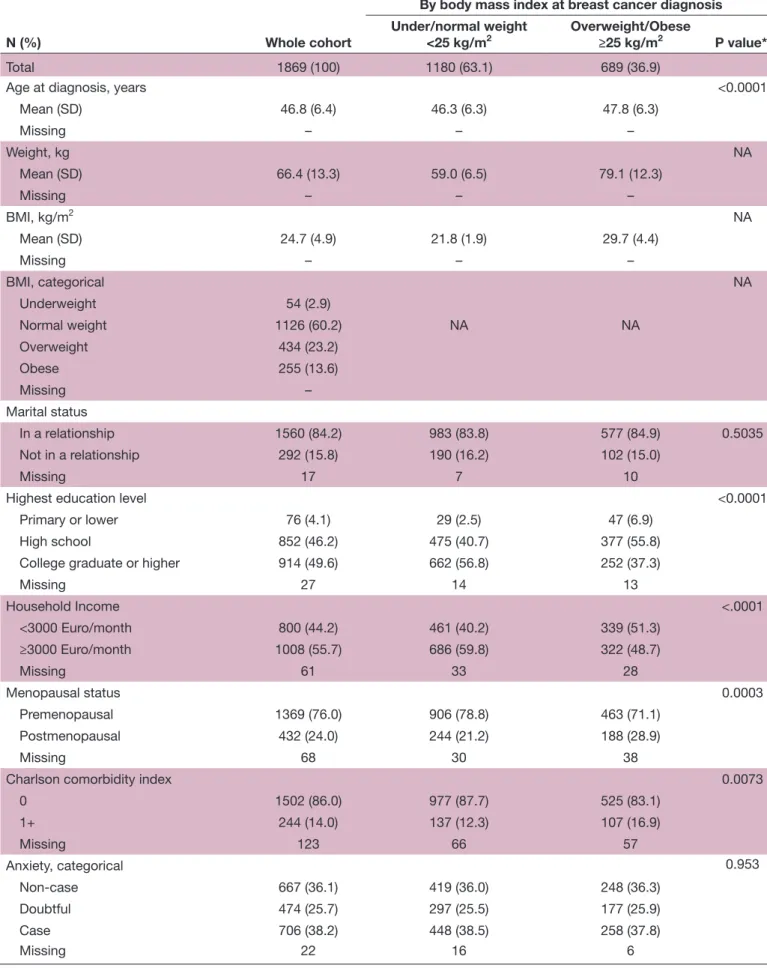
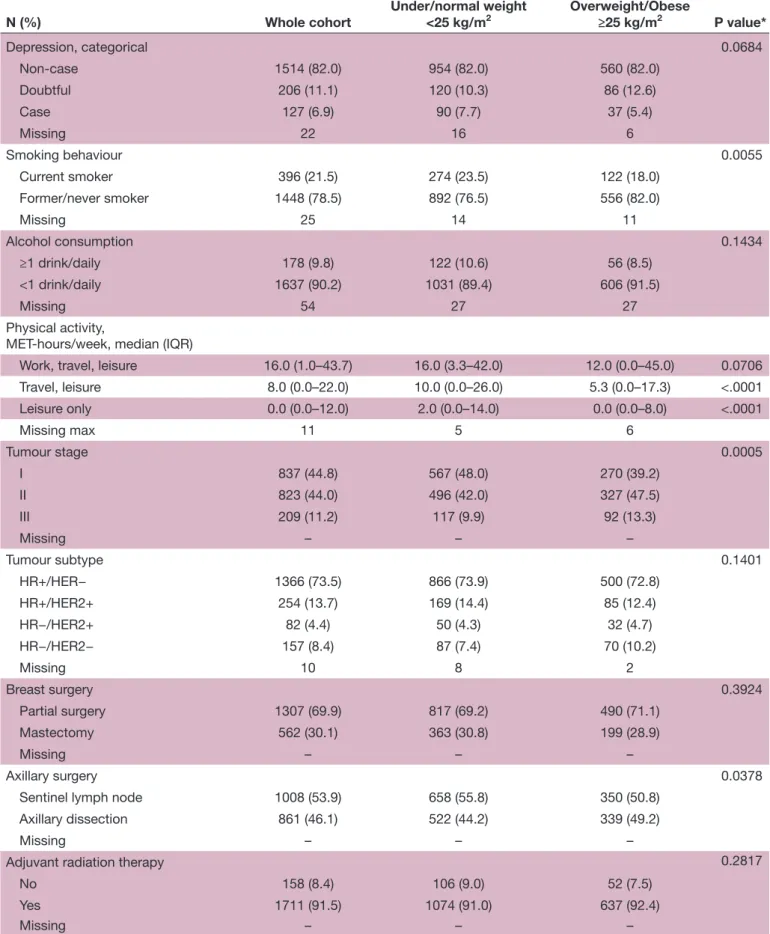
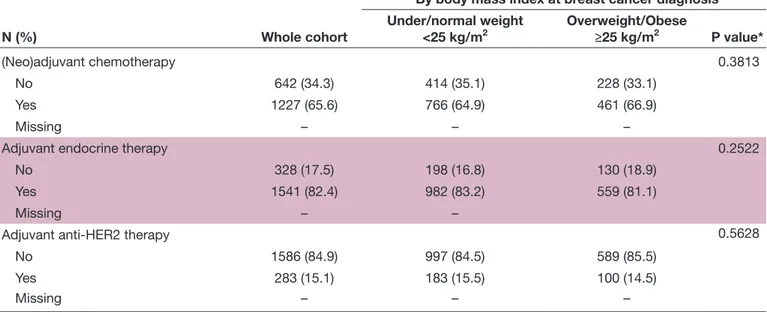
A total of 1869 patients were included. Baseline charac-teristics for the overall cohort population and according to BMI at diagnosis are shown in table 1. Mean age at diagnosis for the overall cohort was 46.8 years (Standard Deviation (SD) 6.4), with a mean weight of 66.4 kg (SD 13.3) and a mean BMI of 24.7 kg/m2 (SD 4.9). At BC
diagnosis, 1180 (63.1%) were under or normal weight and 689 (36.9%) were overweight or obese. Overweight or obese women tended to be slightly older, postmeno-pausal, non- smokers, less physically active and to have lower education, lower income and higher tumour stage. Finally, 16.9% overweight or obese versus 12.3% under or normal weight women had at least one comorbidity (p=0.0073) (table 1). Working conditions were similar between under or normal weight and overweight or obese patients respective to work sector (private/public), type of contract (permanent/fixed- term position), workload (full/part time) and length of daily home- work commuting (more/less than 1 hour) (all p>0.05). However, compared with under or normal weight patients, overweight or obese patients were more likely to have lower rank job positions (43.6% vs 36.8% were employees and 18.1% vs 28.4% were professionals or managers; p<0.0001) (online supplemental table 1). Work status at 2 years after BC diagnosis
At 2 years after BC diagnosis (median time from diagnosis to work status reassessment=23.3 months (Interquar-tile Range (IQR), 21.2–25.3), no differences between under or normal weight patients and overweight or obese patients (p=0.5276)), 398 patients (21.3%) had not returned to work. The rate of non- return to work was 17.7% among under or normal weight patients versus 27.4% among overweight or obese patients (p<0.0001). The distribution of women who had not returned to work among those who were overweight or obese was as follows: 121/434 (27.9%) in patients with BMI of 25.0–29.9 kg/m2; 49/169 (29.0%) in patients with BMI
of 30.0–34.9 kg/m2 and 19/86 (22.1%) in patients with
BMI ≥35.0 kg/m2. Overall, among women who had not
returned to work, the majority (n=294, 73.9%) was still on sick leave 2 years after BC diagnosis. However, compared with under or normal weight women, overweight or obese survivors were less likely to declare that they were on sick leave (69.8% vs 77.5%) or actively looking for a job (7.9% vs 9.1%) and more likely to have received a long- term disability benefit (7.9% vs 3.4%) or to have permanently retired (9.5% vs 3.8%) (p=0.0398). In addition, compared with under or normal weight women, overweight or obese
copyright.
on December 15, 2020 by guest. Protected by
Table 1 Cohort characteristics
N (%) Whole cohort
By body mass index at breast cancer diagnosis Under/normal weight
<25 kg/m2 Overweight/Obese≥25 kg/m2 P value*
Total 1869 (100) 1180 (63.1) 689 (36.9)
Age at diagnosis, years <0.0001
Mean (SD) 46.8 (6.4) 46.3 (6.3) 47.8 (6.3) Missing – – – Weight, kg NA Mean (SD) 66.4 (13.3) 59.0 (6.5) 79.1 (12.3) Missing – – – BMI, kg/m2 NA Mean (SD) 24.7 (4.9) 21.8 (1.9) 29.7 (4.4) Missing – – – BMI, categorical NA Underweight 54 (2.9) Normal weight 1126 (60.2) NA NA Overweight 434 (23.2) Obese 255 (13.6) Missing – Marital status In a relationship 1560 (84.2) 983 (83.8) 577 (84.9) 0.5035 Not in a relationship 292 (15.8) 190 (16.2) 102 (15.0) Missing 17 7 10
Highest education level <0.0001
Primary or lower 76 (4.1) 29 (2.5) 47 (6.9)
High school 852 (46.2) 475 (40.7) 377 (55.8)
College graduate or higher 914 (49.6) 662 (56.8) 252 (37.3)
Missing 27 14 13 Household Income <.0001 <3000 Euro/month 800 (44.2) 461 (40.2) 339 (51.3) ≥3000 Euro/month 1008 (55.7) 686 (59.8) 322 (48.7) Missing 61 33 28 Menopausal status 0.0003 Premenopausal 1369 (76.0) 906 (78.8) 463 (71.1) Postmenopausal 432 (24.0) 244 (21.2) 188 (28.9) Missing 68 30 38
Charlson comorbidity index 0.0073
0 1502 (86.0) 977 (87.7) 525 (83.1) 1+ 244 (14.0) 137 (12.3) 107 (16.9) Missing 123 66 57 Anxiety, categorical 0.953 Non- case 667 (36.1) 419 (36.0) 248 (36.3) Doubtful 474 (25.7) 297 (25.5) 177 (25.9) Case 706 (38.2) 448 (38.5) 258 (37.8) Missing 22 16 6 Continued copyright.
on December 15, 2020 by guest. Protected by
N (%) Whole cohort
By body mass index at breast cancer diagnosis Under/normal weight <25 kg/m2 Overweight/Obese≥25 kg/m2 P value* Depression, categorical 0.0684 Non- case 1514 (82.0) 954 (82.0) 560 (82.0) Doubtful 206 (11.1) 120 (10.3) 86 (12.6) Case 127 (6.9) 90 (7.7) 37 (5.4) Missing 22 16 6 Smoking behaviour 0.0055 Current smoker 396 (21.5) 274 (23.5) 122 (18.0) Former/never smoker 1448 (78.5) 892 (76.5) 556 (82.0) Missing 25 14 11 Alcohol consumption 0.1434 ≥1 drink/daily 178 (9.8) 122 (10.6) 56 (8.5) <1 drink/daily 1637 (90.2) 1031 (89.4) 606 (91.5) Missing 54 27 27 Physical activity,
MET- hours/week, median (IQR)
Work, travel, leisure 16.0 (1.0–43.7) 16.0 (3.3–42.0) 12.0 (0.0–45.0) 0.0706 Travel, leisure 8.0 (0.0–22.0) 10.0 (0.0–26.0) 5.3 (0.0–17.3) <.0001 Leisure only 0.0 (0.0–12.0) 2.0 (0.0–14.0) 0.0 (0.0–8.0) <.0001 Missing max 11 5 6 Tumour stage 0.0005 I 837 (44.8) 567 (48.0) 270 (39.2) II 823 (44.0) 496 (42.0) 327 (47.5) III 209 (11.2) 117 (9.9) 92 (13.3) Missing – – – Tumour subtype 0.1401 HR+/HER− 1366 (73.5) 866 (73.9) 500 (72.8) HR+/HER2+ 254 (13.7) 169 (14.4) 85 (12.4) HR−/HER2+ 82 (4.4) 50 (4.3) 32 (4.7) HR−/HER2− 157 (8.4) 87 (7.4) 70 (10.2) Missing 10 8 2 Breast surgery 0.3924 Partial surgery 1307 (69.9) 817 (69.2) 490 (71.1) Mastectomy 562 (30.1) 363 (30.8) 199 (28.9) Missing – – – Axillary surgery 0.0378
Sentinel lymph node 1008 (53.9) 658 (55.8) 350 (50.8) Axillary dissection 861 (46.1) 522 (44.2) 339 (49.2)
Missing – – –
Adjuvant radiation therapy 0.2817
No 158 (8.4) 106 (9.0) 52 (7.5) Yes 1711 (91.5) 1074 (91.0) 637 (92.4) Missing – – – Table 1 Continued Continued copyright.
on December 15, 2020 by guest. Protected by
survivors scored worse on fatigue (mean (SD) 38.8 (24.7) vs 37.1 (25.4)) and arm symptoms (26.9 (26.1) vs 23.3 (16.2)) scales and reported more frequently late symp-toms including arthralgia (56.5% vs 46.4%) and myalgia (33.9% vs 28.8%) at return to work assessment.
After multivariable adjustment, the OR of non- return- to- work for overweight or obese versus under or normal weight was 1.32 (95% CI 1.01 to 1.75), p=0.045. In addi-tion, aORs of non- return- to- work were also significantly increased in patients who had lower household income (<3000 vs ≥3000 Euro/month, OR 1.37 (95% CI 1.03 to 1.80)), lower education level (primary school vs college graduate or higher, 2.96 (1.56 to 5.60)), more comorbid-ities (Charlson score 1+ vs 0, 1.55 (1.08 to 2.18), higher anxiety (case vs non- case, 1.42 (1.01 to 2.00)), those who were current smokers (vs former/never, 1.56 (1.14 to 2.12)), those who had higher tumour stage (III vs I, 2.03 (1.23 to 3.36)), those who had undergone mastec-tomy (vs partial surgery, 1.46 (1.07 to 1.99)), and those receiving anti- human epidermal growth factor receptor-2 therapy (vs no, 1.71 (1.21 to 2.42)) (table 2). Being over-weight or obese remained independently associated with non- return to work also after adjustment for imbalances in working conditions at baseline (aOR of non- return- to- work vs under or normal weight, 1.33 (95% CI 1.01 to 1.76), p=0.043; no significant associations were found between prior job position and return to work status). Consistent results were obtained from sensitivity analyses that accounted for late toxicity symptoms. Odds of non- return to work remained elevated among overweight or obese compared with under or normal weight patients (aOR 1.40 (95% CI 1.05 to 1.88)). There were also signifi-cant associations of fatigue (continuous, aOR 1.011 (95% CI 1.005 to 1.017)), arm symptoms (continuous, 1.013
(1.008 to 1.019)) and myalgia (any grade vs no, 1.36 (95% CI 1.02 to 1.83)) with non- return to work (online supple-mental table 2).
Post-treatment weight changes
In the overall cohort, 1010 patients (55.7%) reported stable weight, whereas 599 (33.0%) reported ≥5% weight gain and 205 (11.3%) reported ≥5% weight loss. Respec-tively, among under or normal weight patients and over-weight or obese patients, 677 (59.1%) and 333 (49.8%) reported stable weight, 369 (32.2%) and 230 (34.4%) reported ≥5% weight gain, whereas 100 (8.7%) and 105 (15.7%) reported ≥5% weight loss.
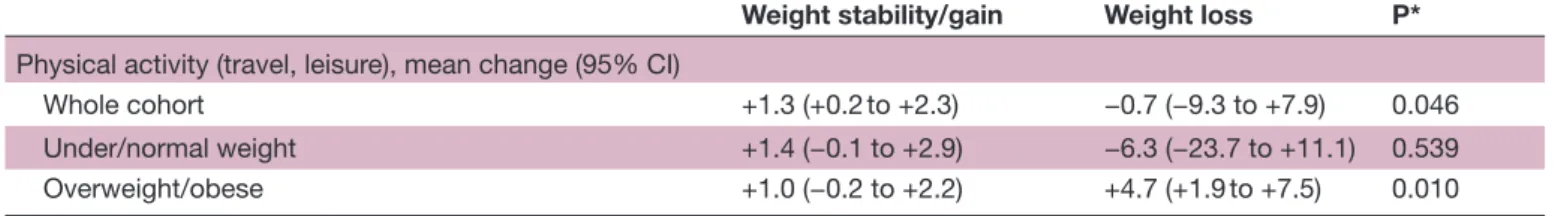
There seemed to be no significant association between weight change and change in physical activity among under or normal weight patients (mean change: −6.3 vs +1.4 MET- hour/week among whose weight decreased vs was stable or increased, respectively, p=0.539). Conversely, changes in physical activity were significantly associated with weight change in patients who were overweight or obese, with those who lost weight being also more likely to have reported an increase in physical activity compared with those whose weight was stable or increased (mean change: +4.7 vs +1.0 MET- hour/week, respectively, p=0.010) (table 3). Compared with those whose weight remained stable or increased, patients who were under or normal weight at baseline and lost weight also reported worse QoL 2- year postdiagnosis, including scoring signifi-cantly worse for emotional, social, cognitive and role function as well as reporting more severe fatigue and arm symptoms. On the contrary, overweight or obese patients who lost weight reported significantly better physical func-tion and body image as well as reduced pain, dyspnoea
N (%) Whole cohort
By body mass index at breast cancer diagnosis Under/normal weight <25 kg/m2 Overweight/Obese≥25 kg/m2 P value* (Neo)adjuvant chemotherapy 0.3813 No 642 (34.3) 414 (35.1) 228 (33.1) Yes 1227 (65.6) 766 (64.9) 461 (66.9) Missing – – –
Adjuvant endocrine therapy 0.2522
No 328 (17.5) 198 (16.8) 130 (18.9)
Yes 1541 (82.4) 982 (83.2) 559 (81.1)
Missing – –
Adjuvant anti- HER2 therapy 0.5628
No 1586 (84.9) 997 (84.5) 589 (85.5)
Yes 283 (15.1) 183 (15.5) 100 (14.5)
Missing – – –
*Chi square for categorical variables, Wilcoxon rank sum test for continuous variables.
BMI, body mass index; HER2, human- epidermal- growth- factor- receptor-2; HR, hormone- receptor; MET, metabolic- equivalent- of- task; NA, non- applicable.
Table 1 Continued
copyright.
on December 15, 2020 by guest. Protected by
and breast symptoms compared with those whose weight was stable or increased (online supplemental table 3). Post-treatment weight changes and return-to-work
Rates of non- return to work in the overall cohort were 18.2% for those with stable weight, 26.0% for those
who gained ≥5% weight and 23.4% for those who lost ≥5% weight (p=0.0008). When considering non- return to work according to BMI at BC diagnosis, among patients who were under or normal weight, rates of non- return to work were 15.2% for those who remained stable, 20.6% for those who gained ≥5% wt and 26.0% for those who lost ≥5% wt (p=0.0082). Among those who were overweight or obese, rates of non- return to work were 24.3% for those who remained stable, 34.8% for those who gained ≥5% wt and 20.9% for those who lost ≥5% wt (p=0.0065).
Non- return to work was associated with weight changes when modelled as categorical variable in a multivariable setting, with the effect of weight changes on return to work status being dependent on BMI at diagnosis (p
inter-action=0.0002). For under or normal weight women who
lost ≥5% weight, the odds of non- return to work were twofold (aOR, 2.07; 95% CI 1.20 to 3.56, vs no weight loss, p=0.0086), whereas for overweight or obese women who lost ≥5% wt, odds of non- return to work were halved (aOR 0.48; 95% CI 0.24 to 0.97, vs no weight loss, p=0.0418) (table 4). Similar results were obtained after adjustment for imbalances in work conditions at baseline (data not shown).
Additionally, the continuous trend of weight gain on non- return- to- work was significant among overweight or obese patients (aOR for each one- percent- unit increasing weight difference from baseline, 1.03; 95% CI 1.01 to 1.06, p=0.030) but not among under or normal weight women (aOR 0.99; 95% CI 0.97 to 1.02, p=0.823) (p
interac-tion=0.036) (online supplemental table 4).
DISCUSSION
The CANTO cohort allowed us to explore how body weight and employment trends are related in early stage BC survivors, who make up a relevant portion of the modern workforce.13 In this large, prospective, contem-porary cohort, we have shown that excess body weight at BC diagnosis is independently associated with increased rates of non- return- to- work 2 years afterwards, among young, previously employed BC survivors.
From a societal perspective, overweight and obesity have multiple implications in the job market and excess weight correlates with worse occupational characteris-tics regardless of having a cancer history. Excess weight is a visible status and can predispose individuals to stigma and bias.27 Data indicate that there is substantial appearance- based discrimination in employment,28 and that employers favour hiring workers whose BMI is in the normal range.29 As a result, people with higher BMI, particularly individuals with obesity, tend to be less likely to be hired and more frequently remain long- term unem-ployed.30 Excess weight is also associated with lower educa-tion and income,31 and with having lower job profiles, with worse monetary compensation as well as with less appealing non- pecuniary characteristics, including work content, job security or work- related social prestige.32 From a patient perspective, prior research suggests that Table 2 Multivariable logistic regression of factors
associated with non- return- to- work (N=1869)
Adjusted
OR 95% CI P
BMI at diagnosis (vs underweight/normal)
Overweight/obese 1.32 1.01 to 1.75 0.045 Age (continuous, 1 year
increase)
1.01 0.98 to 1.04 0.391 Highest education level (vs college graduate or higher)
Primary or lower 2.96 1.56 to 5.60 0.0008 High school 1.58 1.18 to 2.10 0.002 Household Income (vs. ≥3000 Euro/month)
<3000 Euro/month 1.37 1.03 to 1.80 0.0271 Menopausal status (vs premenopausal)
Postmenopausal 1.38 0.96 to 1.98 0.083 Comorbidities (vs Charlson 0)
Charlson 1+ 1.55 1.08 to 2.18 0.016 Anxiety (vs non- case)
Doubtful 1.41 1.01 to 1.99 0.0481
Case 1.42 1.01 to 2.00 0.0438
Depression (vs non- case)
Doubtful 1.31 0.88 to 1.95 0.1888
Case 1.32 0.79 to 2.20 0.2905
Smoking behaviour (vs former/ never smoker)
Current smoker 1.56 1.14 to 2.12 0.0049 23 Physical activity (travel,
leisure)
(continuous, 1- MET- hour/week increase)
0.99 0.99 to 1.00 0.296
Tumour stage (vs I)
II 1.20 0.85 to 1.70 0.290
III 2.03 1.23 to 3.36 0.00581
Breast surgery (vs partial surgery)
Mastectomy 1.46 1.07 to 1.99 0.0179 Axillary surgery (vs sentinel lymph node)
Axillary dissection 1.27 0.89 to 1.80 0.1845 (Neo)adjuvant chemotherapy (vs no)
Yes 1.01 0.69 to 1.45 0.9847
Adjuvant endocrine therapy (vs no)
Yes 0.77 0.55 to 1.09 0.1398
Adjuvant anti- HER2 therapy (vs no)
Yes 1.71 1.21 to 2.42 0.0024
*For all factors in the table.
BMI, body mass index; HER2, human- epidermal- growth- factor- receptor-2; MET, metabolic- equivalent- of- task.
copyright.
on December 15, 2020 by guest. Protected by
reasons for unemployment among cancer survivors most frequently include physical limitations, cancer- related symptoms and impairments in social and role functioning resulting from cancer treatment.4 33 In a large meta- analysis, de Boer et al34 reported that cancer survivors are 1.37 times more likely to be unemployed than healthy controls, with a pooled rate of unemployment of 33.8% overall and 35.6% specifically among BC survivors, and authors concluded that the mechanism that most likely explains these higher figures among cancer survivors is a higher disability rate. Analogously, among women in the Young Women’s Breast Cancer Study who were employed before BC diagnosis and reported subsequent unemploy-ment, half declared that they were unemployed for health reasons,13 while work productivity and job performance were shown to be substantially and negatively impacted by symptom burden after BC, with increased probability of work- related distress.12 13 Moreover, supporting the notion that transitioning out of the workforce is more often due to health- related issues than to other reasons, previous studies showed that voluntary unemployment that is not linked to health conditions is infrequent unless patients benefit from sufficiently high alternative resources for income, other than their job compensation.4 Overweight and obese patients are generally particularly susceptible to experience negative and long- lasting effects after cancer treatment and are exposed to worse physical and
psychological struggles. Patients with higher BMI more often develop fatigue, pain and cognitive troubles that are prone to become chronic and can also affect return to work.35
Putting our results into the context of the existing literature, overweight and obese patients in our cohort were more likely to have lower education and to have low- ranking jobs, and more than half had also reported a low household income at diagnosis. These characteris-tics make it unlikely for these survivors to have remained voluntarily unemployed. Further, concomitant medical conditions also seemed to impair return to work ability of patients in this cohort, and indeed one in six over-weight or obese women had at least one comorbidity at the time of BC diagnosis. Presence of concomitant morbid conditions may have had also an implication in the higher observed proportion of overweight and obese patients that received a disability pension compared with under or normal weight patients, leading in turn to a reduced number of overweight and obese women who were actively seeking a job 2- year postdiagnosis. Finally, rates of patients who permanently retired after BC were higher among overweight or obese compared with under or normal weight patients, despite a mean age of approx-imately 48 years at the time of diagnosis for the former group. This is a relatively premature age for retirement in a country like France, where legal retirement age for women is 62 years, and specifically among women who were included in this cohort, all professionally active and mostly employed on long- term, permanent work contracts at the time of BC diagnosis.
We also reported significant associations between weight changes, which are known to be common after BC,36 and return to work. In CANTO, patients who were overweight or obese at diagnosis and who experienced a weight loss of at least 5% of initial body weight (corre-sponding to approximately 4 kg in this cohort) were less likely to be unemployed 2 years from diagnosis compared with those who did not lose weight. Several controlled trials have assessed the impact of weight loss interventions on a number of outcomes among overweight and obese BC survivors. These interventions have been shown to be feasible, safe and effective in improving physical fitness, cardiorespiratory parameters and other health- related QoL outcomes.10 37 38 Ongoing studies will confirm whether weight loss improves BC- specific outcomes, including recurrence and survival.11 Our results add to Table 3 Associations between changes in physical activity and weight
Weight stability/gain Weight loss P* Physical activity (travel, leisure), mean change (95% CI)
Whole cohort +1.3 (+0.2 to +2.3) −0.7 (−9.3 to +7.9) 0.046 Under/normal weight +1.4 (−0.1 to +2.9) −6.3 (−23.7 to +11.1) 0.539 Overweight/obese +1.0 (−0.2 to +2.2) +4.7 (+1.9 to +7.5) 0.010 *Wilcoxon rank- sum test.
Table 4 Association of weight changes (weight loss vs non- weight loss (stability/gain)) with non- return- to- work in multivariable logistic regression models (N=1814)
Adjusted
OR* 95% CI P
Whole cohort
Weight stability/gain Ref. – – Weight loss 1.11 0.73 to 1.68 0.632 p for interaction weight change- by- BMI=0.0002
Under/normal weight
Weight stability/gain Ref. – – Weight loss 2.07 1.20 to 3.56 0.0086
Overweight/obese
Weight stability/gain Ref. – 0.0418 Weight loss 0.48 0.24 to 0.97
*For factors in Table 2 + change in physical activity. BMI, body mass index.
copyright.
on December 15, 2020 by guest. Protected by
the existing literature showing an association of weight loss with return to work in overweight and obese women, for which there are several possible mediators. These include improved QoL, reduced psychophysical distress, attenuated downstream effects of cancer treatment and healthier overall physical status that can facilitate rejoining the workplace. Our findings also suggest that weight loss in patients who present with excess weight at diagnosis should be further explored as a way to facili-tate re- employment, thus mitigating the societal and economic impact of surviving BC. In this context, this study advocates for the urgent need of evaluating employ-ment outcomes in large trials of weight manageemploy-ment in cancer survivors, including the assessment of the aeti-ology and duration of sick leave and absence from work, rates of re- employment and longitudinal patterns of work ability, work capacity and wage losses. Particularly, future trials should look beyond whether an overweight or obese patient has returned to work or not after cancer. For many cancer survivors, returning to work is indicative of a complete recovery and regained life routine.33 However, although a survivor’s well- being may be higher within the group of those who return to work compared with those that do not,5 6 perceived health- related QoL may also range widely among those who do actually go back to work. Patients may be forced to change career tracks or not be able to perform at the same level as before their cancer or experience particular physical, psycho-logical and financial challenges while trying to balance treatment side effects with several other employment concerns in daily life.13 This may translate into worse QoL and increase distress and job dissatisfaction even after a patient has managed to successfully rejoin the workplace. All these aspects are relevant to overweight and obese individuals, who were shown to be particularly vulnerable to long- lasting and more severe physical and psychosocial stressors during the survivorship period compared with patients within a normal BMI range.39 40
The current study has a number of strengths. Previous studies have largely only included unemployment rates after cancer as a secondary outcome and there are few data concerning the relationship between body weight and job reintegration in cancer survivorship. Our find-ings are based on a prospective clinical study of patients recruited across France, strengthened by a large sample size. To be able to evaluate patients who would be avail-able for labour market and seeking re- employment, we only identified those who were too young to be retired 2 years after BC diagnosis, attempting to avoid including patients who would directly transition from cancer leave into permanent retirement. Additionally, body weight was objectively and longitudinally assessed by dedi-cated study nurses. Also, CANTO had availability of data regarding other behavioural characteristics, including physical activity, with low rates of missing data. As such, in this study, we were able to better describe behavioural traits of BC survivors over time and to conclude that overweight or obese patients who lost weight were also
more likely to report significant increases in physical activity, which is an important component of weight management. In contrast, weight loss was not accompa-nied by a concomitant increase in physical activity for under or normal weight patients, who reported reduced or at most similar activity levels, possibly reflecting unin-tentional weight changes due to more severe symptom burden and treatment toxicity. These behavioural differ-ences are also mirrored by differential patterns of QoL observed 2 years after BC diagnosis when analysing patients by baseline BMI and weight change category. Women who were overweight or obese at diagnosis and who lost weight scored indeed significantly better on a number of functional and symptom domains compared with those whose weight was stable or increased, with no apparent detriments in QoL associated with their weight loss (consistently with a previous CANTO publication41), whereas women who were under or normal weight at diagnosis and had lost weight seemed to fare worse than those who reported a stable or increased weight, being more likely to report of impaired functionality and more severe symptomatology.
Some limitations must also be acknowledged. First, we used an arbitrary cut- off of 5% to define weight change categories. However, this was based on previously observed clinically meaningful benefits of such a weight loss in the overweight patient population,42 and the asso-ciation between non- return to work and weight changes remained consistent when weight change was modelled as continuous. Second, we used self- reported instruments for physical activity, with possible recall and reporting biases. Third, we acknowledge that our data do not allow to assess intentionality of weight changes. However, we provided additional descriptive information to better characterise patients whose weight decreased, particu-larly focusing on other closely related health behaviours such as changes in physical activity, and we were able to access an extensive list of patient- reported outcomes that helped us better define several parameters of health- related QoL and correlate them with weight variations. Moreover, to rule out unintentional weight changes that could be due to disease progression, we upfront included only patients who were disease- free 2 years after diagnosis, without evidence of BC recurrence or diagnosis of second cancers. Fourth, French law does not allow to collect race/ ethnicity information, which we acknowledge as a poten-tial confounder when assessing determinants of return to work. Fifth, we could not evaluate patients who had not provided information on work status at year 2 reassess-ment and this may have introduced some selection bias. However, respondents to work status questions were very similar to non- respondents in term of baseline character-istics. Finally, differences in insurance programmes and social security systems may limit generalisability of our findings to work and healthcare systems that are different from France.
copyright.
on December 15, 2020 by guest. Protected by
CONCLUSION
In conclusion, our data suggest that excess body weight at BC diagnosis may be a significant barrier to return to work and that overweight and obese patients represent a vulnerable group for unemployment after BC. However, while among overweight or obese women in this cohort there was an association between weight loss and higher rates of return to work, further weight gain was associ-ated with reduced likelihood of returning to work. Future research, including ongoing randomised studies testing interventions of weight management and weight loss among BC survivors, should consider including measures of social rehabilitation and employment outcomes.
Author affiliations
1Prédicteurs moléculaires et nouvelles cibles en oncologie, INSERM Unit 981,
Gustave Roussy, Villejuif, France
2Institut Pierre Louis d'Epidémiologie et de Santé Publique, Paris, France 3INSERM Unit 1018, Villejuif, France
4UMR Unit 1123, Paris, France
5Université Paris Diderot UFR de Médecine, Paris, France
6Breast Unit, Champalimaud Clinical Center, Champalimaud Foundation, Lisboa,
Portugal
7Oscar Lambret Cancer Centre, Lille, France 8Centre Hospitalier de Blois, Blois, France
9Regional Hospital Centre Orleans Porte Madeleine Hospital, Orleans, France 10Hopital Universitaire Pitie Salpetriere, Paris, France
11UNICANCER, Paris, France
12Ospedale Policlinico San Martino Istituto di Ricovero e Cura a Carattere Scientifico
per l'Oncologia, Genova, Italy
13Memorial Sloan Kettering Cancer Center, New York, New York, USA 14Dana- Farber Cancer Institute, Boston, Massachusetts, USA 15University Paris- Saclay, Villejuif, France
16Department of biostatistics and epidemiology, Gustave Roussy Cancer Campus,
Villejuif, France
17Oncostat Inserm U1018, Villejuif, France 18Medical Oncology, Gustave Roussy, Villejuif, France
Twitter Antonio Di Meglio @dimeglio_anto and Ines Vaz Luis @inesvazluis Acknowledgements We thank Yuki Takahashi for her help with manuscript drafting.
Funding This study was supported by a Clinical Research Fellowship from the European Society for Medical Oncology (ESMO) to Antonio Di Meglio, a Career Catalyst Research grant from Susan G. Komen (CCR17483507) to Ines Vaz- Luis and grants from Odyssea, the French Foundation for Cancer Research (ARC), and Foundation Gustave Roussy. CANTO is supported by the French Government under the 'Investment for the Future' programme managed by the National Research Agency (ANR), grant n° ANR-10- COHO-0004.
Competing interests None declared. Patient consent for publication Not required.
Ethics approval All participants provided informed consent and the study was approved by the national regulatory and ethics committee (ID- RCB:2011- A01095-36,11-039). Study procedures were previously described. Provenance and peer review Not commissioned; externally peer reviewed. Data availability statement Data are available upon reasonable request. Data may be obtained from a third party and are not publicly available. CANTO data are available upon request to a dedicated study Executive Committee (http://www. unicancer. fr/ rd- unicancer/ letudecanto).
Supplemental material This content has been supplied by the author(s). It has not been vetted by BMJ Publishing Group Limited (BMJ) and may not have been peer- reviewed. Any opinions or recommendations discussed are solely those of the author(s) and are not endorsed by BMJ. BMJ disclaims all liability and responsibility arising from any reliance placed on the content. Where the content includes any translated material, BMJ does not warrant the accuracy and reliability
of the translations (including but not limited to local regulations, clinical guidelines, terminology, drug names and drug dosages), and is not responsible for any error and/or omissions arising from translation and adaptation or otherwise. Open access This is an open access article distributed in accordance with the Creative Commons Attribution Non Commercial (CC BY- NC 4.0) license, which permits others to distribute, remix, adapt, build upon this work non- commercially, and license their derivative works on different terms, provided the original work is properly cited, any changes made are indicated, and the use is non- commercial. See: http:// creativecommons. org/ licenses/ by- nc/ 4. 0/.
ORCID iDs
Antonio Di Meglio http:// orcid. org/ 0000- 0002- 0233- 3189
Lucia Del Mastro http:// orcid. org/ 0000- 0002- 9546- 5841
Ines Vaz Luis http:// orcid. org/ 0000- 0002- 7194- 2260
REFERENCES
1 Coleman MP, Quaresma M, Berrino F, et al. Cancer survival in five continents: a worldwide population- based study (Concord). Lancet Oncol 2008;9:730–56.
2 Siegel RL, Miller KD, Jemal A. Cancer statistics, 2019. CA A Cancer J Clin 2019;69:7–34.
3 Mehnert A, de Boer A, Feuerstein M. Employment challenges for cancer survivors. Cancer 2013;119(Suppl 11):2151–9.
4 de Boer AGEM, Taskila T, Ojajärvi A, et al. Cancer survivors and unemployment: a meta- analysis and meta- regression. JAMA
2009;301:753–62.
5 Engel J, Kerr J, Schlesinger- raab A, et al. Predictors of quality of life of breast cancer patients. Acta Oncol 2003;42:710–8 http://www. ncbi. nlm. nih. gov/ pubmed/ 14690156
6 Timperi AW, Ergas IJ, Rehkopf DH, et al. Employment status and quality of life in recently diagnosed breast cancer survivors.
Psychooncology 2013;22:1411–20.
7 Miller KD, Siegel RL, Lin CC, et al. Cancer treatment and survivorship statistics, 2016. CA Cancer J Clin 2016;66:271–89.
8 Ferlay J, Colombet M, Soerjomataram I, et al. Estimating the global cancer incidence and mortality in 2018: GLOBOCAN sources and methods. Int J Cancer 2019;144:1941–53.
9 Chan DSM, Vieira AR, Aune D, et al. Body mass index and survival in women with breast cancer- systematic literature review and meta- analysis of 82 follow- up studies. Ann Oncol 2014;25:1901–14. 10 Goodwin PJ, Segal RJ, Vallis M, et al. Randomized trial of a
telephone- based weight loss intervention in postmenopausal women with breast cancer receiving letrozole: the LISA trial. J Clin Oncol
2014;32:2231–9.
11 Ligibel JA, Barry WT, Alfano C, et al. Randomized phase III trial evaluating the role of weight loss in adjuvant treatment of overweight and obese women with early breast cancer (alliance A011401): study design. NPJ Breast Cancer 2017;3:37.
12 Wang L, Hong BY, Kennedy SA, et al. Predictors of unemployment after breast cancer surgery: a systematic review and meta- analysis of observational studies. J Clin Oncol 2018;36:1868–79.
13 Rosenberg SM, Vaz- Luis I, Gong J, et al. Employment trends in young women following a breast cancer diagnosis. Breast Cancer Res Treat 2019;177:207–14.
14 Lee MK, Kang HS, Lee KS, et al. Three- Year prospective cohort study of factors associated with return to work after breast cancer diagnosis. J Occup Rehabil 2017;27:547–58.
15 Bijker R, Duijts SFA, Smith SN, et al. Functional impairments and work- related outcomes in breast cancer survivors: a systematic review. J Occup Rehabil 2018;28:429–51.
16 Carlsen K, Jensen AJ, Rugulies R, et al. Self- reported work ability in long- term breast cancer survivors. A population- based questionnaire study in Denmark. Acta Oncol 2013;52:423–9.
17 Lindbohm M- L, Kuosma E, Taskila T, et al. Early retirement and non- employment after breast cancer. Psychooncology 2014;23:634–41. 18 Arfi A, Baffert S, Soilly A- L, et al. Determinants of return at work
of breast cancer patients: results from the OPTISOINS01 French prospective study. BMJ Open 2018;8:e020276.
19 Jagsi R, Abrahamse PH, Lee KL, et al. Treatment decisions and employment of breast cancer patients: results of a population‐based survey. Cancer 2017;123:4791–9.
20 Bouknight RR, Bradley CJ, Luo Z. Correlates of return to work for breast cancer survivors. J Clin Oncol 2006;24:345–53.
21 Vaz- Luis I, Cottu P, Mesleard C, et al. UNICANCER: French prospective cohort study of treatment- related chronic toxicity in women with localised breast cancer (CANTO). ESMO Open
2019;4:e000562.
copyright.
on December 15, 2020 by guest. Protected by
22 Global physical activity questionnaire analysis guide GPAQ analysis guide global physical activity questionnaire (GPAQ) analysis guide. Available: http://www. who. int/ chp/ steps/ GPAQ/ en/ index. html [Accessed 18 Feb 2019].
23 Zigmond AS, Snaith RP. The hospital anxiety and depression scale.
Acta Psychiatr Scand 1983;67:361–70.
24 Aaronson NK, Ahmedzai S, Bergman B, et al. The European organization for research and treatment of cancer QLQ- C30: a quality- of- life instrument for use in international clinical trials in oncology. J Natl Cancer Inst 1993;85:365–76.
25 Sprangers MA, Groenvold M, Arraras JI, et al. The European organization for research and treatment of cancer breast cancer- specific quality- of- life questionnaire module: first results from a three- country field study. J Clin Oncol 1996;14:2756–68. 26 Dumas A. Return to work after breast cancer: comprehensive
longitudinal analyses of its determinants | 2019 ASCO annual meeting Abstracts, 2019. Available: https:// abstracts. asco. org/ 239/ AbstView_ 239_ 251173. html [Accessed 27 Aug 2019].
27 Lee H, Ahn R, Kim TH, et al. Impact of obesity on employment and wages among young adults: observational study with panel data. Int J Environ Res Public Health 2019;16:139.
28 Cavico FJ, Muffler SC, Mujtaba BG. Appearance discrimination in employment. Equal Div and Incl: An Int J 2012;32:83–119.
29 Caliendo M, Gehrsitz M. Obesity and the labor market: a fresh look at the weight penalty. Econ Hum Biol 2016;23:209–25.
30 Han E, Norton EC, Stearns SC. Weight and wages: fat versus lean paychecks. Health Econ 2009;18:535–48.
31 Roskam A- JR, Kunst AE, Van Oyen H, et al. Comparative appraisal of educational inequalities in overweight and obesity among adults in 19 European countries. Int J Epidemiol 2010;39:392–404.
32 Muenster E, Rueger H, Ochsmann E, et al. Association between overweight, obesity and self- perceived job insecurity in German employees. BMC Public Health 2011;11:162.
33 Spelten ER, Sprangers MAG, Verbeek JHAM. Factors reported to influence the return to work of cancer survivors: a literature review.
Psychooncology 2002;11:124–31.
34 de Boer AGEM, Taskila T, Ojajärvi A, et al. Cancer survivors and unemployment. JAMA 2009;301:753.
35 Paxton RJ, Phillips KL, Jones LA, et al. Associations among physical activity, body mass index, and health- related quality of life by race/ ethnicity in a diverse sample of breast cancer survivors. Cancer
2012;118:4024–31.
36 Makari- Judson G, Braun B, Jerry DJ, et al. Weight gain following breast cancer diagnosis: implication and proposed mechanisms.
World J Clin Oncol 2014;5:272–82.
37 Ligibel J. Lifestyle factors in cancer survivorship. J Clin Oncol
2012;30:3697–704.
38 Playdon M, Thomas G, Sanft T, et al. Weight loss intervention for breast cancer survivors: a systematic review. Curr Breast Cancer Rep
2013;5:222–46.
39 Muenster E, Rueger H, Ochsmann E, et al. Association between overweight, obesity and self- perceived job insecurity in German employees. BMC Public Health 2011;11:162.
40 Sheng JY, Sharma D, Jerome G, et al. Obese breast cancer patients and survivors: management considerations. Oncology
2018;32:410–7.
41 Di Meglio A, Michiels S, Jones LW, et al. Changes in weight, physical and psychosocial patient- reported outcomes among obese women receiving treatment for early- stage breast cancer: a nationwide clinical study. Breast 2020;52:23–32.
42 Saquib N, Flatt SW, Natarajan L, et al. Weight gain and recovery of pre- cancer weight after breast cancer treatments: evidence from the women's healthy eating and living (WHEL) study. Breast Cancer Res Treat 2007;105:177–86.
copyright.
on December 15, 2020 by guest. Protected by
1
Body weight and return to work among survivors of early-stage breast cancer.
Antonio Di Meglio, MDet al.
Supplementary data
Supplementary Table 1. Working conditions at breast cancer diagnosis.
Supplementary Table 2. Multivariable logistic regression of factors associated with non-return-to-work,
sensitivity analysis including late toxicity symptoms.
Supplementary Table 3. Associations between patient-reported quality of life at return to work
assessment and weight changes. Data are presented by baseline body mass index.
Supplementary Table4. Association of weight changes (continuous, difference from baseline) in
2
Supplementary Table 1. Working conditions at breast cancer diagnosis. Whole
cohort
By body mass index at breast cancer diagnosis
N (%) Under/Normal weight (<25 Kg/m2) Overweight/Obese (≥25 Kg/m2) p* Total 1869 (100) 1180 (63.1) 689 (36.9) Job position
Professionals and managers
Technicians and associate professionals Clerks Manual workers Self-employeda Missing 455 (24.6) 445 (24.0) 728 (39.3) 125 (6.7) 98 (5.3) 18 331 (28.4) 287 (24.6) 430 (36.8) 62 (5.3) 57 (4.9) 13 124 (18.1) 158 (23.1) 298 (43.6) 63 (9.2) 41 (6.0) 5 <.0001 Work sector Private Public Self-employed Other Missing 685 (39.4) 861 (49.5) 138 (7.9) 55 (3.2) 130 415 (37.7) 559 (50.8) 90 (8.2) 36 (3.3) 80 270 (42.2) 302 (47.3) 48 (7.5) 19 (3.0) 50 0.324
Type of job contract
Permanent position Fixed-term position Self-employed Other Missing 1386 (82.9) 102 (6.1) 69 (4.1) 115 (6.9) 197 861 (81.7) 71 (6.7) 40 (3.8) 82 (7.8) 126 525 (84.9) 31 (5.0) 29 (4.7) 33 (5.3) 71 0.089 Workload Full-time Part-time (<40 hours/week) Part-time (≥40 hours/week) Missing 425 (24.6) 983 (56.9) 319 (18.5) 142 272 (24.8) 612 (55.8) 213 (19.4) 83 153 (24.3) 371 (58.9) 106 (16.8) 59 0.337
Length of daily commuting
< one hour ≥ one hour Missing 1173 (65.3) 623 (34.7) 73 743 (65.3) 394 (34.6) 43 430 (65.2) 229 (34.7) 30 0.967
3
Supplementary Table 2. Multivariable logistic regression of factors associated with non-return-to-work, sensitivity analysis including late toxicity symptoms (N=1869).
Adjusted* Odds Ratio
95% Confidence Interval
p BMI at diagnosis (vs. Underweight/Normal)
Overweight/Obese 1.40 1.05 - 1.88 0.022
Age (continuous, 1-year increase) 1.01 0.98 - 1.04 0.496
Highest education level (vs. College graduate or higher)
Primary or lower High school 2.13 1.44 1.06 - 4.27 1.06 – 1.96 0.033 0.018
Household Income (vs. ≥3000 Euro/month)
<3000 Euro/month 1.26 0.94 - 1.68 0.123
Menopausal status (vs. premenopausal)
Postmenopausal 1.37 0.93 - 2.01 0.106 Comorbidities (vs. Charlson 0) Charlson 1+ 1.39 0.95 - 2.02 0.085 Anxiety (vs. Non-case) Doubtful Case 1.30 1.22 0.90 - 1.87 0.85 - 1.75 0.153 0.274 Depression (vs. Non-case) Doubtful Case 1.04 1.16 0.67 - 1.60 0.67 - 1.99 0.860 0.597
Smoking behavior (vs. Former/Never smoker)
Active smoker 1.44 1.04 – 1.99 0.029
Physical activity (Travel, leisure)
(continuous, 1-MET-hour/week increase) 0.99 0.99 - 1.00 0.275
Tumor stage (vs. I) II III 1.26 1.98 0.87 - 1.81 1.16 - 3.38 0.222 0.012
Breast surgery (vs. Partial surgery)
Mastectomy 1.40 1.01 - 0.95 0.049
Axillary surgery (vs. Sentinel lymph node)
Axillary dissection 1.09 0.75 - 1.59 0.647
(Neo)adjuvant chemotherapy (vs. No)
Yes 1.03 0.69 - 1.53 0.874
Adjuvant endocrine therapy (vs. No)
Yes 0.77 0.54 - 1.10 0.153
Adjuvant anti-HER2 therapy (vs. No)
Yes 1.80 1.24 - 2.61 0.002
Fatigue (continuous) 1.011 1.005 - 1.017 0.0005
Arm symptoms (continuous) 1.013 1.008 - 1.019 <.0001
Arthralgia (vs. No)
Any grade 1.079 0.80 - 1.46 0.621
Myalgia (vs. No)
Any grade 1.36 1.02 - 1.83 0.039
BMI= Body Mass Index; MET= metabolic-equivalent-of-task; HER2= human-epidermal-growth-factor-receptor-2. *for all factors in the Table.
4
Supplementary Table 3. Associations between patient-reported quality of life at return to work assessment and weight changes. Data are presented by baseline body mass index.
Domain Under/Normal weight Overweight/Obese
Weight stability/gain
Weight loss p* Weight stability/gain Weight loss p* Global Health Physical Function Emotional Function Social Function Cognitive Function Role Function Fatigue Pain Insomnia Nausea/Vomit Dyspnea Appetite Loss Constipation Diarrhea Financial difficulties Body Image Sexual Function Sexual Enjoyment Future Perspective Side Effects Breast Symptoms Arm Symptoms Upset by Hair Loss
67.59 88.45 68.94 85.12 74.27 84.40 36.72 25.68 42.37 4.60 15.93 8.13 17.32 6.56 9.31 75.29 36.71 61.84 58.39 17.56 19.75 22.63 40.55 63.78 86.87 63.69 80.76 69.05 81.12 41.27 29.59 48.45 8.16 14.29 14.29 19.39 9.52 14.63 77.89 34.40 60.32 54.98 18.12 20.49 29.34 47.06 0.065 0.066 0.048 0.020 0.038 0.048 0.033 0.113 0.098 0.015 0.515 0.006 0.484 0.262 0.076 0.221 0.395 0.879 0.310 0.528 0.919 0.018 0.451 64.42 83.73 70.40 82.99 75.39 78.34 38.75 33.61 44.47 5.42 22.76 5.24 14.10 9.58 9.93 69.93 31.22 57.54 57.17 19.88 23.88 27.03 41.95 65.46 87.55 68.92 87.00 74.50 82.33 37.78 28.00 44.00 6.33 14.00 10.33 18.18 9.33 6.80 80.25 34.88 59.68 52.67 18.18 19.19 25.83 41.27 0.693 0.015 0.924 0.146 0.762 0.110 0.668 0.048 0.955 0.533 0.001 0.007 0.260 0.295 0.416 0.0002 0.175 0.407 0.232 0.352 0.032 0.934 0.960 Quality of life scores are summarized using mean scores. Standard scoring algorithms were applied, with higher scores reflecting better quality of life for global health or functional scales and greater severity for symptoms. *Wilcoxon rank-sum test
5
Supplementary Table 4. Association of weight changes (continuous, difference from baseline) in multivariable logistic regression models.
Odds Ratio 95% Confidence Interval p Whole cohort
Weight change, continuous (1 percent unit increase) 1.01 0.99-1.03 0.1597 P for interaction weight change-by-BMI=0.036
Under/Normal weight
Weight change, continuous (1 percent unit increase) 0.99 0.97-1.02 0.808
Overweight/Obese
Weight change, continuous (1 percent unit increase) 1.03 1.01-1.06 0.030 Adjusted for age, menopausal status, comorbidities, education, income, smoking, stage, breast and axillary surgery, chemotherapy, endocrine therapy, anti-HER2 therapy, anxiety/depression, change in physical activity (travel, leisure). Weight changes modeled as continuous, odds ratios to be interpreted for one increasing percent-unit in weight from diagnosis.
![[PDF] Tutoriel pour avancé en Algorithmique en PDF | Cours informatique](data:image/gif;base64,R0lGODlhAQABAIAAAP///wAAACH5BAEAAAAALAAAAAABAAEAAAICRAEAOw==)