Publisher’s version / Version de l'éditeur:
Journal of Business and Technology, 1, 2005-10-01
READ THESE TERMS AND CONDITIONS CAREFULLY BEFORE USING THIS WEBSITE. https://nrc-publications.canada.ca/eng/copyright
Vous avez des questions? Nous pouvons vous aider. Pour communiquer directement avec un auteur, consultez la Questions? Contact the NRC Publications Archive team at
[email protected]. If you wish to email the authors directly, please see the first page of the publication for their contact information.
NRC Publications Archive
Archives des publications du CNRC
This publication could be one of several versions: author’s original, accepted manuscript or the publisher’s version. / La version de cette publication peut être l’une des suivantes : la version prépublication de l’auteur, la version acceptée du manuscrit ou la version de l’éditeur.
Access and use of this website and the material on it are subject to the Terms and Conditions set forth at
A text categorization approach for match-making in online business
tendering
Wang, Yue; Spencer, Bruce; Zhang, Huajie; Yan, Yuhong
https://publications-cnrc.canada.ca/fra/droits
L’accès à ce site Web et l’utilisation de son contenu sont assujettis aux conditions présentées dans le site LISEZ CES CONDITIONS ATTENTIVEMENT AVANT D’UTILISER CE SITE WEB.
NRC Publications Record / Notice d'Archives des publications de CNRC:
https://nrc-publications.canada.ca/eng/view/object/?id=8b1959ab-3981-494d-aae3-224a23c715de https://publications-cnrc.canada.ca/fra/voir/objet/?id=8b1959ab-3981-494d-aae3-224a23c715de
Title: A Text Categorization Approach for Match-Making in Online Business Tendering
Authors: Y. Wang, B. Spencer, H. Zhang, Y. Yan Y. Wang, H. Zhang
Faculty of Computer Science University of New Brunswick P. O. Box 4400, Fredericton
NB, E3B 5A3, Canada [email protected], [email protected]
B. Spencer, Y. Yan
Institute for Information Technology - eBusiness National Research Council of Canada
46 Dineen Drive, Fredericton NB, E3B 9W4, Canada
[email protected], [email protected]
Abstract: This paper investigates the application of text categorization (TC) in an eBusiness setting that exhibits a large number of target categories with relatively few training cases, applied to a real-life online tendering sys-tem. This is an experiment paper showing our experiences in dealing with a real-life application using the conventional machine learning approaches for TC, namely, the Rocchio method, TF-IDF (term frequency-inverse doc-ument frequency), WIDF (weighted inverse docdoc-ument frequency), and na¨ıve Bayes. In order to make the categorization results acceptable for industrial use, we made use of the hierarchical structure of the target categories and investigated the semi-automated ranking categorization.
Keywords: text categorization, machine learning, the Rocchio method, TF-IDF, WIDF, weighted inverse document frequency, na¨ıve Bayes classi-fier, ranking categorization.
Email address of contact author: [email protected] Phone number of contact author: (1-506)451-6931
1
Introduction
Knowledge organized hierarchically in ontologies is central to the design of the Semantic Web. Much Semantic Web research is focussed on what can be done with such organized knowledge. However, there are also interest-ing problems surroundinterest-ing the organizinterest-ing of real world items into ontologies. This paper outlines an eBusiness application, the New Brunswick Opportu-nities Network (NBON), an online tendering system, which has an ontology of product types at its core.
We first give the definitions of a few tendering terminologies that are relevant to our discussion. A vendor is a unit who sells goods or services. A purchasing agent is a buyer of any goods or service. A tender is a document that a purchasing agent publishes to announce his request for certain goods or services. The Goods and Services Identification Numbers (GSIN) is a hierarchically arranged set of codes that can classify a huge range of prod-ucts. This GSIN ontology is used in our application as a means to classify both tenders and vendors in terms of what they buy and sell respectively. It is via this ontology that effective match making between vendors and tenders is achieved. Currently, the incoming tenders are assigned a GSIN code by a human expert familiar with the GSIN system. We have completed a pilot study in automatically assigning a GSIN code to the tenders using previously coded tenders as training data. We have taken a few conven-tional machine learning approaches for TC in order to better understand our categorization problem. Our initial results are encouraging, especially for top-level categories and given that we have the option of presenting a ranked list of categories to a human indexer.
This paper is organized as follows. In Section 2 we give an introduction to NBON, the target tendering system of this paper. In Section 3 we examine four TC techniques, namely, the Rocchio method, TFIDF (term frequency-inverse document frequency), WIDF (weighted frequency-inverse document frequency), and na¨ıve Bayes. In Section 4 we show the experiment results on the NBON data using the four classifiers. In Sections 5 we discuss future and related work, conclude in Section 6.
2
The NBON System
NBON [15] is the official online tendering system of the province of New Brunswick, which went live in May 2002. The motivation of the system is
N66 - Instruments and Laboratory Equipment
N6665 - Hazard-Detecting Instruments and Apparatus N6665A - Detectors, Hazard
N6665AB - Detectors, Hazard, Concealed Weapon
Table 1: An example of GSIN codes and categories
to help vendors and purchasing agents find each other online through GSIN codes. The NBON system has a hierarchical structure for its categories and their corresponding GSIN codes. It consists of three super-level groups: goods, services, and construction services. Under the super-level groups, there are currently 15,913 categories grouped in up to four levels, each cor-responding to a unique GSIN code. Table 1 shows a typical example of a group of goods categories on the same path of the hierarchical structure and their corresponding GSIN codes.
The whole tendering and bidding procedure is similar to that of a tradi-tional one, i.e. a purchasing agent submits a tender to the government (now represented by the NBON system), which notifies the potential vendors, who can choose to bid. Then the purchasing agent chooses and announces the successful bidder. A vendor needs to electronically register with the NBON system to be recognised as a potential bidder. For this purpose, he needs to navigate the hierarchical structure of the categories of the NBON sys-tem to identify a category that properly describes his expertise. A vendor may choose to classify himself on any level of the structure, except for the super-level. A purchasing agent submits to the government a tender, which is then assigned a GSIN code by a human indexer, either the purchasing agent himself or an expert in the government. If there is more than one item in the tender, each item will be treated as a separate request, and is given a separate GSIN code.
Since we do not want to leave out any potential vendor, the notification strategy of the NBON system is to notify all the registered vendors that share a branch with the tender on the tree of GSIN codes, meaning the parent, children and siblings of the category node under which the tender is classified. The main reason behind such a strategy is that the manual categorization of the NBON system is not always reliable, therefore the sys-tem has to retrieve more vendors to be on the safe side. Recall that the vendors are self-classified, and since there are altogether 15,913 categories
in the NBON system, the vendors may self-classify too high in the hierar-chical structure, and thus the categorization result is less precise. The same thing happens to the human indexers, who, although more familiar with the categories, may not read the tender carefully or thoroughly enough to give each item the correct GSIN code.
The main problem with the current NBON system is the manual catego-rization of the tenders and the vendors, which both decreases the usability of the registration procedure of the system and increases the unreliability of notification. The motivation of this paper is to make the categorization process (semi-)automated using a machine learning approach, i.e. to learn from the historic data of the NBON system and use the learned knowledge to classify a new document. We start with the categorization of the tenders, because we can easily obtain the training data necessary for the learning ap-proach that we took in this paper: the tenders and their manually assigned categories from the past years are suitable training examples that we can feed to a computer program to build a classifier. In this paper, only the goods tenders are selected as the sample data. The goods group is more representative than the other two in terms of both overall quantity (there are 14,783 goods categories out of the total 15,913 categories) and number of levels. Therefore we chose the goods group for our initial investigation.
3
Text categorization of the tenders
The NBON sample data used in this paper consists of the goods tenders published in the system during the two years from 1 January 2001 to 30 November 2002. In the data set, there are altogether 4,822 goods tenders classified under 1,269 categories. The biggest tender contains 826 words, and the smallest only 1 word. The average number of words per tender is 31. Recall that a tender may have multiple items and thus is assigned multiple GSIN codes, one for each item. Having realized the potential mistakes in human indexing, the government only provided us with the first items of the multi-item tenders, which have a better chance to be correct, so as to improve the quality of the data. This means that we are dealing with a single-label TC problem in this paper, because a tender is assigned exactly one GSIN code.
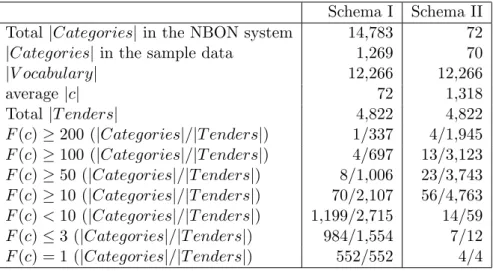
Table 2 reflects some statistical facts about the NBON sample data. We use |Categories| to denote the number of categories, |V ocabulary| to denote the number of distinct words, |c| to denote the number of words
Schema I Schema II
Total |Categories| in the NBON system 14,783 72
|Categories| in the sample data 1,269 70
|V ocabulary| 12,266 12,266 average |c| 72 1,318 Total |T enders| 4,822 4,822 F (c) ≥ 200 (|Categories|/|T enders|) 1/337 4/1,945 F (c) ≥ 100 (|Categories|/|T enders|) 4/697 13/3,123 F (c) ≥ 50 (|Categories|/|T enders|) 8/1,006 23/3,743 F (c) ≥ 10 (|Categories|/|T enders|) 70/2,107 56/4,763 F (c) < 10 (|Categories|/|T enders|) 1,199/2,715 14/59 F (c) ≤ 3 (|Categories|/|T enders|) 984/1,554 7/12 F (c) = 1 (|Categories|/|T enders|) 552/552 4/4
Table 2: Statistics of the NBON sample data
in a category c, |T enders| to denote the number of tenders, and F (c) to denote the frequency of the category c, which equals the number of tenders classified under c. We define two category schemas, Schema I denotes the categories at all levels as in a flat structure, and Schema II denotes the top-level categories in the hierarchical structure. Take Schema I for example, we see in Table 2 that there are 14,783 goods categories in the NBON system, in which 1,269 ones were observed in the sample data. There are 12,266 (preprocessed) distinct words in the data set, and the average number of distinct words per category is 72. There are 4,822 goods tenders in the data set, in which 1 category has no less than 200 tenders manually classified under it, and the actual number of tenders is 337; 4 categories have no less than 100 tenders, and the total number of tenders is 697; etc. In the last three rows of Table 2, we see that 1,199 categories have less than 10 tenders, 984 categories have less than 3 tenders, and 552 categories have exactly 1 tender.
We can identify three data sparseness problems in the sample NBON data in Schema I. Firstly, the number of categories is large, which is 1,269. It is intuitively obvious that the difficulty of a TC problem increases with the number of categories. Secondly, the number of the “sparse” categories (the ones with few tenders) is proportionally large. Such “sparse” categories are those in the last three rows of the table, which is 1199
finally, the proportion of the categories that are not covered in the sample data is large. Out of all the 14,783 goods categories of the NBON system, only 1,269 are covered by the sample data, which means the coverage of the sample data in terms of categories is only 8.58%. This will be a problem when the system under development is used in real life, because there is a great chance that it will encounter some categories that are not covered by the “learned knowledge” of the classifier.
Since the categories are organized in a hierarchical structure, we can classify a tender in a hierarchical manner, i.e. level by level. By doing so, we can solve the three above mentioned problems. First of all, the number of categories on each level is dramatically less than that of the total number of categories. Take the top-level for an example, which is Schema II in Table 2, there are only 72 categories in total, which is far more manageable than 14,782 as in Schema I. Second, the number of tenders in most categories is increased, because each category includes the tenders classified under their children categories. Third, the number of uncovered categories is dramatically decreased. The coverage rate is 70
72 = 97.22% in
Schema II.
As an initial investigation, our efforts in this paper were focused on the top-level categories. For now, such an approach is fine-grained enough for the TC task of the NBON system, whose notification strategy makes it sufficient to classify a tender high in the category hierarchy. It would be meaningless to blindly go further down the hierarchical category structure before we have a high confidence in the categorization results achieved on the higher level of the structure, because the categorization mistakes made on higher levels can not be recovered on lower levels [5], and thus the predicted category ends up being further away from the correct one on the tree of GSIN codes as the classifier goes lower on the hierarchical levels.
In this paper, we investigate four classifiers, namely, the Rocchio method, TFIDF, WIDF, and na¨ıve Bayes.
3.1 The Rocchio method
The Rocchio method originated from the relevance feedback of IR, and was first adapted to TC in 1994. It has since been used by many researchers as a baseline classifier [19]. We also use the Rocchio method as a baseline algorithm in this paper.
The Rocchio method is a linear classifier consisting of a “profile” vector for each category in the form ~c = (R1, ..., R|c|), with each Ri representing
the weight of a word w in c as defined in Equation (1). Rocchio(w, c) = β · X di∈P OSc T F (w, di) |P OSc| − γ · X di∈N EGc T F (w, di) |N EGc| , (1) where T F (w, di) is the frequency of w in document di, |P OSc| is the number
of documents with label c, and |N EGc| is the number of documents with
labels other than c. In this paper, we followed [4] to set the weight para-meters to β = 1 and γ = 01
, meaning that the function is simply a weight averaged over the positive documents.
In TC, a document is usually represented as a term vector ~d = (dw1, ..., dw|d|),
with terms typically identified by the words in the document, and dwi
de-notes the frequency of each distinct word in d. When classifying a document d, which is a tender in our case, similarity is compared between the vector ~d and the profile vector ~c of each category c, using a linear similarity function Sim(d, c) (see Equation (2)), which is the dot product of the two vectors [12]. And the classifier assigns d to “the most similar” category.
Sim(d, c) = d · ~c~ = |d| X i=1 di· ci = X w∈d dw· Rocchio(w, c) (2) 3.2 TF-IDF classifier
Term frequency-inverse document frequency (TF-IDF) is a traditional algo-rithm originally used in IR that measures the relevance by the product of T F and IDF . The weight of a word in a document is jointly determined by its frequency in the document and its frequency in all the documents. The IDF term can be viewed as a penalty to the ubiquitous words that do not tell much about any document. TF-IDF is not a standard TC technique, we include it in this paper mainly because of its close relation with WIDF that is to be discussed in Section 3.3.
1We also followed other researchers to deemphasize the role of negative documents by
setting β = 16 and γ = 4 [2, 7, 8], and the categorization results were worsened. Variations of β and γ values were tried out on the NBON sample data, and the best results were achieved by simply ignoring the negative documents.
The TF-IDF weight of a word w in a document d is given in Equation (3).
T F IDF (w, d) = T F (w, d) · IDF (w) = T F (w, d) · log( |D|
DF (w)), (3)
where T F (w, d) denotes the frequency of w in d, |D| denotes the total num-ber of the training documents, and DF (w) is the numnum-ber of documents that contain w.
When adapted to TC, the IDF terms are typically computed on cat-egories, which are represented as bags of documents that are labelled with the same category [20]. The categorization criterion is similar to that of the Rocchio method in Equation 2, with Rocchio(w, c) being replaced by T F IDF (w, c).
3.3 WIDF classifier
Tokunaga and Iwayama [20] pointed out a problem with IDF (w), which is that if a word is contained in all the documents, no matter what its frequency distribution is like, the weight of such a word in all the documents will be zero, because the IDF (w) value is zero. The improperness of such an approach is illustrated in the example shown in Table 3 [20], where both IDF (wx) and IDF (wy) are equal to 0, because they both occur in all the
documents, and thus both words will get a zero weight for all the documents, although the frequency distributions of wx and wy are very different. The
reason for this situation is that IDF considers only whether or not a word is contained in a document, but not its frequency in the document.
To address this problem, Tokunaga and Iwayama developed a weighted inverse document frequency (WIDF) classifier which is defined as in Equa-tion (4). Since WIDF has already taken T F (w, d) into account, the weight of a word w in a document d is simply its W IDF value.
W IDF (w, d) = PnT F (w, d) i=1T F (w, di)
(4) Now, the W IDF values of the two words in the above example would be different. For instance, according to Table 3,
W IDF (wx, d2) =
50
2 + 50 + 3 + 2 + 4 = 50
d1 d2 d3 d4 d5 .. . ... ... ... ... ... wx 2 50 3 2 4 wy 3 2 3 2 3 .. . ... ... ... ... ...
Table 3: A TF-IDF example with a 5-document data set [20] and W IDF (wy, d2) = 2 3 + 2 + 3 + 2 + 3 = 2 13 ≈ 0.15. (6)
To be consistent with the other TC techniques in this paper, we used TCC (Text-to-Category Comparison) in [20] in our experiments, which takes a bag-of-documents approach to represent the categories. And for classifica-tion, new documents are compared with the category representations using the linear similarity function in Equation (2), with Rocchio(w, c) being re-placed by W IDF (w, c).
3.4 Na¨ıve Bayes classifier
Na¨ıve Bayes is a popular technique for TC tasks owing to its simplicity and effectiveness [14]. It is a probabilistic classifier, in which the relevance of a category c to a document d is based on its conditional probability given d, and d is assigned to “the most probable” category based on this probability value.
The probability of a category c given a document d is computed according to Bayes rule as in Equation (7).
P (c|d) = P (d|c) · P (c)
P (d) (7)
If the words in d are mutually independent, Equation (7) can be rewritten as Equation (8), where the P (d) term is dropped because it is a constant.
P (c|d) ∝ P (c) · Y
w∈d
Na¨ıve Bayes assumes such independent relations between words in a text (and thus the name “na¨ıve”). Although this assumption is rarely true, na¨ıve Bayes performs surprisingly well for TC tasks [14].
In Equation (8), P (c) can be easily obtained by the proportion of the number of tenders assigned category c divided by the total number of ten-ders, and we compute P (w|c) terms as in Equation (9), which is Lidstone’s law of succession [1].
P (w|c) = F (w, c) + λ
|c| + λ · |V ocabulary|, (9)
where F (w, c) denotes the frequency of word w in category c, and λ is a variable, whose value was set to be 0.1 in this paper, because it was optimal for the NBON sample data by experimentation. The reason for introducing a λ variable is to smooth out the zero counts (i.e. F (w, c) = 0). Unlike the previous three algorithms which sum up the weights, na¨ıve Bayes multiplies P (w|c) terms, and thus a single zero count will cause P (w|c) to be zero, and so is P (c|d) in turn, if no smoothing is applied. There are two types of zero counts, one is that w was not observed in the category c, and this case is cared by Lidstone’s law of succession; the other is that w was not observed in any category in the training data, this is also referred to as a missing value or unknown, and we follow [9] to simply ignore the missing values in this paper.
4
Experiments on the NBON data
The tenders were preprocessed using a stop word list from the Defense Vir-tual Library [6] consisting of 456 words and the Porter’s stemming algorithm [17]. We also tried using smaller stop word lists and a restrictive version of Porter’s stemmer, and the differences on the categorization results are in-significant.
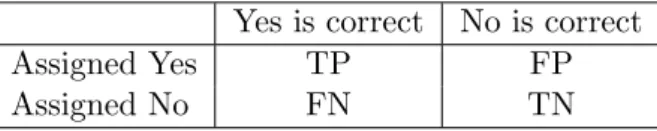
Precision and recall are two standard measures of effectiveness in IR. Precision is the proportion of the retrieved documents that are relevant, and recall is the proportion of the relevant documents that are retrieved. Precision and recall were adapted to TC, and their computations are based on a contingency table (see Table 4) that reflects the categorization decisions made by a classifier and the expert judgements on the decisions. The cate-gorization results are denoted by T P (number of true positive), F P (number of false positive), T N (number of true negative) and F N (number of false
Yes is correct No is correct
Assigned Yes TP FP
Assigned No FN TN
Table 4: A 2 × 2 contingency table negative).
Precision and recall are defined in Equations (11) and (12) respectively. We took the microaveraging approach in [19] for the computation. Preci-sion and recall are two conflicting measures, therefore classifiers are usually evaluated by a combination of the two. An exception is the single-label TC, in which precision and recall are dependent on each other, therefore either can be used alone for evaluation [19].
In this paper, we use recall to measure the effectiveness of the classifiers2
. This naturally follows our discussion in Section 2 that leaving out a tender is much more serious than a false notification of a tender, i.e. FN is less de-sirous than FP, meaning that a high recall is more important to the system. Although precision and recall are equivalent at this stage, they differ in a ranking categorization system that is to be discussed soon, therefore we use recall here to keep the consistency in later comparisons.
precision = T P
T P + F P (11)
recall = T P
T P + F N (12)
We used 20-fold cross-validation to train and test the classifiers. The 4,822 tenders in the NBON sample data were partitioned into 20 subsets of equal length, with 19 subsets served as the training data and 1 subset was
2In the case of single-label TC, the microaveraged precision and recall are both
equa-valent to accuracy, when the latter is intuitively defined as in Equation (10) [20]: A=the number of documents that are correctly classified
total number of testing documents (10) This is different from the TC definition of accuracy, which is A = T P +T N
T P +F P +F N +T N,
and is greater than the value obtained in Equation (10). Since we are dealing with a TC problem in this paper, we follow the TC convention to address to our effectiveness measure as recall, to avoid confusion.
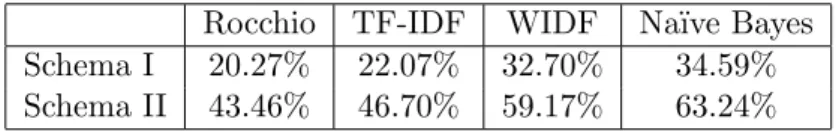
Rocchio TF-IDF WIDF Na¨ıve Bayes
Schema I 20.27% 22.07% 32.70% 34.59%
Schema II 43.46% 46.70% 59.17% 63.24%
Table 5: Recalls of the four classifiers on the two NBON category schemas left out for testing. The system runs 20 times so that each subset gets a chance to be tested, and the final recall was averaged over the 20 results.
Table 5 shows the categorization results obtained on the two category schemas of NBON. We can see that, as we expected, the WIDF and na¨ıve Bayes classifiers achieved the higher recalls, and a significant improvement of Schema II (the top-level categories) over Schema I (categories on all levels in a flat structure) is accomplished. Recall from Section 3 that Schema I suffers serious sparseness problems, and by working with Schema II, we circumvented these problems. Whereas a recall of 30 percentage points on Schema I is of no use, that of 60 percentage points on Schema II is close to a reasonable result for the research purpose. Although the categorization results on Schema II are less precise than those on Schema I, according to our discussions in Sections 2 and 3, this is fine-grained enough because the notification strategy of the NBON system makes it sufficient to classify a tender high in the hierarchy.
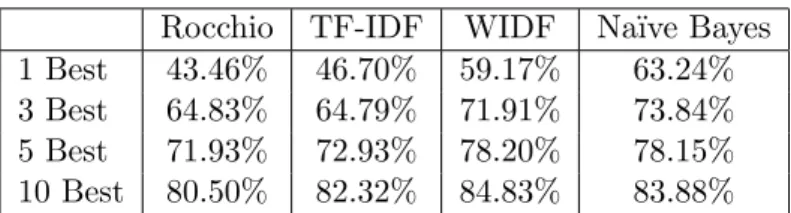
Unfortunately, a recall of 60 percentage points is still unacceptable for industrial use. Therefore we developed an interactive ranking system to return the N best categories ranked high by the classifiers, and allow the users to choose the target out of them. Table 6 shows the improvement on Schema II achieved by returning the “N -best” categories. We see that at the level of 10-best, the recall of each classifier is increased from 20 to 37 percentage points. We stopped our experiments at the level of 10-best because some studies of searching behaviour have shown that users tend to give up if a target is not found in the first ten hits [22].
It certainly would be preferable to have a fully automated categoriza-tion procedure, but when the “1-best” prediccategoriza-tion of a classifier is not very reliable, such automation is fairly meaningless. In such a case, it pays off to put the final decision in the hands of a human user. In our case, this will also give users a chance to classify their tenders under multiple categories, which is desirable in some cases, such as when they have various requests in one tender, and/or when they want to know about other potentially relevant
Rocchio TF-IDF WIDF Na¨ıve Bayes
1 Best 43.46% 46.70% 59.17% 63.24%
3 Best 64.83% 64.79% 71.91% 73.84%
5 Best 71.93% 72.93% 78.20% 78.15%
10 Best 80.50% 82.32% 84.83% 83.88%
Table 6: Recalls of the four classifiers on Schema II for the ranking catego-rization
categorizations for their tenders. A major advantage of involving users in the categorization procedure is to increase the recall on the top-level and thus allow the finer grained categorization in future phases.
5
Future and related work
The recalls achieved in this paper were based on the top-level categories. Although we have assumed that it is sufficient to classify tenders high in the hierarchy, it is preferable to classify both tenders and vendors as pre-cisely as possible. In addition, by classifying tenders and vendors low in the hierarchy, we will have more flexibility in modifying the notification strat-egy when necessary. In the next step, we will investigate the hierarchical categorization on all levels. Classifying documents into a hierarchical struc-ture of categories have been previously studied [3, 5, 10, 11, 13, 16, 18, 21]. Most research results showed limited improvement of hierarchical catego-rizations over the flat ones, except the work done by McCallum et al. [13], who showed a significant improvement of 29%. They used a na¨ıve Bayes classifier, and adopted the statistical shrinkage technique to smooth the pa-rameter estimates of sparse children categories with their parents. Dumais and Chen’s work [5] was also interesting in the sense that they have shown that higher-level categorization mistakes cannot be recovered on lower lev-els by simply combining the estimates of the parent and the child category nodes. We believe that, in order to benefit from the hierarchical structure of categories, intrinsic relations between categories on the same branch of the hierarchy must be discovered and reflected in the computations.
In this paper, we were working with goods tenders only. In the next phase, we plan to expand the applicability of the current work to services as well as goods, and to vendors as well as tenders.
6
Conclusion
New Brunswick’s online tendering system organizes tenders into a set of categories arranged in a hierarchy of goods and services. Each category has a unique GSIN code. Whenever a new tender is open for bidding, a code is selected for it. Vendors select codes of interest, and they are notified electronically only if their selected code shares a branch with the code selected for the new tender. Thus selecting appropriate codes is vital to both the purchasing agent and the vendor. Our TC system (semi-)automates code selection for tenders, using historical data.
This work is significant for its effect in the application domain. Cur-rently the live NBON system does not incorporate a text categorizer, and so end-users need to select from among the 15,913 different categories. While experienced users can select codes quickly, non-experts including members of the general public, must navigate the hierarchy to select an appropriate code. If text categorization methods can reduce this to a selection from among 10 choices, much human time can be saved every day.
Our work is ongoing, but so far we have found that the na¨ıve Bayes approach applied to text categorization is appropriate for this task. We plan to do more experiments with Bayesian networks and to investigate other techniques. Besides describing our experiences with a real world application, this paper also serves to bring together ideas from different spheres: na¨ıve Bayes applied to the Semantic Web, and na¨ıve Bayes applied to e-business applications.
References
[1] Agrawal, R., R. Bayardo and R. Srikant. 1999. Athena: Mining-based Interactive Management of Text Databases. Research Report RJ10753, IBM Almaden Research Center, San Jose, CA95120.
[2] Cohen, W.W. and Y. Singer. 1996. Context-sensitive learning meth-ods for text categorization. In Proceedings of SIGIR-96, 19th ACM In-ternational Conference on Research and Development in Information Retrieval.
[3] D’Alessio, S., M. Murray, R. Schiaffino and A. Kershenbaum. 1998. Category Levels in Hierarchical Text Categorization. In Proceedings of
EMNLP-3, 3rd Conference on Empirical Methods in Natural Language Processing.
[4] Dumais, S., J. Platt, D. Heckerman and M. Sahami. 1998. Inductive Learning Algorithms and Representations for Text Categorization. In Proceedings of CIKM-98, 7th ACM International Conference on Infor-mation and Knowledge Management, 148-155.
[5] Dumais, S. and H. Chen. 2000. Hierarchical Classification of Web Con-tent, In Proceedings of SIGIR-00, 23rd ACM International Confer-ence on Research and Development in Information Retrieval, Athens, Greece, 256-263.
[6] Defense Virtual Library / Verity Stop Word List. http://dvl.dtic.mil/stop list.html
[7] Ittner, D.J., D.D. Lewis and D.D. Ahn. 1995. Text categorization of Low Quality Images. In Proceedings of SDAIR-95, 4th Annual Symposium on Document Analysis and Information Retrieval, Las Vegas, NV, 301-315.
[8] Joachims, T. 1997. A Probabilistic Analysis of the Rocchio Algorithm with TFIDF for Text Categorization. In Proceedings of ICML-97, 14th International Conference on Machine learning, Nashvile, TN, 143-151. [9] Kohavi, R., B. Becker and D. Sommerfield. 1997. Improving Simple Bayes. In Proceedings of the European Conference in Machine Learning. [10] Koller, D. and M. Sahami. 1997. Hierarchically Classifying Documents Using Very Few Words. In Proceedings of the 14th International Con-ference on Machine Learning, Nashville, TN, 170-178.
[11] Larkey, L. 1998. Some Issues in the Automatic Classification of U.S. Patents. In Working Notes for the AAAI-98 Workshop on Learning for Text Categorization.
[12] Lewis, D.D., R.E. Schapire, J.P. Callan and R. Papka. 1996. Train-ing Algorithms for Linear Text Classifiers. In ProceedTrain-ings of SIGIR-96, 19th ACM International Conference on Research and Development in Information Retrieval, Z¨urich, Switzerland, 298-306.
[13] McCallum, A., R. Rosenfeld, T. Mitchell and A.Y. Ng. 1998. Improving Text Classification by Shrinkage in a Hiearchy of Classes. In Proceedings 15th International Conference on Machine Learning, San Francisco, CA, 359-367.
[14] Mitchell, T.M. 1996. Machine Learning. The McGraw-Hill Companies, Inc., New York.
[15] New Brunswick Opportunities Network. https://nbon-rpanb.gnb.ca [16] Ng, H.T., W.B. Goh and K.L. Low. 1997. Feature Selection, Perceptron
Learning and a Usability Case Study for Text Categorization. In Pro-ceedings of SIGIR-97, 20th ACM International Conference on Research and Development in Information Retrieval, Philadelphia, PA, 67-73. [17] Porter, M.F. 1980. The Porter Stemming Algorithm.
http://www.tartarus.org/∼martin/PorterStemmer
[18] Ruiz, M.E. and P. Srinivasan. 1999. Hierarchical Neural Networks for Text Categorization. In Proceedings of SIGIR-99, 22nd ACM Interna-tional Conference on Research and Development in Information Re-trieval, Berkeley, CA, 281-282.
[19] Sebastiani, F. 2002. Machine Learning in Automated Text Categoriza-tion. ACM Computing Surveys, Vol.34, No.1, March 2002, pp.1-47. [20] Tokunaga, T. and M. Iwayama. 1994. Text Categorization Based on
Weighted Inverse Document Frequency. Technical Report 0918-2802, Department of Computer Science, Tokyo Institute of Technology, Tokyo, Japan
[21] Weigend, A.S., E.D. Wiener and J.O. Pedersen. 1999. Exploiting Hier-archy in Text Categorization. Information Retrieval, l(3), 193-216. [22] Woods, W.A., L.A. Bookman, A. Houston, R.J. Kuhns, P. Martin
and S. Green. 2000. Linguistic Knowledge can Improve Information Retrieval. Technical Report No. TR-99-83, Sun Microsystems Labora-tories, Burlington, MA.
![Table 3: A TF-IDF example with a 5-document data set [20]](https://thumb-eu.123doks.com/thumbv2/123doknet/14182349.476517/10.892.355.560.217.343/table-tf-idf-example-with-document-data-set.webp)