Architecture and Evolutionary Stability of Yeast Signaling Pathways by
Jeffrey S. Gritton B.S. Physics University of Utah, 2002
Submitted to the Department of Biology
in Partial Fulfillment of the Requirements for the Degree of Master of Science in Biology
at the
Massachusetts Institute of Technology September 2006
C Massachusetts Institute of Technology All rights reserved
Signature of Author:
Department of Biology August 11, 2006
Certified by:
Drew Endy ofessor of Biological Engineering Thesis Supervisor Accepted by: MASSACHUSE S E OF TECHNOLOGY SEP
13
2006
8RABPRIES
Stephen P. Bell Professor of Biology Chairman, Committee for Graduate StudentsARCHNVES
Y
---~4
Architecture and Evolutionary Stability of Yeast Signaling Pathways by
Jeffrey S. Gritton
Submitted to the Department of Biology on August 11, 2006 in Partial Fulfillment of the
Requirements for the Degree of Master of Science in Biology Abstract
I have researched the effect that selection for the function of the High Osmolarity Glycerol (HOG) pathway has on the evolutionary stability of the pheromone response pathway in the yeast Saccharomyces cerevisiae. I first set out to demonstrate that,
because the pheromone and HOG response pathways share protein components, selection for HOG function will enrich a population for cells capable of pheromone response. I performed experiments in both continuous and batch culture to demonstrate this effect. I then characterized the decay of the pheromone response pathway first, by measuring its mutation rate and second, by measuring the fitness of a series of strains with pheromone response gene deletions. I conclude with thoughts on possible experiments that may be used to further this research.
Thesis Supervisor: Drew Endy
Acknowledgements
I wish to thank my advisor Drew Endy for his wisdom and understanding. The Endy Lab for teaching me how to do science. And especially my wonderful wife Amy and our children Oliver and Emma for putting some fire in my belly.
Table of Contents
Title Page... ... 1
Abstract ... ... 2
List of Figures ... 5
Chapter 1: Introduction ... 6
Dem and Theory... ... ... 6
M odularity ... ... 7
Experim ental System ... 9
Chapter 2: Experim ents ... ... 12
Continuous Culture Experim ents ... ... 12
Batch Culture Experim ents... 16
M easuring M utation Rate ... 20
M apping of M utants ... 24
M easuring Fitness of M utants... 26
Chapter 3: Future W ork... ... 31
References ... 37
Appendix A: Chemostat Design and Steady State... ... 39
Parts List ... ... 43
Appendix B: Strains and M edia... 44
Strains Used in This Study ... 44
List of Figures
Figure 1: Pheromone response pathway... ... ... 10
Figure 2: High osmolarity glycerol pathway... ... 10
Figure 3: Fraction of cells that are mutant versus time in chemostat cultures. ... . 15
Figure 4: Batch culture experimental methodology... 17
Figure 5: Batch culture results ... ... 19
Figure 6: Mapping of pheromone response mutants using complementation tests...25
Figure 7: Batch culture fitness results ... ... ... 28
Figure 8: Fitness of a stel 1 mutant in the chemostat ... 29
Figure 9: M odel of pheromone response decay... 33
Figure 10: Engineering of component sharing ... ... 35
Figure A. 1: Chemostat with two reactors ... ... 39
Figure A.2: Schematic of a chemostat reactor... ... 40
Chapter 1: Introduction
There has been much recent interest in studying molecular biology at a "systems level." Researchers are attempting to combine knowledge of the molecular components and mechanisms of biological systems into models that depict the behavior of the system. Such models have been made for chemotaxis in bacteria, segmentation in fruit fly
development and other systems (e.g. Alon et al., 1999; von Dassow et al., 2000). Systems level research holds the promise of deepening our understanding of living organisms as well as allowing greater insight into possible interventions that affect the function of organisms in a desired manner. Concordant with the modeling of individual systems has been the development of interest in understanding the general architecture of evolved molecular systems (Hartwell et al., 1999). Several design principles have been proposed, some of which are introduced here.
Demand Theory
One principle, first proposed by Michael Savageau (1974), is called "Demand Theory." In Demand Theory a population of cells is said to alternate between
environments where expression of a given gene is required to be either high or low. Savageau argues that for a gene that spends the majority of its time in an environment where demand for the expressed gene is high, a mode of regulation that relies upon an activator will be more stable in the presence of mutation and selection. This is because a repressor would experience no selection for function during the majority of time that the gene is in a high demand environment and would be subject to mutation and genetic drift while an activator would experience positive selection during that time. Similarly,
repressor-based regulation will be more stable when controlling a gene that typically is in a low demand environment. Savageau states that one can predict the mode of regulation of a gene based on how the cell's time is divided between low and high demand
environments. Savageau's arguments are compelling but no experiments have yet been done to show that positive and negative modes of regulation are more stable in
predominantly high demand and low demand environments, respectively (Savageau, 1974, 1998a, 1998b).
Modularity
More recently, "modules" have been proposed as units of biological evolution (Hartwell et al., 1999). A module is a set of interacting molecules that can perform a given function independent of other components in a cell. Modularity is intellectually pleasant as it allows one to break the cell into smaller systems that are more amenable to study. Modularity might also give functional benefits to the cell. For example, modularity could allow the cell to transmit a specific stimulus to a specific response without
activating other extraneous pathways. In addition, modularity may increase the proportion of mutations that are beneficial to the cell (Hansen, 2003). There has been some work showing that modularity can be evolved in computational experiments (Lipson et al., 2002; Kashtan and Alon, 2005). But, as with Demand Theory, the experimental work has not been done to show that evolution respects the boundaries of modules-that a module's core function remains intact while its interactions with other modules are evolved.
Indeed there are many examples where modularity seems to break down, where a given protein component is used in multiple contexts (a condition known as pleiotropy) and doesn't appear to respect module boundaries. Some examples include Cytochrome C which is important in the electron transport chain in mitochondria and also acts as a signal carrier in apoptosis (Copley, 2003), and ATF2 which is a transcription factor involved in stress response that also has a poorly understood function in DNA damage response (Bhoumik et al., 2005). Pleiotropy is seen often enough that it "may be the rule rather than the exception in higher organisms" (Hodgkin, 1998).
Several explanations can be proposed for why component sharing is beneficial. A protein's specific function may be useful in more than one context. For example the valine and isoleucine biosynthetic pathways share many of the same enzymes-the same enzymatic activities are used on different substrates in each of the two cases. Or a component that is shared between two modules may inform one module about the activity of the other. It is thought that new functions may evolve by genetic duplication and divergence (Zhang, 2003) and it is possible that component sharing may be present at intermediate stages of such evolution. Another possible hypothesis is that component sharing may be used to confer evolutionary stability on the shared component due to its function being selected for in more than one context. This is the hypothesis that we have developed and chosen to study further in our work. In particular we are studying how selection for the function of the high osmolarity glycerol pathway in Saccharomyces cerevisiae will select against certain mutations in the pheromone response pathway.
Experimental System
The yeast Saccharomyces cerevisiae can exist in both haploid and diploid states. Diploid cells undergo meiosis in response to nitrogen limitation to create spores and eventually haploid cells of two mating types (MATa and MATa). Haploid cells of one mating type respond to mating pheromone from the other by undergoing cell cycle arrest, morphological changes, and the eventual fusion of the two cells to form a diploid.
The pheromone response pathway is used during mating (Figure 1). The remainder of the time it is presumably unused and subject to mutation and genetic drift. It is believed that yeast sporulation and mating, and the genetic recombination that results, allows cells to adapt more readily to a changing environment and that this increased adaptability provides selection for the function of the pheromone response pathway over long
timescales (Wolf et al., 1987).
The high osmolarity glycerol (HOG) pathway allows cells to survive changes in external osmolarity by regulating the concentration of glycerol in the cell. When external osmolarity increases, two osmosensing membrane proteins pass partially redundant
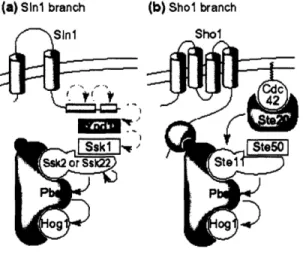
signals to the MAPKK Pbs2p, which leads to the activation of transcription factors and a resulting increase in glycerol synthesis (Figure 2).
A group of four proteins (Cdc42p, Ste20p, Ste50p and Stel ip) are shared between the HOG and pheromone response pathways. Upon removal of one of the redundant HOG pathways, by deleting SSK2 and SSK22, these four proteins become essential for HOG response.
In a growing culture pheromone response mutants accumulate over time as determined by the mutation rates of the components in the pathway and the relative
Figure 1: Pheromone response pathway.
Alpha factor binds to Ste2p, which leads to the dissociation of the G protein. GP3y recruits Ste5p to the membrane, which results in the phosphorylation of the MAPKKK Stel ip. Subsequent phosphorylation steps result in the MAPK Fus3p phosphorylating the transcription factor Stel2p (not shown). Localization of active Ste 1l2p to the nucleus
results in cell cycle arrest and morphological changes in anticipation of cellular fusion and diploid formation. (Adapted from O'Rourke et al., 2002)
Ste2
Figure 2: High osmolarity glycerol pathway.
Upon a shift to high osmolarity, osmosensors Slnlp and Sholp indirectly activate their respective MAPKKKs via phosphorylation. The MAPKKKs phosphorylate the MAPKK Pbs2p, which in turn phosphorylates the MAPK Hoglp. Phosphorylated Hoglp is translocated to the nucleus and shows an increased kinase activity. Activation of the HOG pathway leads to an increase in intracellular glycerol that prevents cellular dehydration in a high osmolarity environment. (Adapted from O'Rourke et al., 2002)
(a) Sini branch (b) Shol branch
Shol
/
fitness of the different pheromone response mutants. After a given time a certain fraction of the population will be unable to respond to pheromone due to mutations in the
pheromone response pathway. These mutated genes would presumably include the shared components mentioned above. Now imagine that the population is subjected to a
selection for HOG function by the addition of NaCl to the media. Most cells would be able to adapt through increased production of intracellular glycerol. But some cells, including those pheromone response mutants that have mutations in the components that are shared between HOG and pheromone response would be unable to divide and would be lost from the population. The net result would be an increase in the proportion of cells that are able to respond to pheromone as a consequence of the selection for HOG
function, a putatively unrelated function within the cell.
This result is fully what one would expect based on what is known about the genetics of the two systems. Here I am attempting to demonstrate that this effect can indeed be observed and to get some idea of the magnitude and relevance of any observed effect on the evolutionary stability of the yeast pheromone response pathway.
Chapter 2: Experiments
I first set out to demonstrate that selection for proper HOG function enriches a population of yeast for cells that also contain a functional pheromone response pathway. Initially I chose to do this in a chemostat where I hoped to measure the rate of
accumulation of pheromone response mutants and to show that the rate decreased upon the addition of a periodic selection for HOG function. Unfortunately I was unable to determine the rate of mutant accumulation with sufficient accuracy in the chemostat so I proceeded with a more direct demonstration of the phenomena using batch culture experiments.
I then set out to characterize the decay of the pheromone response pathway by first measuring the mutation rate for the pathway as a whole and second for just the
shared components. Finally, I measured the fitness of a set of pheromone response mutants relative to their parent wild-type strain.
Continuous Culture Experiments
I built a chemostat to investigate the effect of HOG selection on the proportion of cells that are capable of pheromone response (Novick and Szilard, 1950). The device was
constructed from off the shelf parts at a price significantly less than available commercial systems (Appendix A). The chemostat allows one to monitor the number of mutants over time and consequently to see, in this case, how imposing a selection for HOG pathway function might affect the proportion of cells that can respond to pheromone.
In a chemostat, media flows in with a dilution rate, co, and media and cells flow out of the chemostat at the same rate. A constant reactor volume is maintained and cell
growth reaches a steady state where the growth rate, a, equals the dilution rate, w. As long as the number of mutant cells is much less than the number of normal cells, the rate of accumulation of mutants in a chemostat can be described by (Kubitschek, 1970):
dm
dt- =- n + (a * -a)m
where:
m = mutant cell concentration [cells/mL]
[ = mutation rate from normal to mutant [mutations per cell per hour] n = total cell concentration [cells/mL]
a* = mutant cell growth rate Ihr-']
a = normal cell growth rate, equal to the dilution rate (w) [hr' ]
which can be solved to give (for a* • a):
m(t) = moe *- + (e - 1)
a *-a
If a* = a the fraction of cells that are mutant will increase linearly with time and the slope will give the mutation rate. If a* o a then the relationship is described by the more complicated exponential shown above. a*-a can be measured using competition
experiments either in a chemostat (Dykhuizen and Hartl, 1983) or in batch (Lenski, 1991) and this value can be used with the above equation to find the mutation rate.
The above model has been confirmed experimentally in both bacteria and yeast (Novick and Szilard, 1950; Paquin, 1982) but in each case the experimenters monitored the accumulation of mutants at one locus. I am aware of no experiments that have looked
at the accumulation of mutants in a multigenic pathway. My first set of experiments was to see how pheromone response mutants accumulate over time in the chemostat and to
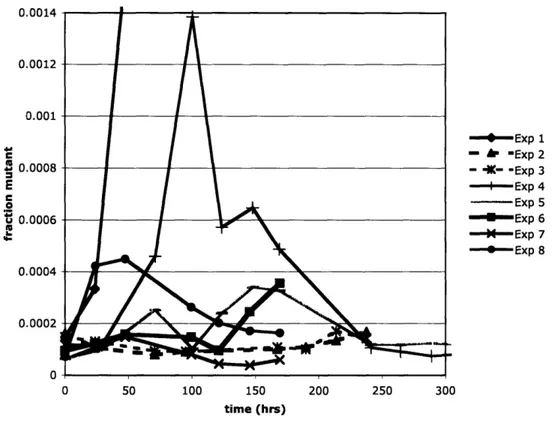
I used the following method to assess the accumulation of pheromone response mutants over time in the chemostat. I inoculated a culture containing the media to be used in the chemostat with strain EY0204 and allowed the culture to reach log phase growth. I then concentrated the culture to approximately the eventual chemostat steady state OD60 of 1.3 and inoculated the chemostat with 20 mL (the reactor volume) of the concentrated culture. At various time points during each chemostat run I sampled the chemostat by withdrawing approximately 1 mL. I diluted a fraction of the sample 10,000 fold and plated 100 [tL on YPD to get a total cell density (cfu/mL). I then plated 100 [tL of the undiluted sample on each of three YPD plates with 100 [tM alpha factor. In the presence of alpha factor wild-type cells arrest in preparation for mating, so colonies that grew on plates with alpha factor represent likely mutants in the pheromone response pathway. Over time wild-type cells will acclimate to the pheromone and resume growth and form colonies. Because of this I set an arbitrary time cutoff and counted all visible colonies after 24 hours at 300C to determine the concentration of pheromone response mutants. At each sampling time point I divided the estimate of the number of pheromone response mutants by the estimate for the total cell concentration to get the fraction of cells that are mutant. I then plotted the fraction of cells that are mutant versus time (Figure 3).
It is clear that there are some experiments in which the fraction of cells that are mutant changed in a complicated manner. Specifically one run showed an exponential increase in the fraction of cells that were mutant over time, and another showed a dramatic increase in the fraction of cells that were mutant followed by an equally dramatic decrease. Despite these outliers the general trend is consistent with a scenario where the mutants have a lower fitness than the wild-type cells. In that case the fraction
Figure 3: Fraction of cells that are mutant versus time in chemostat cultures.
All 8 chemostat experiments were performed with EY0204 grown at 300C with a reactor
volume of 20 mL. Solid lines denote growth in Synthetic Complete (SC) media with 0.08% glucose (Appendix B) at a dilution rate of 0.2 hr-. Dashed lines (Experiments 2 and 3) indicate growth on phosphate limited SD media (Appendix B) with a dilution rate of 0.12 hr- . 0.0014 0.0012 0.001 0.0008 E C 0.0006 0.0006 0.0004 0.0002 0 - Exp 1 =- hr Exp 2 - IK- -Exp 3 - Exp 4 - Exp 5 -- Exp 6 -M--Exp 7 -*-*Exp 8 0 50 100 150 200 250 300 time (hrs)
of cells that are mutant is expected to remain constant over time. Using this data as a baseline it may have been possible to see an effect where HOG selection serves to decrease the fraction of cells that are mutant, but due to the considerable noise in the plots, the success of such experiments seemed unlikely. For this reason I decided to explore the use of batch culture experiments for the purpose of studying yeast signaling pathway evolution.
Batch Culture Experiments
The goal of this first set of batch culture experiments is to demonstrate that when two systems share components selection for the function of one of the systems will result
in an enrichment of the population for those cells that are capable of function in the second system. Specifically I am attempting to demonstrate that by selecting for HOG pathway function I am increasing the proportion of cells in the population that are functional in pheromone response. If I can demonstrate that a higher fraction of pheromone response mutants are salt sensitive than in the general population then it
seems reasonable to infer the above.
In this experiment I constructed two strains. One where SSK2 and SSK22 were deleted so that Ste lIp, Ste50p, Ste20p and Cdc42p were required for both pheromone and HOG signaling (EY0204), and a second strain where SH01 was deleted so that pheromone and HOG signaling relied on completely independent sets of components (EY0233) (Figure 4 a). For both of these strains I inoculated a culture and allowed it to grow overnight in YPD, I diluted the culture the following morning 25 fold into fresh YPD and allowed it to grow for 5 hours at 300C to an OD6 of approximately 1.5. I then
plated a 100 IAL sample onto YPD plus 1 [iM alpha factor for each strain in to get a sampling of the pheromone resistant mutants in the population. I also diluted the culture
10,000 fold and plated 100 ptL onto YPD to get a sample of the general population (Figure 4 b). I then tested colonies from each of these four classes of cells (EY0204 general population, EY0204 pheromone response mutants, EY0233 general population, and EY0233 pheromone response mutants) for HOG response by suspending each of the colonies in 50 tL of sterile distilled water and then spotting 5 pL of the suspension onto
YPD plates plus IM NaCl and YPD plates as a control (Figure 4 c). The results from two independent trials are shown in Figure 5.
Figure 4: Batch culture experimental methodology.
a) Strain EY0204 was constructed by deleting SSK2 and SSK22 thereby making signaling via Sholp and the components that are shared with pheromone response (Cdc42p, Ste20p, Ste50p, and Stel lp) necessary for HOG signaling. Strain EY0233 was constructed by deleting SHO1 so that Cdc42p, Ste20p, Ste50p, and Stell p are not involved in HOG signaling. b) Batch cultures of EY0204 and EY0233 were grown in YPD and plated directly on YPD plus alpha factor, to get a sampling of the pheromone response mutants in each population, and then diluted 10,000 fold and plated on YPD, to
get a sampling of each general population. c) Colonies from the plates in b) were
suspended in 50 tL water and 5 .tL of the suspension was plated on YPD as a control and on YPD plus 1 M NaCl to test for salt sensitivity. Positive and negative controls are underlined in red and green respectively. Failure to grow on 1 M NaCl represents a colony that is salt sensitive and presumably has a mutation in the HOG pathway.
a)
EY0204
EY0233
SholUnshared
Branch
Shared
Branch
Unshared
Branch
Branch
Shared
EY0233
lI
YPD 1 M NaCl
+t
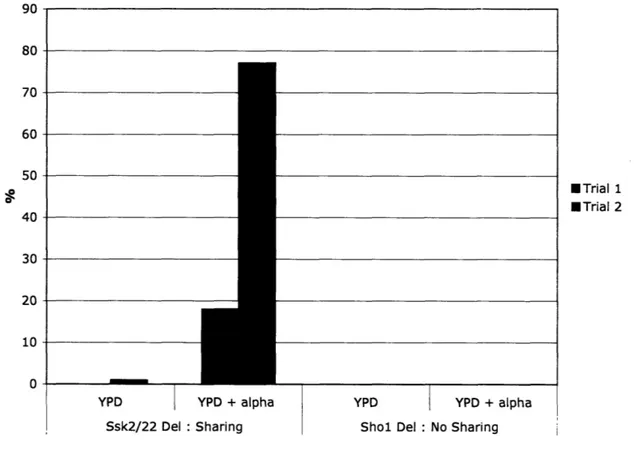
Figure 5: Batch culture results.
High salt preferentially selects against pheromone response mutants when components are shared with the HOG pathway. This effect is not seen when components are not shared between the two pathways.
%
/ 0of Colonies That are Salt Sensitive
90 80 70 60 50 40 30 20 10 oYPD YPD + alpha Ssk2/22 Del : Sharing
YPD YPD + alpha Shol Del : No Sharing
My experiments show that, in the strain where components are shared, selecting on salt will remove a significant fraction of the pheromone response mutants (18% in trial
1 and 77% in trial 2) thus enriching the population for functional pheromone responders. This effect is not seen in the case where no components are shared. The variation in the fractions of pheromone response mutants that are salt sensitive between the two trials is quite large. The fraction is sensitive to what types of mutations occur early in the growing
ETrial 1 ETrial 2
·_ _
·
~_
~
--- · Iculture (a stochastic process) and is expected to have a large variance (Luria and Delbruck, 1943) so the difference is not unexpected.
The fraction of pheromone response mutants that are salt sensitive is influenced both by the mutation rate of the shared components relative to the mutation rate of the pathway as a whole and by the relative fitness of each of the possible types of mutants, such as loss of function mutations in pathway elements. By understanding the mutation rate of the pheromone response pathway, the mutation rate of the components that are shared between the two pathways, and the fitness of the different pheromone response mutants one can get a sense of the fraction of pheromone response mutants that, on average, would be eliminated by selection for HOG function.
Measuring Mutation Rate
There are several different methods to estimate the mutation rate of a given gene or set of genes (Rosche and Foster, 2000). Most of these methods rely on an assumption that mutants and non-mutants have the same fitness. Some workarounds for situations where this assumption doesn't hold do exist (Koch, 1982). But even these are not developed for the case where multiple types of mutants each with different fitness exist, as is likely the case with the pheromone response pathway. The P0 method as described by Lea and Coulson (1949), does not require that mutants and non-mutants have the same fitness since it only considers whether mutants are present at all in a culture.
The number of new mutations that have occurred in a culture of N cells will be given by the Poisson distribution with a parameter m = trN. The probability of getting a culture with no mutants is given by P0= e-m. So, for an experiment with C cultures, z of
which have no mutants (as determined by plating the cultures on alpha factor and
counting how many plates give rise to zero colonies), the mutation rate will be given by: In(C )
N
The total number of cells in each culture, N, needs to be chosen so that P0 lies within a statistically informative range. Preferably P0 would lie between 0.1 and 0.75 (Rosche and Foster, 2000). One way to limit the number of cells is by limiting the glucose in the culture. In an initial experiment I made SC media with .1%, .01%, and
.001% glucose. I inoculated eight I mL cultures for each media and allowed the cultures to grow for 48 hours. I plated all 24 cultures in their entirety on YPD plates with 1 tM alpha factor. After incubating the plates for 48 hours at 300C I calculated P
0 for each media. Medias containing 0.1% and 0.01% glucose gave a P0 of 0 while the media containing 0.001% glucose gave a P0 of 0.125. Based on this data I elected to use media with 0.0008% glucose, which I expected would give a P0 within the respectable range.
It is possible that the low concentration of glucose in the culture is insufficient to support the growth of yeast cells (Fink, unpublished). In this case there would need to be some unknown carbon source either present in the media, transferred with the yeast cells, or present on the glassware to account for the approximately eight doublings seen in the experiment below. One could verify that the added glucose does indeed support growth
by demonstrating that the final concentration of yeast cells varies linearly with the glucose concentration over a range around 0.0008% glucose.
In performing this experiment I suspended a colony of EY0237 (Appendix B) in 1 mL of SC without glucose; the resulting OD6 was 0.82. I diluted this 10 fold and
inoculated 100 mL of SC plus 0.0008% glucose with 17 ýtL of the diluted suspension. I 21
then aliquoted 1 mL into each of 65 test tubes and placed the tubes at 300C for 48 hours. After 48 hours I plated 60 of the cultures in their entirety on YPD plus 1 LM alpha factor. I allowed the plates to grow at 300C for 48 hours. Then, I counted the number of colonies on each plate. Since wild-type cells eventually recover and grow to form colonies on alpha factor I set an arbitrary minimum colony size of 1mm, counting only colonies above this threshold.
To determine the number of cells per culture, N, I diluted a sample from the remaining 5 cultures 100 fold and plated 100 uL in YPD soft agar, performed in three replicates for each plate.
Of the 60 plates five had zero colonies, so in the above equation C = 60 and z = 5. The total number of cells per culture was estimated to be 68,000 with a standard
deviation of 21,000. So the calculated mutation rate ýt is 3.7 ± 1 x 10⁻⁵ mutations per cell
per division.
To determine the mutation rate for the shared components I tested each of the colonies that grew on alpha factor for salt sensitivity by suspending the colony in 50 [tL of water and plating 5 [tL on YPD with 1 M NaCl. I calculated the P0 for the shared components by counting how many cultures gave zero salt sensitive colonies on alpha factor. In this case z = 54 and C and N were unchanged giving a mutation rate of 1.5 ±
0.5 x 10⁻⁶ mutations per cell per division.
In order to evaluate this data I compared it to an estimate for the pathway mutation rate based on a simple model. If one imagines a pathway with n genes, each with a mutation rate [tgene, the mutation rate will be given by:
Published estimates for single gene mutation rates in yeast are on the order of 10-7 per cell
per division (Paquin, 1982); I estimated the total number of genes that when mutated will cause insensitivity to pheromone to be 17. In this case the estimated mutation rate for the pathway as a whole would be 1.7 x 10⁻⁶ per cell per division which is about 20 times lower than the measured value. The calculated mutation rate for the shared components is also 20 times lower than the measured value.
The reason for the unusually high mutation rates is unclear. It may be that the pheromone response genes are particularly mutable. It is also possible that the strain used in this experiment has an unknown secondary mutation that makes it highly mutable. In this case repe:ating the experiment with an independent strain may provide a more accurate estimate of the mutation rate. One could also measure the mutation rate of an independent marker, such as mutation to canavanine resistance, where published estimates are known (Paquin, 1982); a mutator strain would reveal itself with an unusually high mutation rate.
Another possibility for the high measured mutation rate is that starving the cells for glucose may lead to an increase in the mutation rate (Fink, unpublished). One could
overcome such an effect and still maintain low enough cell numbers by inoculating a series of cultures in a rich medium and allowing them to grow for a shorter period of time. The cultures could be plated when the population reaches a defined size during log phase growth. Or rather than growing liquid cultures one could plate a suspension of cells onto YPD agar. Each resulting colony would represent the offspring of a single cell. One could allow for growth for a defined period of time and then test the colonies for the presence of mutants.
Mapping of Mutants
I tested a small sample of clones from ten mutant colonies for the ability to mate and showed that they are indeed sterile. It is still unknown where mutations are occurring or even if some of the pheromone resistant clones have epigenetic effects, rather than genetic mutations, that allow growth on alpha factor. To analyze this further one could map a representative collection of pheromone response mutants to mutations in particular genes using complementation tests.
One method to map pheromone response mutants would be to transform the mutant MATa strain (which is ura3- his3-) with a yeast genomic library (Rose et al., 1987) that is marked with URA3 as well as ampicillin resistance. Then one could spread the transformed cells onto a YPD plate along with a MATa ura3- HIS3+ strain and allow them to mate overnight. Next one could replica plate onto HIS- URA- dropout plates where only diploid fusions resulting from successful mating will grow. One could then isolate the plasmid from the diploid strain that contains the wild-type gene that
complements the original mutation. Using primers designed for each of the genes, that when mutated are known to result in pheromone resistance, one could then use PCR to find which of the genes is on the plasmid and by inference which gene was mutated in the original strain. I have tested this protocol using strains with known deletions of STE2, STEll, STE7, and FAR] and have found it to be promising (Figure 6).
The results of the mapping experiments will be useful in answering some basic questions about how mutations occur in a pathway. Are the mutations evenly distributed, do they scale with the size of the gene, are some components hotspots for mutation and others protected in some way, and if so why?
Figure 6: Mapping of pheromone response mutants using complementation tests. Known deletions of FAR1, STE2, STE7, and STEl 1 were transformed with a yeast genomic library and tested for the ability to mate and form diploids. Diploids were selected as described in the text. Plasmids were isolated and transformed into E. coli in order to purify the plasmid from the chromosomal DNA. Plasmids were isolated from the transformed IE. coli and were used as template for a PCR reaction using primers capable of amplifying regions within the deleted gene. The strains with STE2 and STE7 deletions were tested twice. The results are shown in the agarose gel below. The 100 bp ladder from New England Biolabs is shown. For each strain the first lane (left) is a PCR from wild-type yeast DNA and serves as a positive control for the primers. The second lane (right) represents PCR from the plasmid DNA that was isolated from the diploid cells. Presumably it contains the yeast genomic DNA that compliments the original mutation. The FAR1 deletion strain showed no evidence of plasmid DNA containing the FAR1 gene. Both experiments for both ste2A and ste7A showed evidence of the recovery of plasmid DNA containing STE2 and STE7 respectively. ste IlA showed a faint band of the expected size as well as another faint band that was 100 bp smaller than the expected size.
Measuring Fitness of Mutants
The fitness of one strain relative to a reference strain can be measured by growing the two cultures together in competition experiments (Lenski, 1991). The exponential growth of a population can be described by: N = Noe"t. Taking the natural log of the ratio of two populations, N1 and N2, results in:
In( NI2)=ln(No 2 )+(a -a 2)t
/ W 02
The plot of ln(N,/N2) versus time gives a linear relationship where the slope is the difference between the growth rates of the two competing populations. Fitness of one strain relative to another is defined as the ratio of the growth rate of the first strain
relative to that of the second strain and can be easily calculated if the absolute growth rate of one of the competing strains is known.
I obtained deletion strains from the Saccharomyces Genome Deletion Project for seven of the genes involved in the pheromone response pathway (STE2, STE4, STE5, STEll, STE7, FUS3, and FAR]) as well as their parent strain (BY4741, Appendix B), which is wild type for pheromone response. Each deletion was marked with a KanMX cassette that confers resistance to the antibiotic G418. The parent strain is susceptible to G418. I began each experiment by inoculating separate cultures with the two competing strains (one of the deletions and the wild-type parent strain) and allowing them to grow overnight. In these competition experiments I used either SC or SC with 0.08% glucose consistently from the initial inoculation through the end of the competitions. I then mixed the two cultures in equal volume and inoculated a fresh culture with a 100-fold dilution of the mixture and allowed it to grow at 300C. I also diluted the mixture and plated a
sample on YPD to get a total cell count and on YPD plus G418 to get a count of the
deletion cells. I used this data to calculate the ratio of the two competing strains at time zero.
Each day I diluted the competing strains 100-fold into fresh media. After 3 days and after 6 days I plated the cultures on YPD and on G418 to get a ratio of the competing populations. I then plotted the natural log of the measured ratios versus time and did a linear fit of the data. The slope of the best fit line gave the difference in growth rates between the two strains. To convert the difference in growth rate I assumed that the growth rate of the wild-type strain was equal to the growth of the culture as a whole (4.6 day-') and calculated the relative fitness of the deletion strain accordingly. Each
experiment was performed in triplicate and the mean and standard deviations of the measurements are reported below.
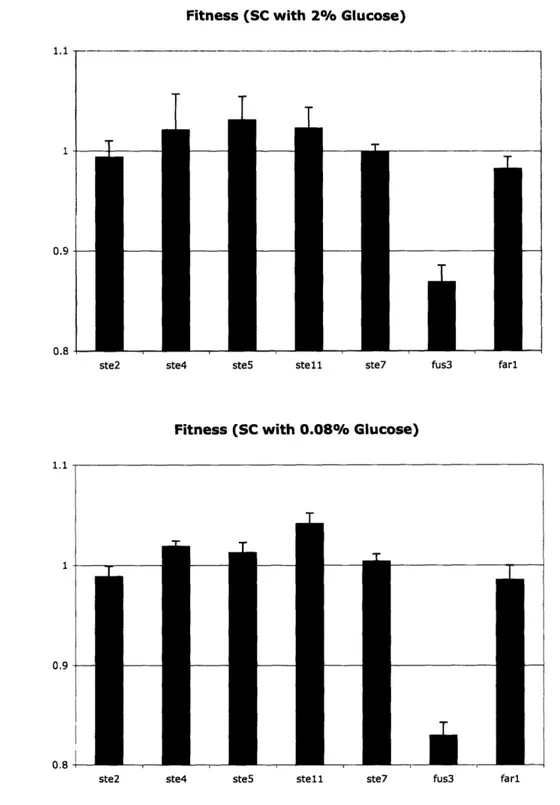
This experiment was performed for all seven strains in both standard SC (Figure 7 a) media and an SC media with 0.08% glucose (Figure 7 b). In both cases it can be seen that strains with STE2 or STE7 deletions have a fitness that is approximately equal to wild-type while STE4, STE5, or STE 1 deletions have a slightly greater fitness and FUS3 and FAR1 deletions have a lower fitness than wild-type.
It was noted earlier that the chemostat data (Figure 3) was generally consistent with the case that pheromone response mutants have a lower fitness than wild-type, yet in the above experiment we see cases where mutants have a higher fitness than wild-type. To explore this dichotomy further I performed a competition between the Stell 1 deletion and its parent strain in the chemostat using the SC media with 0.08% glucose used above (Figure 7 b). Sampling was performed on day 0, day 1, day 4, day 6, and day 8. Samples were plated on YPD and on YPD plus G418 to determine the relative proportion of the
Figure 7: Batch culture fitness results.
Results from competition experiments, as described beginning on page 20, in a) SC media with standard glucose concentration (2%) and b) SC media with 0.08% glucose.
a)
Fitness (SC with 2% Glucose)
0.9
-r
ste2 ste4 ste5 stell ste7 fus3 farl
Fitness (SC with 0.08% Glucose)
0.8
ste2 ste4 ste5 stell ste7 fus3 farl
competing populations. The results of three experiments are shown in Figure 8. The estimated fitness of a Stel 1 deletion relative to wild-type is 0.96 ± 0.01, which is lower than measured in the batch culture competitions above. The reason for this difference is
unknown. It would be interesting to see the result of competitions, in the chemostat, using other strains with pheromone response gene deletions to see whether the mutants also have a lower fitness in a chemostat than in batch culture.
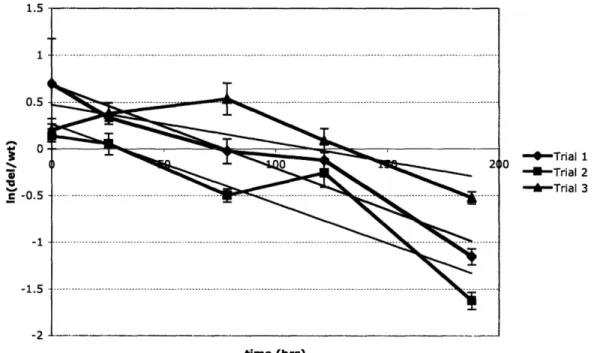
Figure 8: Fitness of a stell mutant in the chemostat.
The plot below gives the natural log of the ratios of the STE 1 deletion concentration and the concentration of the parent strain over time for three separate trials. The slopes of the fitted lines give the absolute difference in growth rate between the two strains. It can be
seen that the proportion of cells that are STE 1 deletions is decreasing over time giving a measured fitness of the deletion strain of 0.96 ± 0.01 relative to the parent strain.
Stell 1.5 1 0.5 c 0 c -0.5 -1 -1.5 -1 - Trial 1 - Trial 2 " -Trial 3 time (hrs)
The KanMX marker has been demonstrated to be selectively neutral (Goldstein and McCusker, 1999) however the experiments were not performed in these particular circumstances (they were performed in YPD rather than the SC media used in this study) so an additional important experiment will be to perform the above experiments between strains that differ only in the presence of the marker. If the KanMX marker does impose a fitness cost then the cost is most likely to present itself uniformly in the different strains and a correction can be made to the results above. A second concern is that the deletion strains may harbor unknown secondary mutations that effect fitness. One can transfer the deletion cassette to a new strain using PCR amplification and transformation, which would not transfer any secondary mutations outside of the cassette. If the fitness
measurements are consistent across the independently constructed strains then secondary effects are unlikely.
Chapter 3: Future Work
It seems clear from the above experiments (Figure 5) that when components are shared between pheromone and HOG response that selection for HOG response will lead to selection against some of the possible pheromone response mutants. We have proposed that this cross selection may be beneficial in that it could help stabilize a module in the face of mutation and genetic drift by providing an additional means of selections for a
subset of its components. Important future work in expanding this hypothesis includes elucidating the conditions under which component sharing will be selected as a means of module stabilization and demonstrating that under the proper conditions component
sharing will indeed evolve.
One can begin to picture what a selection regime where component sharing would be selected for might look like by looking at a model of pheromone response decay that is based on the fitness data measured above (Figure 7 b). I modeled the fraction of cells that are a given deletion mutant over time by:
ft
=
fo -e( dl - apar.n )tWhere fo and f, are the fraction of cells that are deletions at time 0 and t respectively and adel--parent is the absolute difference in growth rate between the deletion and the parent as measured in the batch culture competition experiments. I calculated the total fraction of
pheromone response mutants as the sum of the individual fractions. I set fo to 106. This -model is simplified in that it only takes into account those pheromone response
components for which the fitness of mutants is known (STE2, STE4, STE5, STEJl, STE7, FUS3, FARI) and it ignores the effect of the daily 100 fold dilution which can either
eliminate a class of mutants or greatly increase their abundance when the fraction of cells that are mutant is small.
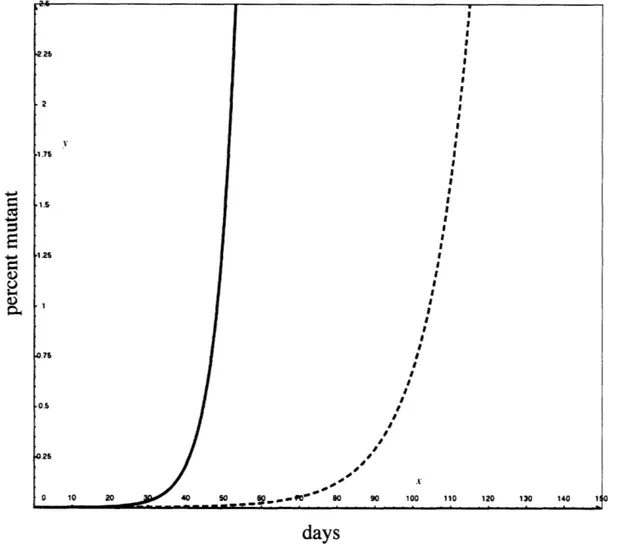
Figure 9 shows the percentage of cells that are mutant in the modeled culture as time progresses. The solid blue line shows the expected decay of the pathway
components that have been measured. Note that the curve is exponential and that there is a fairly sharp point where the mutants overtake the wild-type population. The dashed red curve shows the imagined decay of the pathway when there is frequent selection for HOG pathway function, which in this case leads to a selection against stell I loss of function
mutants. Note that there is a significant delay in the time taken for the mutants to overtake the wild-type cells.
If this model is accurate one could postulate that if both pheromone response and HOG response are selected for frequently (more often than approximately every 25 days) that component sharing would have little selective advantage. However, if HOG was
selected frequently but pheromone response was selected for less frequently (on the order of every 70 days) component sharing would be beneficial. Without component sharing, by the 7 0th day a high fraction of the cells would have lost the ability to respond to
pheromone and would be selected against, however when components are shared only a small fraction of cells would have lost the ability to respond to pheromone. In this selection regime where HOG function is selected for frequently and pheromone response is selected for less frequently one would expect that a population with shared components would fare better and have a selective advantage over a population without shared
Figure 9: Model of pheromone response decay.
The plot below shows the modeled fraction of cells that are mutant versus time as described in the text. The solid blue line gives the total fraction of pheromone response mutants. In the dashed red line there is a frequent selection for HOG function which prevents the accumulation of Stel 1 mutants.
S
a.)
days
In order to test this experimentally I would need two populations, one with shared components and one with no shared components. The strains would need to be identical otherwise and in a nonselective environment should have equal fitness. One possible way to do this is based on work by Park et al. (2003). These authors demonstrated that when the Stellp binding site on Ste5p (or Pbs2p) is mutated (creating Ste5p* or Pbs2p*)
signaling is lost. Signaling can be restored by attaching a protein binding domain to Ste5p and its complementary binding domain to Stel lp. Using this technology I can construct one strain with shared components by attaching a protein binding domain to Stel lp and the complementary domain to both Ste5p* and Pbs2p*. I can construct a second strain
where Stel ip is not shared by duplicating STEJl and attaching one protein binding domain to one copy, with the complimentary domain on Ste5p*, and a second binding domain to the second copy, with the complimentary binding domain on Pbs2p* (Figure 10). If one of the two populations is marked with a selectively neutral marker such as KanMX, then I can mix and compete the two strains to measure their relative fitness. In an environment where pheromone response and HOG response are both selected for frequently I would expect the two strains to have equal measured fitness and thus the
relative proportions of the two populations would remain constant. However, when HOG is selected frequently and pheromone response is selected infrequently I would expect that the strain with shared components would have a higher measured fitness and would increase proportionally relative to the strain without shared components.
A further, more satisfying test of this selection regime would be to demonstrate that a population with two systems where no components are shared will evolve component sharing under the appropriate conditions. When the difference between no component sharing and component sharing is a single mutation these experiments may be feasible. Unfortunately, when there are multiple intermediate mutations the time scale of the experiment becomes prohibitively long. For example, an intermediate step that requires the fixation of a neutral mutation in a haploid population of N cells requires
Figure 10: Engineering of component sharing.
Population 1 and population 2 represent engineered populations where Ste llp is
respectively not shared and shared between HOG and pheromone response. The red Xs in Ste5p* and Pbs2p* represent a modification of the natural Stell p binding site such that Ste lip can no longer bind. The orange tabs labeled A or B represent complimentary protein binding domains that have been added to Stellp and Pbs2p* or Stell p and
Ste5p*. (Modified from Park et al., 2003)
Population 1
Population 2
Pheromone HOG Pheromone HOG
Response Response Response Response
*... .i
8107':L
U....; :- . ..
,
H 2
approximately 2N generations (Kimura and Ohta, 1969). In a typical evolving yeast population of about 106 cells undergoing a daily 100-fold dilution the fixation of a neutral mutation would be expected to take about 800 years! This time is considerably shortened when intermediate steps have a selective advantage (a 1% increase in fitness will shorten the fixation time to about 400 days; Graur and Li, 2000) but the required timescales are
still a significant barrier for laboratory experiments.
The above proposed experiment is quite tenuous in that it relies on the shared component(s) conferring the greatest fitness when mutated. My current experimental measurements of fitness are not of sufficient resolution to state conclusively that in batch culture stel I mutants have the highest fitness. If instead, a non-shared component in the
pheromone response pathway, such as STE5, confers the highest fitness when mutated the effect of HOG selection on pheromone response decay is minimal. It may be possible to increase the fitness of stell null mutants by fusing a protein with a known fitness cost to STEll. However, the above experiments are not laid out as a specific prescription for a research agenda. Rather they are intended as a case study for how one could proceed in strengthening our hypothesis that under certain conditions component sharing is a viable evolutionary strategy. In practice a different system, a different organism, or even a synthetic system may be the best venue for moving forward in this exploration.
References
Alon, U., Surette, M.G., Barkai, H., and Leibler, S. (1999). Robustness in bacterial chemotaxis. Nature 397, 168-717.
Bhoumik, A., Takahashi, S., Breitweiser, W., Shiloh, Y., Jones, N., and Ronai, Z. (2005). ATM-dependent phosphorylation of ATF2 is required for the DNA damage response.
Molecular Cell 18, 577-587.
Copley, S.D. (2003). Enzymes with extra talents: moonlighting functions and catalytic promiscuity. Current Opinion in Chemical Biology 7, 265-272.
Dykhuizen, D.E. and Hartl, D.L. (1983). Selection in chemostats. Microbiology Reviews 47, 150-168.
Goldstein, A.L. and McCusker, J.H. (1999). Three new dominant drug resistance cassettes for gene disruption in Saccharomyces cerevisiae. Yeast 15, 1541-1553. Graur, D. and Li, W. (2000). Fundamentals of molecular evolution. Sunderland, MA: Sinauer Associates.
Hansen, T.F. (2003). Is modularity necessary for evolvability? Remarks on the relationship between pleiotropy and evolvability. Biosystems 69, 83-94.
Hartwell, L.H., Hopfield, J.J., Leibler, S., and Murray, A.W. (1999). From molecular to modular cell biology. Nature 402, C47-C52.
Hodgkin, J. (1998). Seven types of pleiotropy. International Journal of Development Biology 42, 501-505.
Kashtan, N. and Alon, U. (2005). Spontaneous evolution of modularity and network motifs. PNAS 102, 13773-13778.
Kimura, M. and Ohta, T. (1969). The average number of generations until fixation of a mutant gene in a finite population. Genetics 61, 763-771.
Koch, A.L. (1982). Mutation and growth rates from Luria-Delbruck fluctuation tests. Mutation Research 95, 129-143.
Kubitschek, H.E. (1970). Introduction to research with continuous cultures. Englewood Cliffs, NJ: Prentice-Hall.
Lea, D.E. and Coulson, C.A. (1949). The distribution of the numbers of mutants in bacterial populations. Journal of Genetics 49, 264-285.
Lenski, R.E. (1991). Quantifying fitness and gene stability in microorganisms. In Assessing Ecological Risks of Biotechnology. L.R. Ginzburg, editor. (Butterworth-Heinemann, Boston).
Lipson, H., Pollack, J.B., and Suh, N.P. (2002). On the origin of modular variation. Evolution 56, 1549-1556.
Luria, S.E. and Delbruck, M. (1943). Mutations of bacteria from virus sensitivity to virus resistance. Genetics 28, 491-511.
Novick, A. and Szilard, L. (1950). Experiments with the chemostat on spontaneous mutations of bacteria. PNAS 36, 708-719.
O'Rourke, S.M., Herskowitz, I., and O'Shea, E.K. (2002). Yeast go the whole HOG for the hyperosmotic response. Trends in Genetics 18, 405-412.
Paquin, C.M.E. (1982). Characterization and rate of occurrence of adaptive mutations in haploid and diploid populations of the yeast Saccharomyces cerevisiae. (Doctoral dissertation, University of Michigan, 1982).
Park, S., Zarrinpar, A., Lim, W.A. (2003). Rewiring MAP kinase pathways using alternative scaffold assembly mechanisms. Science 299, 1061-1064.
Rosche, W.A. and Foster, P.L. (2000). Determining mutation rates in bacterial populations. Methods 20, 4-17.
Rose, M.D., Novick, P., Thomas, J.H., Botstein, D., and Fink, G.R. (1987). A Saccharomyces cerevisiae genomic plasmid bank based on a centromere-containing shuttle vector. Gene 60, 237-243.
Savageau, M.A. (1974). Genetic regulatory mechanisms and the ecological niche of Escherichia coli. PNAS 71, 2453-2455.
Savageau, M.A. (1998). Demand theory of gene regulation. I. Quantitative development of the theory. Genetics 149, 1665-1676.
Savageau, M.A. (1998). Demand theory of gene regulation. II. Quantitative application to the lactose and maltose operons of Escherichia coli. Genetics 149, 1677-1691.
von Dassow, G., Meir, E., Munro, E.M., and Odell, G.M. (2000). The segment polarity network is a robust developmental module. Nature 406, 188-192.
Wolf, H.G., Wohrmann, K., and Tomiuk, J. (1987). Experimental evidence for the adaptive value of sexual reproduction. Genetica 72, 151-159.
Zhang, J. (2003). Evolution by gene duplication: an update. Trends in Ecology and Evolution 18, 292-298.
Appendix A: Chemostat Design and Steady State
Due to the considerable cost of commercially available continuous culture systems I decided to design and build a chemostat from off the shelf parts (Figure A. 1). The reactor (Figure A.2) consists of a pear shape flask. The top is sealed by a rubber
septum. The septum is punctured with needles that allow fresh media and air to be
delivered into the reactor and media and cells leave the reactor. Fresh media is stored in a 2 L flask and is pumped into the reactor at a defined rate, w. Air is pumped, by aquarium pumps, through a 2 micron filter and through the septum via a 6" septum penetrating needle. The air is bubbled through the growing culture and serves to mix and deliver oxygen to the culture. In addition it provides a positive pressure in the reactor that supplies a force to drive the used media and cells out of the reactor through a third needle. The height of the tip of the third needle determines the volume of the culture, as the reactor will fill to that point.
An essential feature of the chemostat is its ability to maintain a steady state where the population remains constant. In order to verify that a steady state was obtained in the chemostat I ran the chemostat under three different conditions: wild-type S288C MATa under glucose limited (Figure A.3 a) and phosphate limited (Figure A.3 b) conditions as well as EY0204 under glucose limited conditions (Figure A.3 c).
Figure A.1: Chemostat with two reactors.
On the left is a 2 L flask containing fresh media. Next to the flask is the pump, which is used to deliver media to the two reactors. The reactors are shown in a water bath that is used to control the temperature of the growing culture. On the far right are two 1 L flasks that collect effluent from the reactors.
Figure A.2: Schematic of a chemostat reactor.
The diagram shows the pear shaped flask that serves as the reactor chamber. The left most line is the air inflow needle and is capped with a three-way valve that allows sampling of the growing culture. Crossing this line from the left is the media inflow line. Media is dripped into the chamber through a short needle. The rightmost line is the outflow needle. Note that the depth of the media in the chamber is determined by the height of the needle's tip.
air inflow three-way
valve
media inflow
Figure A.3: Evidence for steady state.
Data from chemostat experiments showing the total cell concentration (as measured by OD60, WPA Biowave C08000) versus time. a) Wild-type S288C cells were grown at a dilution rate of 0.2 hf' at 300C in defined media: 0.08% (w/v) glucose, 6.7 g yeast nitrogen base (Difco) dissolved in water to a final volume of 1 L. Time = 0 represents when the first sample was taken, about 3 hours after the chemostat was started. b) Wild-type S288C cells were grown with a dilution rate of 0.18 hr' at 300C in defined media:
1% (w/v) glucose, 5.7g yeast nitrogen base without potassium phosphate and without sodium chloride (Q-Biogene), 13.5g KH2PO4, 0.1 g NaCl. Time = 0 represents when the first samples were taken, about 48 hours after the chemostat was started. c) EY0204 was grown at a dilution rate of 0.2 hr-' at 300C in SC with 0.08% glucose (Appendix B). Samples were diluted 10-fold before the ODoo was measured. Time = 0 represents when the first sample was taken, about 24 hours after the chemostat was started.
a)
Glucose Limited Chemostat
0 2000 4000 6000 8000 Time (minutes) -4-Chemostat 1 10000 12000 14000 1.6 1.4 1.2 1 0.8 0.6 0.4 0.2 0
V/
Phosphate Limited Chemostat
0.4.
0 1000 2000 3000 4000 5000 6000 7000 8000 9000 10000
Time (minutes)
- Chemostat 1 --*--Chemostat 2 I llChemostat 3
Glucose Limited Chemostat
0 50 100 150 200 250 300 350 400 Time (hrs) - Chemostat 1 -I--Chemostat 2 1.4 1.2 0.8 0.6 0.2 0.:18 0.16 0.12 0.1 0.08 0.06 0.04 0.02 0 k~ __ r -- ~--·--- ~---
-Parts List * Reactor
* 100 mL Pear shaped flask, Chemglass CG-1554-02 * Red septum stopper 24/40-24/25, Chemglass CG-3022-08 * 6" Deflected point septum penetration needles, Popper and Sons * 21 gauge, 1.5" needles, Precision Glide 305167
* Three-way stopcock, Cole-Parmer C-31507-12 * Pump
* L/S Variable-speed digital drive, Cole-Parmer C-07524-40 * 12 Channel, 8 roller pump head, Cole-Parmer C-07519-25 * Small cartridge, Cole-Parmer C-07519-85
* Tubing
* Silicone tubing Masterflex L/S 13, Cole-Parmer C-96400-13 * Silicone tubing .188" ID, Cole-Parmer C-06411-66
* Silicone tubing .125" ID, Cole-Parmer C-06411-64 * Fittings
* 1/8" x 1/16" Kynar hose barb, Cole-Parmer C-30703-41 * 3/16" x 1/8" Kynar hose barb, Cole-Parmer C-30703-48
* Male luer x 1/8" Polypropylene hose barb, Cole-Parmer C-06359-17 * 1/8" Kynar Y connector, Cole-Parmer C-30703-92
* Whisper 60 aquarium air pump
Appendix B: Strains and Media
Strains Used in This Study
Name Genotype
BY4741 MATa his3Al leu2AO metl5AO ura3AO
EY0204 MATa ura3 trpl his3 leu2 ade2 HOA::Ade2 ssk2A::Trpl
ssk22A::Leu2
EY0233 MATa ura3 trpl his3 leu2 ade2 HOA::Ade2 sholA::Trpl
EY0237 MATa ura3 trpl his3 leu2 ade2 HOA::Ade2 ssk2A::Trpl
ssk22A::Leu2 HMLaA::KanMX
Media Used in This Study YPD * 10 g Yeast extract * 20 g Peptone * 20 g Glucose * Water to 1000 mL YPD Plates * 10 g Yeast extract * 20 g Peptone * 20 g Glucose * 20 g Agar * Water to 1000 mL
Complete Supplement Mixture (CSM) (QBiogene) * 10 mg/L Adenine * 50 mg/L L-Arginine HCL * 80 mg/L L-Aspartic Acid * 20 mg/L L-Histidine HCL * 50 mg/L L-Isoleucine * 100 mg/L L-Leucine * 50 mg/L L-Lysine HCL * 20 mg/L L-Methionine * 50 mg/L L-Phenylalanine * 100 mg/L L-Threonine * 50 mg/L L-Tryptophan * 50 mg/L L-Tyrosine * 20 mg/L Uracil * 140 mg/L L-Valine
Synthetic Complete (SC)
* 6.7 g Yeast Nitrogen Base (Difco) * CSM
* 20 g Glucose * Water to 1000 mL
Synthetic Complete (SC) with 0.08% Glucose * 6.7 g Yeast Nitrogen Base (Difco) * CSM
* 8 g Glucose * Water to 1000 mL
Synthetic Complete (SC) with 0.0008% Glucose * 6.7 g Yeast Nitrogen Base (Difco) * CSM
* 0.08 g Glucose * Water to 1000 mL
Phosphate Limited Synthetic Dropout (SD)
* 5.7 g Yeast Nitrogen Base without KH2PO4 and without NaCl (QBiogene) * 13.5 mg KH2PO4 * 0.1 g NaCl * 20 mg Uracil * 20 mg Histidine * 10 g Glucose * Water to 1000 mL