Publisher’s version / Version de l'éditeur:
Journal of the American Ceramic Society, 94, 12, pp. 4463-4470, 2011-12-01
READ THESE TERMS AND CONDITIONS CAREFULLY BEFORE USING THIS WEBSITE. https://nrc-publications.canada.ca/eng/copyright
Vous avez des questions? Nous pouvons vous aider. Pour communiquer directement avec un auteur, consultez la première page de la revue dans laquelle son article a été publié afin de trouver ses coordonnées. Si vous n’arrivez pas à les repérer, communiquez avec nous à PublicationsArchive-ArchivesPublications@nrc-cnrc.gc.ca.
Questions? Contact the NRC Publications Archive team at
PublicationsArchive-ArchivesPublications@nrc-cnrc.gc.ca. If you wish to email the authors directly, please see the first page of the publication for their contact information.
NRC Publications Archive
Archives des publications du CNRC
This publication could be one of several versions: author’s original, accepted manuscript or the publisher’s version. / La version de cette publication peut être l’une des suivantes : la version prépublication de l’auteur, la version acceptée du manuscrit ou la version de l’éditeur.
For the publisher’s version, please access the DOI link below./ Pour consulter la version de l’éditeur, utilisez le lien DOI ci-dessous.
https://doi.org/10.1111/j.1551-2916.2011.04724.x
Access and use of this website and the material on it are subject to the Terms and Conditions set forth at
Thermal stability of the cement sheath in steam treated oil wells
Makar, Jon; Luke, Karen
https://publications-cnrc.canada.ca/fra/droits
L’accès à ce site Web et l’utilisation de son contenu sont assujettis aux conditions présentées dans le site LISEZ CES CONDITIONS ATTENTIVEMENT AVANT D’UTILISER CE SITE WEB.
NRC Publications Record / Notice d'Archives des publications de CNRC: https://nrc-publications.canada.ca/eng/view/object/?id=b8653611-56d0-4edf-a52f-1ec3b1afa7e7 https://publications-cnrc.canada.ca/fra/voir/objet/?id=b8653611-56d0-4edf-a52f-1ec3b1afa7e7
Thermal stability of the cement
sheath stability in steam treated
oil wells
Makar, J.M.; Luke, K.
NRCC-53936
A version of this document is published in / Une version de ce document se trouve dans:Journal of the American Ceramic Society, 94, (12), pp. 4463-4470, December-01-11, DOI : 10.1111/j.1551-2916.2011.04724.x
The material in this document is covered by the provisions of the Copyright Act, by Canadian laws, policies, regulations and international agreements. Such provisions serve to identify the information source and, in specific instances, to prohibit reproduction of materials without written permission. For more information visit http://laws.justice.gc.ca/en/showtdm/cs/C-42
Les renseignements dans ce document sont protégés par la Loi sur le droit d’auteur, par les lois, les politiques et les règlements du Canada et des accords internationaux. Ces dispositions permettent d’identifier la source de l’information et, dans certains cas, d’interdire la copie de documents sans permission écrite. Pour obtenir de plus amples renseignements : http://lois.justice.gc.ca/fr/showtdm/cs/C-42
Thermal Stability of the Cement Sheath in Steam Treated Oil Wells
Jon Makar,NRC-CNRC, Institute for Research in Construction, Ottawa, Ontario, KIA OR6, Canada and
Karen Luke,
Trican Well Service, R & D Centre, Calgary, Alberta, T2Z 4M3, Canada
Abstract
Considerable work has been done in the past on the phase equilibria and physical properties of thermal cements heated directly to high temperatures. In thermal recovery oil wells the cement sheath is, however, cured for days to years at temperatures of 40°C or less before it is subjected to steam injection temperatures of up to about 320°C. The effects of this alternative curing regime have not been well documented. Here, the impact of pre-curing samples for 1, 14 and 28 days at 35"c before heating to 230°C on phase assemblages, morphologies and physical properties of thermal cement were investigated. Control samples included thermal cements heated directly to high temperature as well as samples cured only at 35 °C. Xonotlite formed the predominant phase in the pre-cured thermal cements instead of the tobermorite found in the control sample heated directly to
23o"c.
Although all pre-cured samples were predominantly xonotlite, their morphological characteristics of the phase assemblages were found to vary distinctly with pre-curing time. Significant differences between the pre-cured and directly cured samples were also observed in terms of porosity, permeability and mechanical behaviour.I. Introduction
Enhanced heavy oil recovery uses steam delivered to the production zone either by cyclic steam injection°·2) or steam flood techniquesc3•4) to heat the oil and allow easier extraction. As in conventional oil and gas wells, the annulus between rock formation and the metal casing pipe is filled with cement. In enhanced recovery wells the cement is cured at temperatures less than or
equal to 40°C, producing amorphous C-S-H gel, Ca(OH)2, ettringite and other low temperature hydration products. The degree of hydration, morphological characteristics and physical performance of the cured cement is dependent on the curing temperature and time prior to steam injection which can be from days to years after the cement has set. This differs from conventional high temperature wells such as geothermal wells where the cement is exposed to temperature before it sets. Steam temperatures in enhanced oil recovery wells can range as high as 320°C, although temperatures in the range of 230°C are more common.
Portland cement hydration undergoes significant changes on hydrothermal curing above ll0°C with formation of meta-stable and stable crystalline calcium silicate hydrates (Sl. Portland based oil well cements used above l10°C contain 35-45% silica flour by weight of cement (bwoc) to prevent formation of crystalline alpha-dicalcium silicate hydrate Ca2Si03(0H)2 (a-C2SH), a phase that is associated with a reduction in solid volume, increased permeability and decrease in compressive strength over time<6l. Lowering the calcium to silica (C/S) ratio from between 2.0- 3.0 in a neat Portland oil well cement to 0.8 - 1.0 in an Portland oil well cement/ silica flour blend (thermal cement) produces crystalline calcium silicates hydrates that are stable over a range of temperatures and provide good compressive strength and low permeability.(7) The resulting phase equilibria and stability fields of crystalline calcium silicate hydrates over the temperature range of 110 - 320oC have been well documented.<5•8•9J Tobermorite, truscottite, gyrolite, xonotlite, foshagite and/or other calcium silicate hydrates have been reported depending predominantly on curing condition and CIS ratio.<9•10l Hydrogamet01l anorthite<12l and calcium aluminium silicate hydrates such as aluminium substituted tobermorite<SJ may also form due to the aluminate phases present in cement. Although the phase equilibria are well studied the literature on the effect of the phases formed on physical properties is minimal(7).
In studies reported to date the cement has been heated to and cured at elevated temperature, whereas in the case of enhanced recovery wells the cement is cured at temperatures less than or equal to 40°C prior to steam injection. In general, the oil well industry considers that the use of thermal cement in enhanced recovery wells should provide a phase assemblage similar to that of the same thermal cement heated directly to temperature. However, from studies in the pure Ca0-Si02-H20 system it is known that the starting material can have a significant impact
on the phase assemblage03•14) and stability at elevated temperature. Conversion of pre-existing
low temperature hydrated cement phases to crystalline hydration products may not necessarily produce the same phase assemblages or physical properties as those of an anhydrous cement mixed with water and heated directly to temperature. The steam induced phase conversion of an already established cement hydration matrix may also cause stresses that can affect the matrix's integrity. As cement sheath performance is considered to be a key requirement for enhanced heavy oil recovery,05•16) understanding the potential ・ヲヲ・」エセ@ of steam treatment is of considerable
importance to the industry. At the same time, the absence of information on the effects of heating of this type of "pre-cured" samples suggests the need for investigation at a fundamental level. The purpose of this study was therefore to investigate the effects on phase equilibria, morphology and physical properties that result from heating thermal cements cured at 35 °C for 1, 14 and 28 days to 230°C in order to understand the results of phase conversion of hydrated cement matrices pre-cured at low temperatures and the potential for impact of the phase conversion on the well sheath. The results were interpreted by comparison to control samples that were immediately heated to 230 °C or cured only at 35 °C.
II. Experimental Procedure
( 1) Materials and Sample Preparation
Lehigh Inland (Calgary, AB, Canada) Class G oil well cement(l7) was used for the study. Details of the chemical and physical characterization data are summarized in Table 1. Mineralogical composition was determined from XRF oxide analysis provided by the manufacturer using the Bogue calculation and from XRD data using Rietveld whole-pattern fitting using TOP AS (Bruker, Billerica, MA, USA) software. Silica flour (Sil Industrial Minerals Inc., Calgary, AB, Canada) was used in the cements to provide thermal stability at temperatures above 11 0°C. Compositional data produced by petrographic analysis and other data on the silica flour are provided in Table 1.
The Class G cement was dry blended with 40% bwoc silica flour and mixed with water at a water/( cement+ silica flour) ratio of 0.4 in a Waring blender and conditioned for 20 minutes in an atmospheric consistometer at 25°C according to API/ISO 10426-2-2003.08> The mixing and
conditioning regime was intended to be representative of mixing and pumping cement down hole in an oil well. Stability of the mix design in relation to particle settling had previously been determined using the API/ISO 10426-2-2003 well-simulation slurry stability test method.08) The
slurry was poured into conventional 5cm x 5cm x 5cm cube brass molds for compressive strength measurement and air permeability samples and 2cm x 2cm x 16 em bar stainless steel molds for samples for the other measurements. The molds were then placed in a water bath at 35°C for time periods as indicated in Table 2 before demolding. Demolded samples were examined to ensure that sedimentation of the samples had not taken place. Samples for thermal curing were placed in a curing chamber (CTE, Tulsa, OK, USA) heated to 230°C over a 4 hours period, maintained at 230°C for 24 hours and then allowed to cool to 25°C over 48 hours to
prevent thermal shocking. Pressure of the curing chamber was maintained at the maximum possible value, 20.7 MPa, in order to ensure the water in the samples remained liquid. High temperature control samples were put directly into the curing chamber and cured at 230°C under the same curing regime as the pre-cured experimental samples. The total time of cure was the same for both the experimental and low temperature control samples. Table 2 summarizes the test conditions and associated nomenclature used in this paper. Tests on the low temperature samples were carried out immediately after curing was completed. Tests on the high temperature samples, which would not be expected to undergo further hydration, were carried out within 4 days of the end of the curing cycle, with samples kept in sealed containers until needed.
(2) Mineralogical and morphological analysis
Samples for SEM analysis (Hitachi S4800, Tokyo, Japan) were prepared from exposed fracture surfaces cut with a saw (Buehler Isomet, Lake Buff, Illinois) in isopropanol, dried in a convection oven at 100°C for 2 hours to ensure all remaining water was removed, cooled and then mounted on aluminum stubs for imaging, with the SEM operating at 1.2 kV accelerating voltage, 7 セMエa@ emission current and at an approximately 9 mrn working distance. The combination of the field emission gun technology in the SEM with the operating conditions meant that high resolution imaging could be undertaken without metallizationc19). Vacuum dried
internal fragments taken from crushed bars were ground to pass a 75 micron sieve and used to determine the mineralogy by X-ray diffraction (XRD) (Rigaku DMAXB, Woodlands, TX) with CuKaradiation, a 5° to 85° 28 range, 0.03° step size and an 18 second/step count rate. Duplicate samples were tested to ensure the results were consistent.
(3) Measurement of physical parameters
Compressive strength data was obtained on duplicate cube samples using a hydraulic press (M&I Testing Equipment, Dundas, ON, Canada with Admet, Norwood, MA, USA, Precise Digital Controller) at a load rate of 30 Kg/s. With the exception of the sample material and bar dimensions, flexural strength measurements were carried out on sets of three bars according to ASTM C348(ZO) using a mechanical testing system (Instron Model 5566, Universal Testing Machine, Norwood, MA, USA) with a 2kN load cell and sample bars loaded in 3 point bending at a rate of 300 N/min. Before flexural testing the bars were dry polished using 600 11m grit paper to remove surface defects that might cause premature failure.
Two cross-sections for each sample were cut from untested bars using a diamond saw. One of the cut surfaces of each sample was polished to ensure a smooth contact surface when the sample was mounted in an automated rnicrohardness tester (Microhardness Tester, CSM Instruments, Peseux, Switzerland). The surface to be tested was left unpolished. After mounting, force was applied to the samples using a diamond Vicker's hardness point at a rate of 6.000 N/rnin to a maximum value of 3.000 N, and the depth of penetration simultaneously recorded for each measurement. The load was held constant for 15 seconds before reducing at a rate 6.000 N/rnin. Hardness and elastic modulus values were then calculated by the instrument software using the method of Oliver and Pharr<21). A total of twenty-five measurements were made on a 5 x 5 grid with a 2 mm separation between measurement points on each cross section giving a total of 50 measurements per sample.
The microhardness measurements were examined and results that did not exhibit a smooth, monotonic increase in hardness with increasing displacement into the sample were removed to ensure the measurements did not include large scale porosity or silica flour. The
average modulus of elastic modulus and Vicker's microhardness values were determined for each specimen. Standard deviations of the results for each data were determined. Each data set was tested to determine if it could be considered a normal distribution using the Lilliefors test<22). The null hypothesis that the sample sets were normal was accepted at the 0.05 significance level for all of the samples.
Variances [the square of the standard deviation]<23) were then calculated. Comparisons between the data calculated for each sample were made using a two tailed standard normal (Z) test with the null hypothesis that the two distributions were really the same<23). This test evaluated the probability that two separate sets (for example, 4LT and 1LT-1HT-2C samples) were really subsets of the same data set. High calculated values of Z correspond to a high probability that the sample sets are not the same.
Reserved sample material of approximately 0.5 g were analysed in a porosimeter at low and high pressure by Quantochrome Inc. (Quantochrome Poremaster GT Porosimeter, Boynton Beach, FL, USA) and at the National Research Council Canada. Duplicate tests were performed on the samples to confirm the results, with typical values being shown. Permeability testing was performed at Core Laboratories Canada Ltd, Calgary, AB, Canada, on cores cut from cubes. Air permeability was measured at ambient pressure and at three incrementally hydrostatic net confining pressures of 5520, 6900 and 10340 kPa using an automated system (Core Laboratory Instruments, CMS 300 Automated Permeameter, Houston, TX, USA). The expense of this test precluded full duplicate samples, but duplicates measurements were made on the 31LT and 28LT-1HT-2C samples and used to provide the experimental uncertainty shown for the measurements.
III. Results (1) Mineralogy and Morphology
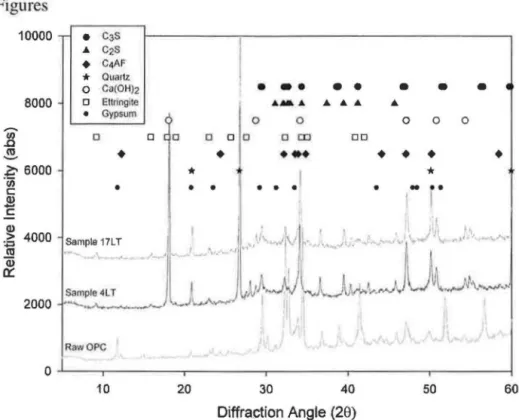
XRD and TGA measurements were used to follow the changes in the anhydrous phases, the development of the hydration products and the mineralogy of the heat treated samples. The phase development in the low temperature samples occurred as would be expected from the
literature(! I)' with the anhydrous phases reacting with the mix water to produce calcium silicate
hydrate (C-S-H), calcium hydroxide (Ca(OH)2) and ettringite (Figure la). Amounts of reaction
product increased with time of cure as seen in sample 17LT as compared to sample 4LT (Figure la) with the anhydrous phases being correspondingly reduced compared to the anhydrous sample. The phases seen for sample 31LT (not shown) were similar to those seen for sample 17LT.
Sample 1HT-2C also shows the phase assemblage (Figure lb) that would be expected from the literature<5•8•9•24•25). Curing the sample at 230 °C produced 11A tobermorite with some
xonotlite. Katoite was also present in this sample. In addition, the data suggests the presence of some residual C-S-H, based on a broad background hump in the range 25-35° 29. Peaks from unreacted silica flour and C2S were also identified. In contrast, the predominant phase in
pre-cured experimental samples was xonotlite (Figure lb). Tobermorite peaks at 16.3°, 30.0° and 39.4° 29 were only identifiable in sample 1LT-1HT-2C, which also showed a small unreacted silica flour peak at 26.7 ° 29. Samples 14LT-1HT-2C and 28LT-1HT-2C had very similar phase assemblages and therefore only the former is shown in the figure. The XRD results were
confirmed by TGA measurements<26), which also showed that only a small amount of tobermorite
was present in sample 1LT-1HT-2C as compared to 1HT-2C. Further details on the mineralogy of the samples and minor phases appear elsewhere.<26)
The results of phase analysis suggest that the amount of anhydrous phases present in the sample at the time of heating is directly related to relative degree of formation of tobermorite and xonotlite upon heating. Immediate curing produced mostly tobermorite, curing after 1 day of hydration produced xonotlite with some tobermorite, while curing after 14 or 28 days of hydration produced almost entirely xonotlite. This route to producing xonotlite by pre-curing samples has not been reported previously in the literature, where xonotlite has been synthesized directly from silica and calcium hydroxide03) or by conversion of tobermoritec27).
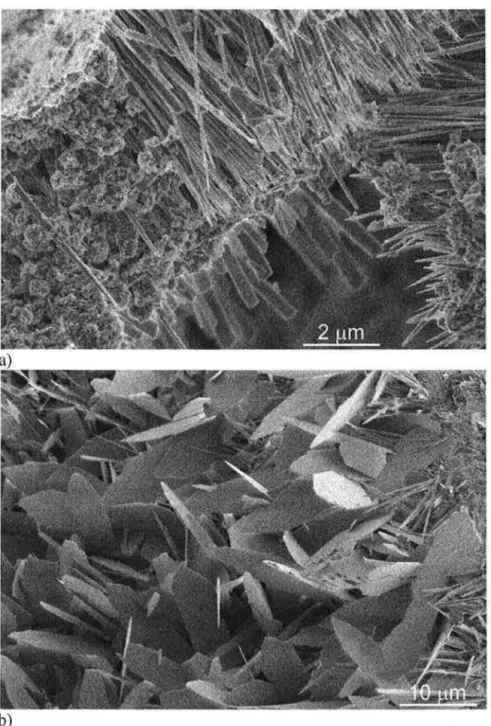
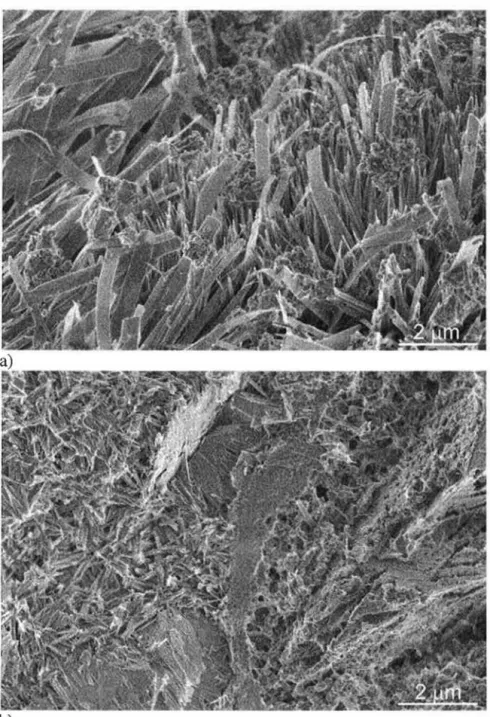
Although the pre-cured samples were primarily composed of xonotlite, SEM examination of sample fracture surfaces showed that their morphology depended on the length of pre-curing. TypicallLT-1HT-2C fracture surfaces showed what appeared to be regions of blunt needles and dense calcium silicate structures in addition to regions of an elongated platy material (Figure 2). Taylor(IO) indicated that both xonotlite and tobermorite may have a lath or needle like morphology, but that 11A tobermorite can also have the form of elongated plates and xonotlite a dense structure in the form of a aggregated needles. The plates in Figure 2b may therefore be tobermorite, the blunt needles in Figure 2a tobermorite or xonotlite and the dense hydration product in Figure 2a either xonotlite or amorphous C-S-H.
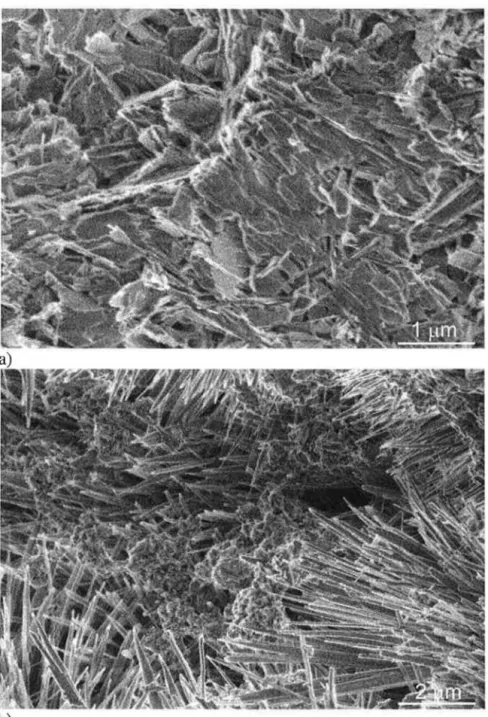
The 14LT-1HT-2C fracture surface images also showed a high number of regions with flat lath structures (Figure 3a), but also regions of dense, fibrous appearing hydration product (Figure 3b ). The flat laths in Figure 3a could be examples of either tobermorite or xonotlite, however, phase analysis suggests that an identification as xonotlite is more appropriate. In contrast, the dense structure in Figure 3b appears to consist of aggregated needles and was also identified as xonotlite. The fracture surfaces for sample 28LT-1HT-2C were similar to those for sample 14LT-1HT-2C and are not shown.
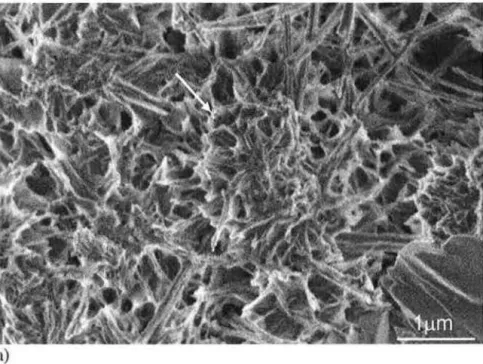
The three control samples did not have similar fracture surfaces to those observed for the three experimental samples. SEM imaging of the sample 4LT fracture surface showed regions of flat platy structures consistent with Ca(OH)2 , ettringite needles and regions of porous C-S-H that at higher magnification had a globular structure (Figure 4, arrow) similar to that reported in the literature.l28) The 17LT amd 31LT fracture surfaces (not shown) had a similar, but denser microstructure, as would be expected from longer curing times. Dense hydration products were common throughout the examined sample lHT -2C fracture surfaces (Figure 5a) with needle-like structures predominating at the edges of the larger pores (Figure 5b). The layered plate morphology of the dense material in Figure 5a is typical of tobermorite00) and would be expected from the phase analysis. The needle-like structure00) as seen in Figure 5b can be either tobermorite or xonotlite.
In addition to changes m phase assemblage and fracture surface morphology, the different curing methods also affected the pore size distribution of the samples (Figure 6). The low temperature samples had pore size distributions typical of those found in the literaturec29), with most of the pores being between 0.5 セュ@ and 0.02 セュ@ in diameter. The sample cured directly to temperature, lHT -2C, showed a much tighter pore size distribution and had -1.8% of its total volume filled with pores greater than 200 セュゥョ@ diameter, with a rapid increase in pore
volume below a diameter of 0.04 セュN@ The experimental samples all had similar rapid increases
in pore volume, but they occurred at a higher diameter, around 0.08 セュN@ Sample 1LT-lHT-2C
had a total intrusion volume of -30%, but samples 14LT-1HT-2C and 28LT-1HT-2C had much higher total intrusion volumes of -40% and -46% respectively. In each case the experimental samples total intrusion volume was much higher than that seen in the corresponding low temperature control sample.
(2) Mechanical Properties
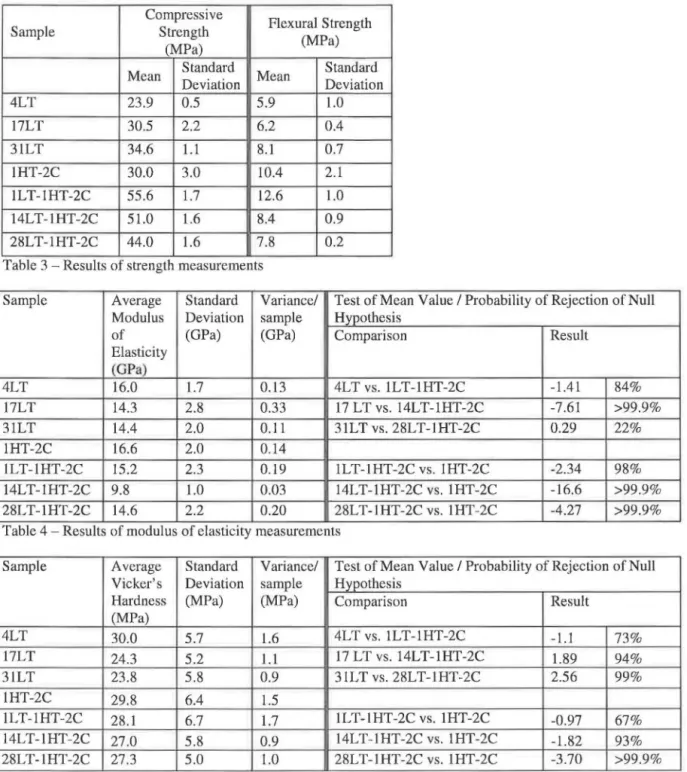
All of the experimental samples had compressive strengths that were significantly higher than those of the corresponding low temperature controls (Table 3), although increasing pre-curing times resulted in decreasing strengths. Their compressive strengths were also higher than that of high temperature control sample 1HT-2C. Samples 1LT-1HT-2C and 14LT-1HT-2C also had flexural strengths that were higher than their corresponding low temperature controls (Table 3), but the flexural strength of sample 28LT-1HT-2C was the same as the low temperature control 31LT within the experimental uncertainty. Increasing pre-curing time again produced reduced strengths in the pre-cured samples.
The differences between control and experimental samples were also apparent in the modulus of elasticity (Table 4) and the Vicker's microhardness values (Table 5). Moduli of elasticity were lower for the experimental samples 1LT-1HT-2C and 14LT-1HT-2C than the corresponding low temperature controls at a statistically significant level. In contrast, the statistical analysis of the comparison between samples 31LT and 28LT-1HT-2C suggested the modulus of elasticity values should be treated as being statistically the same. All of the experimental samples also had modulus of elasticity values that were lower than the those of the high temperature control (confidence levels 98%+).
The Vicker's hardness measurements followed a more complex pattern, with the 4LT sample having the highest hardness, followed by the high temperature samples and then samples 17LT and 31LT. The higher Vicker's hardness values measured for the 4LT sample compared to 17LT and 28LT were anomalous, since it would be expected that the longer curing times would have the higher values. The degree of confidence that the hardness values for 1LT-1HT-2C were statistically different from those of the corresponding controls was relatively low (73% for 4LT,
and 67% for 1HT-2C), but the differences between the remaining experimental samples and the controls were found to be different at a much higher level (93%+).
IV. Discussion
The differences in microstructure, morphology and mechanical properties between sample 1LT-1HT-2C and both the low and high temperature controls were significant. Differences between the low temperature control samples and the hydrothermally treated samples were expected due to transformation of amorphous silicate phases to high temperature crystalline phases. (S) The differences observed between the high temperature control 1 HT-2C and experimental sample 1 LT -1 HT-2C, however, demonstrated that even a short period of pre-curing can have significant impact on the results of the phase conversion process. Although the total porosity of lLT -1HT -2C was higher (Figure 6) it had a lower percentage of very large diameter pores. In addition, while the predominant phases in both samples are tobermorite and xonotlite (Figure 1), sample 1LT-2C had a much higher ratio of xonotlite to tobermorite than 1HT-2Cc26>. It also had a lower content of unreacted silica flour and does not appear to have any katoite. Finally, the appearance of the morphology of the phases in the two samples was quite different. Both samples have lath like structures located near pores, but those in sample lLT-lHT -2C are blunter and more compact and flat and elongated plates were also seen (Figure 2). Regions of dense hydration product were fibrous in appearance in sample 1LT-1HT-2C, while they had a layered appearance in sample 1HT-2C (Figure 4).
These differences may all play a role in the differences between the measured mechanical properties of samples 1LT-1HT-2C and 1HT-2C. Strengths in cementitious materials are dependent both on the properties of the material itself and on their pore size distribution. In
pore size distribution plays a predominant role in material strength. It has been shown that pores greater than 10 nm in diameter are the most significant in some cementitious systems<30), but recent work(3J) has also suggested that the smaller diameter pores can also significantly affect the response of hydrated cement to mechanical loads. The role of porosity here is unclear, but on balance the high percentage of large diameter pores in sample 1HT-2C was likely to contribute significantly to its relative weakness. In addition, if it were not fully bonded to the matrix, the unreacted silica flour in the sample would allow cracks to propagate easily around its perimeter, effectively acting as an additional source of large diameter porosity.
The morphology of the samples may also make a difference in performance. While examples of plates such as Figure 3b are seen in sample 1LT -1HT -2C, the bulk of the structure is made up of dense blunt needles or what appears to be small xonotlite aggregates00) such as are seen in Figure 2a. These structures may be more resistant to fracture than the layered plates seen in Figure 4b for sample 1HT-2C. Finally, it is possible that the difference in composition between the two samples affected the mechanical properties. Recent work<32) suggests that increasing xonotlite content at the expense of tobermorite is likely to result in an increase in compressive strength, which would fit with the differences observed here. Previous research0 ·33), however, has shown that xonotlite was weaker than tobermorite, making difficult to draw conclusions about the effect of composition on the strengths observed here.
The reduction in strength produced by longer pre-curing times was likely due to the differences in porosity in the samples. As noted earlier, the phase assemblages (Figure 1) and the microstructure of the three experimental samples (Figures 2 and 3) do not appear to be highly dissimilar from each other. Many of the differences that do exist would tend to suggest that samples 14LT-1HT-2C and 28LT-1HT-2C should be stronger than 1LT-1HT-2C. The more
complete reaction of silica flour eliminated a possible source of weakness, while the apparent lack of tobermorite in samples 14LT-1HT-2C and 28LT-1HT-2C would not be expected to produce a significant strength change. Finally, the plates seen on the fracture surfaces of sample 1LT-1HT-2C (Figure 2b) do not appear in the other two experimental samples, with the longer laths in Figure 3a appearing instead. This change would also be expected to increase the strength of the material, not reduce it.
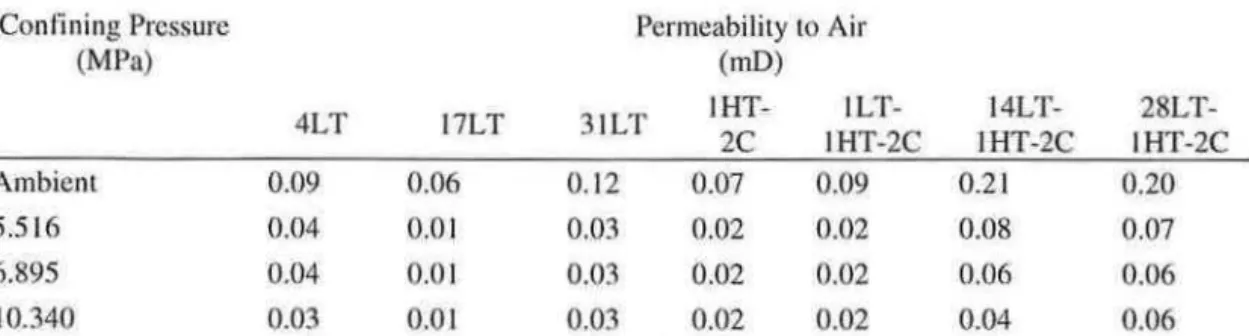
While the phase assemblages and microstructure do not appear to show mechanically significant differences between the experimental samples, the difference in porosity between 1LT-1HT-2C on one hand and 14LT-1HT-2C and 28LT-1HT-2C on the other was more than enough to produce a difference in mechanical strength. A subsequent examination of the air permeability of the samples (Table 6) showed that 14LT-1HT-2C and 28LT-1HT-2C also had high air permeabilities compared to any of the other samples. Mercury intrusion porosimetry measures the minimum pore diameter in a pore and will not measure closed pores. The air permeability measurements suggest that some of the increased porosity seen in the samples with longer pre-curing times was due to the opening of closed pores, rather than solely due to increased porosity. Both the increased porosity and the opening of closed pores would be expected to have contributed to the reduced strengths of those samples.
The differences between the results of the phase transformations thus suggest that the extent of the hydration process before the transformation takes place is a key factor in determining the resulting mechanical performance. Additional work is needed to fully understand the mechanisms behind this finding. It is speculated, however, that the combination of the amount of unreacted calcium silicates in the system, the ease of access to those calcium silicates and the available free or loosely bound water all play a role in the final properties. In
sample 1HT-2C, the cement grains were unreacted before heating and therefore at full size, as was the silica flour. Packing of the constituents of the blend would have resulted in many gaps between particles, which would have been filled by the mix water. The resulting composition upon heating was largely tobermorite and the sample had significant large diameter pore content.
In sample 1LT-1HT-2C, the partial reaction of the cement at low temperatures produced both C-S-H and Ca(OHh. At that stage in the hydration reaction, diffusion processes would have just become predominant(! I) and unreacted calcium silicates would be present in the material covered by inner hydration products. Gaps between the silica flour and the inner products would have been filled with porous outer product material. A considerable amount of free water would have remained in the sample. Here the phase conversion produced xonotlite with some tobermorite, with the excess water entering the pores in the sample. The greater density of xonotlite (2.7 gm/cm3) versus tobermorite ( -2.4 gm/cm3)c34) likely contributed to the observed increase in pore diameter. Finally, in samples 14LT-1HT-2C and 28LT-1HT-2C, the low temperature reaction had progressed to a significantly higher degree, reducing the amount of unreacted calcium silicates and minor phases, producing denser inner and outer hydration products and leaving little free water. The resulting phase conversion in this case produced xonotlite without significant tobermorite being present, resulting in a further increase in porosity. The remaining excess water again entered the sample pores. The difference in the results of the conversions suggests that the preliminary formation of C-S-H and Ca(OHh may create an environment where xonotlite formation is favoured over tobermorite. Work in a pure synthetic C-S-H-Ca(OH)2-Si02-water system would confirm this possibility.
V. Summary
Changing the starting composition or continuous curing temperature of a cement can alter its resulting mineralogy, morphology and physical properties. The results presented here show that changes in the curing temperature part way through the curing process can have as significant an effect. Pre-curing a sample for 1 day at 35°C and then raising it to temperature 230°C produced a phase assemblage primarily composed of xonotlite with higher flexural and compressive strength compared to a sample which was immediately heated to 230°C and was primarily composed of tobermorite. The changes in strength appear to be due to differences in phase assemblage, morphology and porosity of the hydration products. Pre-curing samples for 14 or 28 days before raising their temperature to 230°C produced a phase assemblage that was similar to that of the sample pre-cured at 35°C for only 1 day, but samples that were weaker in both flexural and compressive strength. The strength differences appeared to be due to the presence of a much higher degree of porosity and a higher degree of pore interconnectivity in the samples that were pre-cured for longer time periods.
In an industrial context, permeability and matrix strength are considered important parameters in relation to well cement sheath integrity05). Pre-curing for 14 or 28 days produced samples with reduced strength and heightened air permeability. Although the latter parameter was still well below the values quoted in literature as being detrimental<35
l,
it is possible that longer pre-curing times may be more problematic. The data here, although limited, therefore show that changes in the phase equilibria need to be considered when designing methodologies for cement sheath integrity on exposure to steam stimulation.Finally, it is important to note that the improved flexural and compressive strengths seen in the sample pre-cured for 1 day were obtained using a standard oil well industry cement/silica
flour mix and curing regimes intended to reflect steam treatment conditions. It is therefore possible that modifications to the approach followed here could be used to produce high levels of performance in cementitious materials intended for above ground construction or industrial applications. Further work is underway to explore this possibility.
References
1. C. Chu, "State-of-the-Art Review of Steamflood Field Projects," J. Pet. Tech., 37, 10, 1087-1902 (1985). SPE 11733
2. R.C. Earlougher, "Some Practical Considerations in the Design of Steam Injection Wells," J. Pet. Tech., 21, 1, 79-86 (1969). SPE 2202
3. R.M. Butler, "SAGD Comes of Age", J. Can. Pet. Tech., 37, 7, 9-12 (1998).
4. R.M. Butler, "Application of SAGD, Related Processes Growing Canada", Oil Gas J.,
99, 20, 74-78 (2001).
5. H.F.W. Taylor, "Structure and Composition of Hydrates",
th
International Congress on the Chemistry of Cement, Vol.l, PII 211-2113 (1980).6. L.H Eilers and R.L. Root, "Long-Term Effects of High Temperature on Strength Retrogression of Cements". SPE 5028 (1974).
7. L.H. Eilers, E.B. Nelson and L.K. Moran, "High Temperature Cement Compositions Pectolite, Scawtite, Truscottite or Xonotlite Which Do You Want?", SPE 9286 (1980). 8. R.I. Harker, "Dehydration Series in the System CaSi03-Si02-H20", J. Am. Ceram. Soc.
47, 521-529 (1964).
9. N. Mellor, K, Kyritsis and C. Hall, "The Mineralogy of the CaO-Ah03-Si02-H20 (CASH) System from 200 to 350°C", Cem. Concr. Res. 39, 45-53 (2009).
10. H.F.W. Taylor, The Chemistry of Cements, Academic Press, London, 1964. 11. H.F.W Taylor, Cement Chemistry 2nd Ed., Thomas Telford, London (1997).
12. K.Luke, H.F.W. Taylor and G.L.Kalousek, "Some Factors Affecting Formation of Truscottite and Xonotlite at 300- 350°C", Cem. Concr. Res., 11, 197-203 (1981). 13. K. Luke and H.F.W. Taylor, "Equilibria and Non-Equilibria in the Formation of
Xonotlite and Truscottite", Cem. Concr. Res., 14, 657-662 (1984).
14. S. Hiroyoshi and M. Grutzeck, "Effect of Starting Materials on the Synthesis of Tobermorite", Mat. Res, Soc. Symp. Proc., 245, 235-240 (1992).
15. E.B. Nelson and V. Barlet-Gouedard, "Thermal Cements", in Well Cementing Ed. E.B. Nelson and D. Guillot, Sugarland Texas: Schlumberger, 335-336 (2006).
16. G. DeBruijn, et al., "Flexible Cement Improves Wellbore Integrity in SAGD Wells", SPEIIADC 119960 (2009).
17. API/ISO 10426-1-2001, "Specification for Cement and Materials for Well Cementing," API Specification lOA (Twenty-third Edition), Washington, DC, USA (2002)
18. API/ISO 10426-2-2003, "Recommended Practice for Testing Well Cements," API RP JOB-2 (Fifth Edition), Washington, DC, USA (2005).
19. J. M. Makar and G.W. Chan, "End of the Induction Period in Ordinary Portland Cement as Examined by High Resolution Scanning Electron Microscopy", J. Am. Ceram. Soc.,
91, 1292-1299 (2008).
20. ASTM, "ASTM C348 - 08 Standard Test Method for Flexural Strength of Hydraulic-Cement Mortars", ASTM International, West Conshohocken, PA, USA (2008).
21. W.C. Oliver & G.M. Pharr, "Improved Technique for Determining Hardness and Elastic Modulus Using Load and Displacement Sensing Indentation Experiments", J. Matr. Res.,
1564-1580 (1992).
22. H.W. Lilliefors, "On the Kolmogorov-Smirnov Test for Normality with Mean and Variance Unknown", J. Am. Stat. Assoc., 62, (1967), pp. 399-402.
23. D. Downing and J. Clark, Statistics the Easy Way, Barron's, Hauppauge, New York (1997).
24. N.B. Milestone and K.G. Ahari, "Hydrothermal Processing of Xonotlite Based Compositions," Adv. App. Cer., 106, 302-308 (2007).
25. X. Huang, D. Jiang and S. Tan, "Novel Hydrothermal Synthesis Method for Tobermorite Fibers and Investigation on their Stability," Matr. Res. Bul., 37, 1885-1892 (2002).
26. J.M. Makar and K. Luke, "Impact of Steam Treatment on the Microstructure and Chemistry of Cured Oil Well Cements", to be presented at the l31h International
Congress on the Chemistry of Cement, Madrid 2011.
27. H.F.W. Taylor, "The Transformation of Tobermorite into Xonotlite", Mineral. Mag., 110-116 (1959).
28. S. Diamond, "Cement Paste Microstructure - An Overview at Several Levels," In:
Hydraulic Cement Pastes: Their Structure and Properties, (C.A. Association, ed.)
Cement and Concrete Association, Wexham Springs, Slough, UK, 3-23 (1976).
29. V.S. Ramuchandran, R.F. Feldman and J.J. Beaudoin, Concrete Science, Heyden and Sons, London, 11-14 (1981).
30. I. Odler and M. RoBler, "Investigations on the Relationship Between Porosity, Structure and Strength of Hydrated Portland Cement Pastes: II. Effect of Pore Structure and of Degree of Hydration", Cern. Cone. Res., 15,401-410 (1985).
31. J.M. Makar, K.Y. Esseghaier, G. Pye, K. Trishchuk and G. W. Chan, "Properties of Cement Paste and Mortar Hydrated with Heavy Water", in preparation
32. K. Kyritsis, C. Hall, D. P. Bentz, N. Meller, and M. A. Wilson, "Relationship Between Engineering Properties, Mineralogy, and Microstructure in Cement-Based Hydroceramic Materials Cured at 200°-350°C," J. Am. Ceram. Soc., 92 [3] 694-701 (2009).
33. K. Luke, "Phase studies of pozzolanic stabilized calcium silicate hydrates at 180 °C",
Cern. Cone. Res., 34, 1725-1732 (2004).
34. John W. Anthony, Richard A. Bideaux, Kenneth W. Bladh, and Monte C. Nichols, Eds., Handbook of Mineralogy, Mineralogical Society of America, Chantilly, VA 20151-1110, USA. http://www.handbookofmineralogy.org/; Accessed May 27, 2011.
35. E.B. Nelson and L.H Eilers, "Cementing Steamflood and Fireflood Wells - Slurry Design",}. Cdn. Petr. Tech., 58-63 (1985).
Tables
Composition (wt%) Glass G Cement Silica flour
Si02 21.0 87.5 CaO 62.0 1.64 Ah03 3.93 4.47 Fe203 4.34 1.18 MgO 2.83 0.40 Na20 0.30 1.25 K20 0.49 1.25 S03 2.87 n/a
s
n/a 0.24L.O.I. (IOOOoC) 1.23 n/a
Insoluble Residue 0.21 n/a
Total Alkalis (as Na20) 0.62 n/a Blaine Fineness (rnz/g) 2.88 Passing 45 11m mesh (%) 53 89 Density (g/crn') 3.15 2.63 Mineralogy Bogue Rietveld c 3s 52.0 54. I c 2s 20.7 24 C3A 3.I1 3.2 C4AF 13.2 I3.9
Table 1 -Raw matenal analysis Sample
Sample Type Curing Conditions Total Curing
Identification Time
4LT Control 4 days at 35°C, cooled to 25°C 4 days
I7LT Control I7 days at 35°C, cooled to 25°C 17 days
31LT Control 31 days at 35°C, cooled to 25°C 3I days
1HT-2C Control 1 day at 230°C, 2 days cooling to 25oC 3 days ILT- IHT-2C Experimental I day at 35°C, I day at 230°C, 2 days cooling to 25 °C 4 days 14LT-1HT-2C Experimental 14 days at 35°C, 1 day at 230°C, 2 days cooling to 25°C 17 days 28LT-1HT-2C Experimental 28 days at 35°C, 1 day at 230°C, 2 days cooling to 25°C 3l days Table 2- Sample identification and curing conditions. Note that sample 1HT-2C was only cured for 3 days total time in order to maintain a consistent high temperature curing and cooling regime.
Compressive
Flexural Strength
Sample Strength
(MPa) (MPa)
Mean Standard Mean Standard Deviation Deviation 4LT 23.9 0.5 5.9 1.0 17LT 30.5 2.2 6.2 0.4 31LT 34.6 1.1 8.1 0.7 1HT-2C 30.0 3.0 10.4 2.1 1LT-1HT-2C 55.6 1.7 12.6 1.0 14LT-1HT-2C 51.0 1.6 8.4 0.9 28LT-1HT-2C 44.0 1.6 7.8 0.2
Table 3 -Results of strength measurements
Sample Average Standard Variance/ Test of Mean Value I Probability of Rejection of Null Modulus Deviation sample Hypothesis
of (GPa) (GPa) Comparison Result
Elasticity (GPa) 4LT 16.0 1.7 0.13 4LT vs. 1LT-1HT-2C -1.41 84% 17LT 14.3 2.8 0.33 17 LT vs. 14LT-1HT-2C -7.61 >99.9 % 31LT 14.4 2.0 0.11 31LT vs. 28LT-1HT-2C 0.29 22% 1HT-2C 16.6 2.0 0.14 1LT-IHT-2C 15.2 2.3 0.19 1LT-1HT-2C vs . 1HT-2C -2.34 98% 14LT-1HT-2C 9.8 1.0 0.03 14LT-1HT-2C vs. 1HT-2C -16.6 >99.9% 28LT-1HT-2C 14.6 2.2 0.20 28LT-1HT-2C vs. 1HT-2C -4.27 >99.9% ..
Table 4 - Results of modulus of elasticity measurements
Sample Average Standard Variance/ Test of Mean Value I Probability of Rejection of Null Vicker's Deviation sample Hypothesis
Hardness (MPa) (MPa) Comparison Result
(MPa) 4LT 30.0 5.7 1.6 4LT vs. 1LT-1HT-2C -1.1 73% 17LT 24.3 5.2 1.1 17 LT vs. 14LT-1HT-2C 1.89 94% 31LT 23 .8 5.8 0.9 31LT vs. 28LT-1HT-2C 2.56 99% 1HT-2C 29.8 6.4 1.5 1LT-1HT-2C 28.1 6.7 1.7 1LT-1HT-2C vs. 1HT-2C -0.97 67% 14LT-1HT-2C 27 .0 5.8 0.9 14LT-1HT-2C vs. 1HT-2C -1.82 93 % 28LT-IHT-2C 27.3 5.0 1.0 28LT-IHT-2C vs. 1HT-2C -3 .70 >99.9% Table 5- Results of VIcker's hardness measurements
Confining Pressure (MPa) Ambielll 5.5 16 6.895 10.340 4LT 0.09 0.04 0.04 0.03 17LT 0.06 0.0 1 0.0 1 O.ot Permeability to Air ( mD) 31 LT IHT- ILT- 14LT-
28LT-2C IHT-2C IHT-2C IHT-2C
0.12 0.07 0.09 0.21 0.20
0.03 0.02 0.02 0.08 0.07
0.03 0.02 0.02 0.06 0.06
0.03 0.02 0.02 0.04 0.06
Table 6 - Air permeability values at different confining air pressures. Experimental uncenaintics are ±0.02 for the ambient measurements and ±0.0 I for tile non-ambient measurements.
Figure 10000 • C3S ..t. C2S + C4AF
*
Oua•tt 0 Ca(OHJ2 8000 D Eltringlte セ@ 6000 1/) c:セ@
セ@ 4000 m Qi 0:: 2000 • Gypsum D D•
• Sample 17LT Sample 4LT--..
... __.___
_,... __ RawOPC 1•
0 D D 0 0•
*
••
• I..
,, ' ...A-·
• •
•
•
•
...
.... ... .... 0 0 0 0 0 w DO.
..
• •
•
•
.I
*
• •-
••
....
_
...
セ BBBB BG@
P セ MMMNMMMMMMMMNMMMMMMMMNMMMMMMMMNMMMMMMMMNMM MMMMセ@ 10 20 30 40 50 60 Diffraction Angle (28)Figure 1 a - Crystalline phase. pre ent .in the unbydrated OPC and in . amples hydrated at 35 °C a determined by X- ray diffraction. Re ult for sample 31LT ,re imilar to tho e for 17LT and not hown . 6000 セ@ '(ij セTPPP@ "E Q) Mセ@
-
m Qi 0:::2000•
•
•
•
•
•
•
••••
-
•
.... .... ... .... ... .... .... .... .... .... .... .... • T ol:lom»rite 4 Xonollilo 0 J<atolllo 0 0*
* Quartz J セ@セLNAセBセ|LNNNN@
Son'Pio I HT • 2C 0 0 0 00 0 0 0 000*
*
ッ セ MMMイMMMMMMMMNMMMMMMMMNMMMMMMMMNMMMMMMMMNMM MMMMMMT@ 10 20 30 40 50 60 Diffraction Angle (28)Figure lb - Crystalline phases present in samples hydrated at 230 °C as determined by X-ray diffraction. Results for sample 28LT-1HT-2C are similar to those for 14LT-1HT-2C and not shown.
b)
Figure 2 -Morphology of fracture surfaces for sample 1LT-1HT-2C: a) Typical surface: blunt needles and dense calcium silicate hydrates; b) platy hydration products
b)
Figure 3- Morphology of typical fracture surfaces for sample 14LT-1HT-2C: a) lathe structures; b) dense calcium silicate hydrates. Sample 28LT-1HT-2C has similar morphology.
Figure 4 - Morphology of typical fracture sutface for sample 4LT (arrow - typical globular structure). Samples hydrated for longer times at 35 °C have a simi lar, but denser morphology.
b)
Figure 5 - Morphology of typical fracture surfaces for sample 1HT-2C: a) dense hydration products; b) needle-like stmctures associated with large pores.
0.5
---·
---0.4 Q)- ··-
··-··-E セ@ 0>
0.3 -c Q) -c ::J .__-
c Q) 0.2 > +::: ctl Ci5a:
0.1 100 4LT 17LT 31LT 1HT-2C 1LT-1HT-2C 14L T-1 HT-2C-III 28L T-1HT-2C · II I i i i i ii
, /
I / i / I ,;· ,_,.-·-·-I ,,..
-···
tf -- - -/ t: /. - ....-:r.c--i!
I' /
'f "
;;, // 1' '
t;
Jt
I I (I /I 1 · : • 10 1 0.1 0.01 Pore Diameter (1-tm)Figure 6 - Effect of curing regime on pore ize distribution