Publisher’s version / Version de l'éditeur:
Physical Review Letters, 115, pp. 193603-1-193603-5, 2015-11-05
READ THESE TERMS AND CONDITIONS CAREFULLY BEFORE USING THIS WEBSITE. https://nrc-publications.canada.ca/eng/copyright
Vous avez des questions? Nous pouvons vous aider. Pour communiquer directement avec un auteur, consultez la
première page de la revue dans laquelle son article a été publié afin de trouver ses coordonnées. Si vous n’arrivez pas à les repérer, communiquez avec nous à PublicationsArchive-ArchivesPublications@nrc-cnrc.gc.ca.
Questions? Contact the NRC Publications Archive team at
PublicationsArchive-ArchivesPublications@nrc-cnrc.gc.ca. If you wish to email the authors directly, please see the first page of the publication for their contact information.
Archives des publications du CNRC
This publication could be one of several versions: author’s original, accepted manuscript or the publisher’s version. / La version de cette publication peut être l’une des suivantes : la version prépublication de l’auteur, la version acceptée du manuscrit ou la version de l’éditeur.
For the publisher’s version, please access the DOI link below./ Pour consulter la version de l’éditeur, utilisez le lien DOI ci-dessous.
https://doi.org/10.1103/PhysRevLett.115.193603
Access and use of this website and the material on it are subject to the Terms and Conditions set forth at
All-optical reconstruction of crystal band structure
Vampa, G.; Hammond, T. J.; Thiré, N.; Schmidt, B. E.; Légaré, F.; McDonald,
C. R.; Brabec, T.; Klug, D. D.; Corkum, P. B.
https://publications-cnrc.canada.ca/fra/droits
L’accès à ce site Web et l’utilisation de son contenu sont assujettis aux conditions présentées dans le site LISEZ CES CONDITIONS ATTENTIVEMENT AVANT D’UTILISER CE SITE WEB.
NRC Publications Record / Notice d'Archives des publications de CNRC:
https://nrc-publications.canada.ca/eng/view/object/?id=bf6df7cb-473e-45a2-954a-873783db068a https://publications-cnrc.canada.ca/fra/voir/objet/?id=bf6df7cb-473e-45a2-954a-873783db068aAll-Optical Reconstruction of Crystal Band Structure
G. Vampa,1,*T. J. Hammond,1 N. Thiré,2 B. E. Schmidt,2 F. Légaré,2 C. R. McDonald,1 T. Brabec,1 D. D. Klug,3 and P. B. Corkum1,3,†
1
Department of Physics, University of Ottawa, Ottawa, Ontario K1N 6N5, Canada
2
INRS-EMT, 1650 Boulevard Lionel-Boulet, CP 1020, Varennes, Québec J3X 1S2, Canada
3
National Research Council of Canada, Ottawa, Ontario K1A 0R6, Canada (Received 25 June 2015; published 5 November 2015)
The band structure of matter determines its properties. In solids, it is typically mapped with angle-resolved photoemission spectroscopy, in which the momentum and the energy of incoherent electrons are independently measured. Sometimes, however, photoelectrons are difficult or impossible to detect. Here we demonstrate an all-optical technique to reconstruct momentum-dependent band gaps by exploiting the coherent motion of electron-hole pairs driven by intense midinfrared femtosecond laser pulses. Applying the method to experimental data for a semiconductor ZnO crystal, we identify the split-off valence band as making the greatest contribution to tunneling to the conduction band. Our new band structure measurement technique is intrinsically bulk sensitive, does not require a vacuum, and has high temporal resolution, making it suitable to study reactions at ambient conditions, matter under extreme pressures, and ultrafast transient modifications to band structures.
DOI:10.1103/PhysRevLett.115.193603 PACS numbers: 42.50.Hz, 42.65.Ky, 71.90.+q, 72.20.Ht
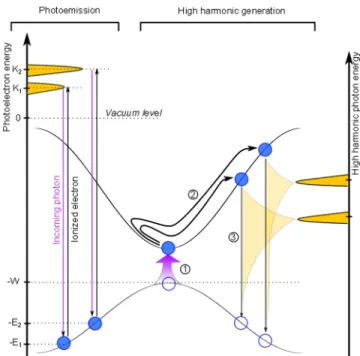
As explained by Einstein in 1905[1], when a photon of sufficient energy hν impinges on a material, it liberates an electron with kinetic energy K ¼ hν-W-E, where W is the work function of the material and E is the binding energy of the electron in it. The process is depicted in the left side of Fig.1. If the kinetic energy and the vector momentum of the electron are measured, the momentum-dependent bind-ing energy εðkÞ, or the “structure” of the occupied bands, can be obtained. This is the working principle of angle-resolved photoemission spectroscopy (ARPES)[2], the key tool to understand novel systems, such as high-temperature superconductors[3,4]and other strongly correlated materi-als like graphene [5–7] and topological insulators [8,9]. Conversely, in “inverse photoemission” [10], an electron can be externally injected into higher-lying unoccupied bands and the photon emitted upon its decay to lower-lying states is measured.
We discuss a coherent analogue to inverse photoemis-sion, in which we measure photons emitted upon recombi-nation of electron-hole pairs that are internally created and accelerated by a strong laser field. By linking photon energy to momentum of the pair at recombination, we map the momentum-dependent band gap between the bands occupied by the electron and the hole.
The possibility of using the nondestructive interaction with intense laser fields of photon energies ∼1 eV has gained relevance only recently[11–13]. A laser field with photon energy much smaller than the minimum band gap of a semiconductor crystal generates high odd order harmonics of its fundamental frequency when focused to reach an electric field as strong as a few V=Å [11]. Under such a
FIG. 1 (color online). Comparison between photoemission and high harmonic generation. In photoemission experiments, an incoming photon (purple arrow) causes emission of an electron (black vertical arrow) with kinetic energy (K1 and K2)
propor-tional to the initial binding energy (E1and E2). In high harmonic
generation, an electron first tunnels (marked by circled 1) to the conduction band. The electron-hole pair is then accelerated (circled 2) and recombines (circled 3) emitting a harmonic photon in the process. Electrons and holes are denoted by filled and empty blue circles, respectively. Two trajectories are iden-tified by the wiggled solid black arrows, corresponding to different times of creation and recollision of the electron-hole pair.
strong field an electron first tunnels from the top of the valence to the bottom of the conduction band (circled 1 in Fig.1). The electron and the hole are then accelerated to high crystal momentum (circled 2 in Fig.1), traveling a signifi-cant portion of the Brillouin zone along the laser polarization and, during this process, storing information about the underlying band. In space, they are accelerated in opposite directions with a velocity determined by the band in which they move. Information about the bands is imprinted on a short wavelength photon when the field reverses direction and the electron and the hole are driven back towards each other. Upon reencounter, they can recombine (with a vertical transition) at a crystal momentum that is determined by the time of creation of the pair, emitting a harmonic photon in the process with energy equal to the band gap at the momentum of reencounter[14] (circled 3 in Fig.1). Two of these trajectories are identified by the wiggled solid arrows during step 2 in Fig.1. Knowledge of the trajectory links photon energy to momentum of the recolliding electron-hole pair, in a similar fashion that photoelectron energy is linked to its momentum in ARPES. However, high harmonic generation from solids does not require vacuum. A recent experiment proved that recollision and recombination of the electron-hole pair dominates over other competing mechanisms for excitation with midinfrared laser pulses
[15]. For longer (THz) [16] and shorter (near-infrared) pulses[17], the recollision contribution to the high harmon-ics is suppressed. Therefore, in the following we focus our attention to harmonics obtained from recollision.
Information about the trajectories, and therewith about the band structure, is obtained by perturbing the high
harmonic generation process with a weak second harmonic field [18,15], thereby producing even harmonics. Their strength modulates as the second harmonic is delayed relative to the fundamental. A simulated spectrogram is shown in Fig.2(a)for a model hexagonal crystal interacting with a fundamental midinfrared laser pulse and its second harmonic (at an intensity of 10−5of the fundamental). The
fundamental field has a peak strength of 0.28 V=Å and a central wavelength of 3.66 μm; both fields are linearly polarized along the Γ − M direction of the Brillouin zone. Details about the simulation are reported in the Supplemental Material[19]. The phase of the modulation Φosc, plotted as red dots with error bars in Fig.2(b), differs
between harmonic orders. It is this quantity that uniquely tags the trajectories and identifies the band structure of the material. A realistic experimental uncertainty on Φosc is
∼25 mrad, and is artificially added to simulate noise in an experiment. The band gap between the valence and con-duction bands is plotted in Fig.2(c), red line, up to the edge of the Brillouin zone. Its analytical form is reported in the caption of Fig.2. This is the “target” band structure for a reconstruction procedure.
To understand the origin of the even harmonics and their intensity modulation it is useful to compare the high harmonic generation process to a balanced interferometer
[18]: the odd harmonic structure in the presence of the fundamental field arises from the interference of two equal but oppositely directed recollisions at subsequent half laser cycles—corresponding to two equal length arms of the interferometer. The second harmonic breaks this symmetry by lengthening one arm while shorting the other, therefore leading to imperfect interference and the appearance of
8 12 16 20 24 28 32 0 2 4 6 8 10 12 Harmonic order Delay (rad) (a)
Spectral intensity (arb. units) x10−7 0 2 4 8 12 16 20 24 28 32 4.2 4.4 4.6 4.8 5 5.2 5.4 Harmonic order Φ osc (2N) (rad) (b) −0.1 0 0.1 0.2 0.3 0.4 0.5 12 16 20 24 28 32
Momentum (reciprocal lattice vectors)
Bandgap energy (units of
ω ) (c) δk Target Retrieved Target Retrieved 4.1 5.4 6.8 8.1 9.5 10.8
Bandgap energy (eV)
FIG. 2 (color online). Reconstruction of the bands. (a) High harmonic spectrum obtained from the target band structure as a function of delay between fundamental and second harmonic fields. The red line with dots is the optimum phase Φosc. (b) Target Φosc(red dots with
error bars) compared to those associated with the retrieved band structures (gray lines). (c) Target (red line) and retrieved (gray lines) momentum-dependent band gaps. The Brillouin zone extends up to half of the reciprocal lattice vector. The target band gap is εðkÞ ¼ εgþ 0.139 ½1 − cosðkaÞ þ 0.011 [1 − cosð2kaÞ], and approximates that of a ZnO crystal as obtained from ab initio
calculations. The crystal and laser parameters are defined in Table S2 of the Supplemental Material[19].
the even harmonics—the interferometer is unbalanced. The optimum delay Φosc that leads to maximum even
harmonic emission, corresponding to maximum symmetry breaking, differs between even harmonic orders because each trajectory is launched and is terminated at different times, and therefore experiences the second harmonic differently.
To reconstruct the target band gap, we compare Φosc of
the simulated experiment with those calculated for a set of trial band gaps and find the ones that best reproduce the target (the procedure is detailed in the Supplemental Material [19]). We use the χ2 probability distribution to
reject candidate band structures that badly fit the exper-imental phase: a trial is rejected if the probability of measuring χ2
> χ2
trial is lower than the threshold p ¼ 0.1.
With a confidence level (1-p) of 90%, only four trial bands are plausible—their shape and the associated Φosc are
plotted as gray lines in Figs.2(b)–2(c). The retrieved band gaps are extremely accurate: at most they differ by 0.2 eVat M, a resolution comparable to time-resolved ARPES[4,6]
(static experiments have higher resolution [3]). The accu-racy is limited by the precision on Φoscand the number of
measured harmonic orders (their effect on the reconstruction is analyzed in the Supplemental Material
[19]), not by the spectral bandwidth of the laser pulse, a typical shortcoming of photoemission. In fact, shorter pulses (wider bandwidths) might even be beneficial to solid high harmonics because they can extend the harmonic cutoff (wider harmonic range), similarly to the atomic case
[21]. The reconstruction assumes a known minimum band gap. It can be accurately measured with linear optical methods. In the Supplemental Material[19]we show how the reconstruction is successful also for target and trial band gaps with different functional forms. The momentum resolution [δk in Fig. 2(c)] can be interpreted as the difference between the maximum and minimum momen-tum corresponding to a given energy for the set of reconstructed bands. It amounts to ∼1%–5% of the Brillouin zone, or to ∼0.02–0.12 Å−1.
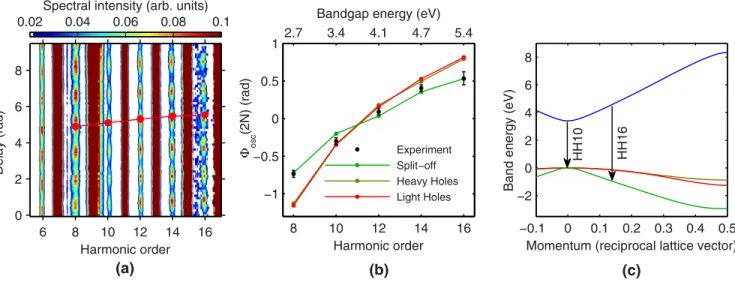
In the simulated reconstruction presented so far, we need radiation stretching up to the maximum band energy to obtain the full relative band structure. In ZnO this requires a spectrum that terminates at ∼10 eV. However, our spectro-graph does not allow measurement beyond ∼6 eV, or the 18th harmonic. Therefore, we measure electrons and holes that explore only ∼20% of the Brillouin Zone. In the Supplemental Material [19] (Fig. S3) we show that extrapolating the band structure to energies higher than the measured harmonic range heavily depends on the functional form of the trials and, in general, results in rapid loss of accuracy. With the limited experimental data presented in Fig.3(a), we can identify which of the possible valence bands contribute to tunneling. When multiple occupied states contribute to high harmonic generation in atoms, a hole wave packet is launched and evolves on attosecond time scales [22]. Do similar dynamics exist in ZnO? 6 8 10 12 14 16 0 2 4 6 8 Harmonic order Delay (rad) (a)
Spectral intensity (arb. units) 0.02 0.04 0.06 0.08 0.1 8 10 12 14 16 −1 −0.5 0 0.5 1 Harmonic order Φ osc (2N) (rad) (b) −0.1 0 0.1 0.2 0.3 0.4 0.5 −2 0 2 4 6 8
Momentum (reciprocal lattice vector)
Band energy (eV)
(c) HH10 HH16 Experiment Split−off Heavy Holes Light Holes 2.7 3.4 4.1 4.7 5.4
Bandgap energy (eV)
FIG. 3 (color online). Experimental contribution of the split-off band. (a) Experimental spectrogram obtained from a ZnO crystal. The same setup of Ref.[15]has been used to collect this data. Experimental parameters are the same as in Fig.2. Each harmonic order is independently normalized to facilitate comparison between orders. The odd harmonics saturate the spectrometer. The red line is the experimental Φosc. (b) The optimum phase extracted from the experiment (black dots with error bars), simulated for tunneling from the
split-off valence band (green line), the heavy holes band (gold line) and the light holes band (red line). Contrary to Fig.2, here we use an unmeasured offset phase to position the experimental data. This phase is, in principle, measurable in a more refined experiment. (c) Band structure for the same bands of part (b) with the same color coding. The blue band is the first conduction band. They are obtained from ab initio calculations. The arrows mark the recombination between electrons and holes in the split-off band for the 10th and 16th harmonic orders. The measured harmonic spectrum extends up to ∼25% of the Brillouin zone.
The experimental Φosc [black dots in Fig. 3(b)] agrees
with the simulation for tunneling from the split-off valence band to the first conduction band (green line); the other two curves associated with tunneling from the heavy holes (gold) and light holes (red) bands are significantly steeper. Therefore, hole dynamics don’t seem to be initiated in ZnO. Here, the selected bands of ZnO are obtained from ab inito calculation. Therefore, no reconstruction is performed.
Contrary to the situation of Fig. 2, here we use an unmeasured offset phase to position the experimental data. This phase is, in principle, measurable in more refined experiments, but is strictly not required to completely reconstruct the band structure (see discussion in the Supplemental Material[19]and Figs. S4–S6). The different slope of Φoscfor the different valence bands is, to first order,
related to the effective mass: in narrow bands, adjacent harmonic orders map onto very different momenta, and, in turn, to very different trajectories. Since the optimum phase is linked to the trajectory, Φosc varies more strongly with
harmonic order than in wider bands. The accuracy on Φosc
is 50 mrad and is mainly limited by intensity fluctuations on the high harmonic signal and delay jitter. The bands are plotted in Fig.3(c), with the same color coding (blue for the conduction band).
The dominant contribution of the split-off valence band to tunneling is expected: holes in this band have a lower effective mass than the heavy and light hole valence bands. Is it possible to reconstruct the heavier bands instead? It may be possible if the selected band is non degenerate with the split-off band (the separation is ∼0.1 eV at Γ). For example, the infrared field could resonantly populate an intragap impurity level that lays one or two photon energies above the top of the desired valence band. From there, electrons will tunnel to the conduction band. The presence of the resonance greatly enhances tunneling over the off-resonant transitions from the split-off band. If the desired band is well separated (>1 eV), one could also excite with a resonant ultraviolet pulse within a fraction of the infrared cycle[23].
Before concluding, we will address three important issues.
First, the electron and hole move in the bands dressed with the laser field. Does any laser field that is sufficiently intense to create the harmonics severely distort the bands we measure? As detailed in the Supplemental Material[19], the maximum calculated perturbation to the field-free states is only 2% of the band gap. Furthermore, the simulations naturally include the effect of the field so that any distortion to Φosc is already accounted for in the
reconstruction.
Second, real materials have multiple bands. Does the presence of multiple bands alter the optimum phase originating from a two-band recombination? In this regard, recent calculations are encouraging. Model results show
that two-band emission dominates over a reasonably extended intensity range[24,25]. This is possibly a result of the wide separation between bands. Coupling between multiple bands is expected to be negligible also for closely spaced bands of similar symmetry. When transition dipole moments become large, however, coupling of multiple bands can be significant[26].
Third, dynamical screening of the Coulomb interaction following strong-field excitation can lead to renormaliza-tion of the band gap[13], and, consequently, to an offset of the absolute phase. In the Supplemental Material[19]we show that for variations <0.2 eV, the offset is almost identical for all harmonic orders, and the reconstruction converges to the field-free band structure if the absolute phase is neglected. Conversely, the absolute phase can be used to map the dynamical screening.
In summary, we have demonstrated an all-optical method for measuring band structures based on high harmonic generation—a method complementary to ARPES. Specifically, we have shown that the phase of the oscillation of even harmonics is sensitive to the momentum-dependent band gap. The technique that we have introduced will be useful where it is not possible to detect photoelectrons, such as in the bulk of materials or in matter under extreme pressures [27,28] or high magnetic fields. In addition, it may be possible to extend the approach to studying the energetics of chemical reactions under ambient conditions (it does not require vacuum), such as catalysis [29], oxidation of metals[30], and solution chemistry[31,32].
Because of the brief life of the recolliding electron-hole pair, all-optical band structure measurement inherently has ultrafast temporal resolution[33], at no expense of energy resolution. It is now possible to probe the fastest mod-ifications to band structures, for example, band renormal-ization as population is transferred between the bands[13], the onset of screening[34], or of the effective mass[35]. The initial states of photoinduced transitions in strongly correlated materials can potentially be mapped, too[36,37]. The method can be extended to measure band structures in crystals that lack inversion symmetry, for which even harmonics are produced by the fundamental field alone. For example, a second harmonic beam noncollinear with the fundamental[38]can produce even harmonics that spatially separate from those produced by the fundamental.
Finally, as in photoelectron spectroscopy, it seems possible to obtain information about individual bands by forcing the electron or the hole to propagate in a known band. For example, a localized intragap impurity state for the hole or a free-electron band for an electron propagating in vacuum. The latter can be achieved by grazing incidence illumination with laser polarization orthogonal to the surface.
It is our pleasant duty to thank A. Laramée from the Advanced Laser Light Source for his technical assistance 193603-4
during the experiment. The authors also acknowledge valuable support from the US AFOSR and Canada’s NRC, NSERC, FRQNT, and CFI-MSI (Major Science Initiatives). *Corresponding author. gvamp015@uottawa.ca † Corresponding author. paul.corkum@nrc.ca.
[1] A. Einstein,Ann. Phys. (Berlin) 322, 132 (1905). [2] A. Damascelli, Z. Hussain, and Z. X. Shen,Rev. Mod. Phys.
75, 473 (2003).
[3] A. Lanzara et al.,Nature (London) 412, 510 (2001). [4] L. Perfetti, P. A. Loukakos, M. Lisowski, U. Bovensiepen,
H. Eisaki, and M. Wolf,Phys. Rev. Lett. 99, 197001 (2007). [5] A. Bostwick, T. Ohta, T. Seyller, K. Horn, and E. Rotenberg,
Nat. Phys. 3, 36 (2007).
[6] S. Ulstrup et al., Phys. Rev. Lett. 112, 257401 (2014). [7] S. Y. Zhou, G.-H. Gweon, A. V. Fedorov, P. N. First,
W. A. de Heer, D.-H. Lee, F. Guinea, A. H. Castro Neto, and A. Lanzara,Nat. Mater. 6, 770 (2007).
[8] Y. L. Chen et al.,Science 325, 178 (2009). [9] X. Xia et al.,Nat. Phys. 5, 398 (2009). [10] V. Dose,Surf. Sci. Rep. 5, 337 (1985).
[11] S. Ghimire, A. D. DiChiara, E. Sistrunk, P. Agostini, L. F. DiMauro, and D. A. Reis,Nat. Phys. 7, 138 (2011). [12] A. Schiffrin et al.,Nature (London) 493, 70 (2013). [13] M. Schultze et al., Science 346, 1348 (2014).
[14] G. Vampa, C. R. McDonald, G. Orlando, D. D. Klug, P. B. Corkum, and T. Brabec, Phys. Rev. Lett. 113, 073901 (2014).
[15] G. Vampa, T. J. Hammond, N. Thiré, B. E. Schmidt, F. Légaré, C. R. McDonald, T. Brabec, and P. B. Corkum,
Nature (London) 522, 462 (2015).
[16] O. Schubert et al.,Nat. Photonics 8, 119 (2014).
[17] T. T. Luu, M. Garg, S. Yu. Kruchinin, A. Moulet, M. Th. Hassan, and E. Goulielmakis, Nature (London) 521, 498 (2015).
[18] N. Dudovich, O. Smirnova, J. Levesque, Y. Mairesse, M. Yu. Ivanov, D. M. Villeneuve, and P. B. Corkum, Nat. Phys. 2, 781 (2006).
[19] See Supplemental Materialhttp://link.aps.org/supplemental/ 10.1103/PhysRevLett.115.193603for a detailed analysis of the reconstruction procedure, which includes Ref. [20]. [20] M. Lewenstein, P. Balcou, M. Y. Ivanov, A. L’Huillier, and
P. B. Corkum,Phys. Rev. A 49, 2117 (1994). [21] B. E. Schmidt et al.,J. Phys. B 45, 074008 (2012). [22] E. Goulielmakis et al.,Nature (London) 466, 739 (2010). [23] J. Leeuwenburgh, B. Cooper, V. Averbukh, J. P. Marangos,
and M. Ivanov,Phys. Rev. Lett. 111, 123002 (2013). [24] M. Wu, S. Ghimire, D. A. Reis, K. J. Schafer, and M. B.
Gaarde,Phys. Rev. A 91, 043839 (2015).
[25] C. R. McDonald, G. Vampa, P. B. Corkum, and T. Brabec,
Phys. Rev. A 92, 033845 (2015)
[26] M. Hohenleutner, F. Langer, O. Schubert, M. Knorr, U. Huttner, S. W. Koch, M. Kira, and R. Huber, Nature (London) 523, 572 (2015).
[27] M. I. Eremets and I. A. Troyan,Nat. Mater. 10, 927 (2011). [28] J. Lv, Y. Wang, L. Zhu, and Y. Ma,Phys. Rev. Lett. 106,
015503 (2011).
[29] F. Tao, M. E. Grass, Y. Zhang, D. R. Butcher, J. R. Renzas, Z. Liu, J. Y. Chung, B. S. Mun, M. Salmeron, and G. A. Somorjai,Science 322, 932 (2008).
[30] G. Ketteler, D. Frank Ogletree, H. Bluhm, H. Liu, E. L. D. Hebenstreit, and M. Salmeron, J. Am. Chem. Soc. 127, 18269 (2005).
[31] H. Bluhm,J. Electron Spectrosc. Relat. Phenom. 177, 71 (2010).
[32] J. Ghosal et al.,Science 307, 563 (2005). [33] S. Baker et al.,Science 312, 424 (2006).
[34] R. Huber, F. Tauser, A. Brodschelm, M. Bichler, G. Abstreiter, and A. Leitenstorfer, Nature (London) 414, 286 (2001).
[35] R. Chang, S. Potnis, R. Ramos, C. Zhuang, M. Hallaji, A. Hayat, F. Duque-Gomez, J. E. Sipe, and A. M. Steinberg,
Phys. Rev. Lett. 112, 170404 (2014).
[36] L. Perfetti, P. A. Loukakos, M. Lisowski, U. Bovensiepen, H. Berger, S. Biermann, P. S. Cornaglia, A. Georges, and M. Wolf,Phys. Rev. Lett. 97, 067402 (2006).
[37] M. Rini, A. Cavalleri, R. W. Schoenlein, R. López, L. C. Feldman, R. F. Haglund, L. A. Boatner, and T. E. Haynes,Opt. Lett. 30, 558 (2005).
[38] K. T. Kim, C. Zhang, A. D. Shiner, S. E. Kirkwood, E. Frumker, G. Gariepy, A. Naumov, D. M. Villeneuve, and P. B. Corkum,Nat. Phys. 9, 159 (2014).