published as:
ϕ meson production in d+Au collisions at
sqrt[s_{NN}]=200GeV
A. Adare et al. (PHENIX Collaboration)
Phys. Rev. C 92, 044909 — Published 19 October 2015
DOI: 10.1103/PhysRevC.92.044909
A. Adare,13 C. Aidala,42, 43 N.N. Ajitanand,62 Y. Akiba,56, 57 H. Al-Bataineh,50J. Alexander,62 M. Alfred,23 2
A. Angerami,14 K. Aoki,31, 34, 56 N. Apadula,28, 63 Y. Aramaki,12, 56 H. Asano,34, 56E.T. Atomssa,35R. Averbeck,63 3
T.C. Awes,52B. Azmoun,7 V. Babintsev,24 M. Bai,6 G. Baksay,19 L. Baksay,19N.S. Bandara,42 B. Bannier,63 4
K.N. Barish,8 B. Bassalleck,49 A.T. Basye,1 S. Bathe,5, 8, 57 V. Baublis,55 C. Baumann,7, 44 A. Bazilevsky,7 5
M. Beaumier,8 S. Beckman,13 S. Belikov,7, ∗ R. Belmont,43, 67 R. Bennett,63 A. Berdnikov,59 Y. Berdnikov,59 6
J.H. Bhom,71 D.S. Blau,33 J.S. Bok,50, 71 K. Boyle,57, 63 M.L. Brooks,38 J. Bryslawskyj,5H. Buesching,7 7
V. Bumazhnov,24 G. Bunce,7, 57 S. Butsyk,38 S. Campbell,14, 28, 63 A. Caringi,45 C.-H. Chen,57, 63 C.Y. Chi,14 8
M. Chiu,7 I.J. Choi,25, 71 J.B. Choi,10 R.K. Choudhury,4P. Christiansen,40 T. Chujo,66 P. Chung,62 O. Chvala,8 9
V. Cianciolo,52Z. Citron,63, 69 B.A. Cole,14 Z. Conesa del Valle,35 M. Connors,63M. Csan´ad,17 T. Cs¨org˝o,70 10
T. Dahms,63S. Dairaku,34, 56 I. Danchev,67D. Danley,51 K. Das,20 A. Datta,42, 49 M.S. Daugherity,1G. David,7 11
M.K. Dayananda,21 K. DeBlasio,49 K. Dehmelt,63 A. Denisov,24 A. Deshpande,57, 63 E.J. Desmond,7 12
K.V. Dharmawardane,50O. Dietzsch,60 A. Dion,28, 63 P.B. Diss,41 J.H. Do,71 M. Donadelli,60 L. D’Orazio,41 13
O. Drapier,35A. Drees,63K.A. Drees,6J.M. Durham,38, 63 A. Durum,24D. Dutta,4 S. Edwards,20Y.V. Efremenko,52 14
F. Ellinghaus,13 T. Engelmore,14A. Enokizono,52, 56, 58 H. En’yo,56, 57 S. Esumi,66 B. Fadem,45 N. Feege,63 15
D.E. Fields,49 M. Finger,9 M. Finger, Jr.,9 F. Fleuret,35 S.L. Fokin,33Z. Fraenkel,69, ∗ J.E. Frantz,51, 63 A. Franz,7 16
A.D. Frawley,20 K. Fujiwara,56 Y. Fukao,56 T. Fusayasu,47C. Gal,63 P. Gallus,15 P. Garg,3 I. Garishvili,37, 64 17
H. Ge,63F. Giordano,25 A. Glenn,37 H. Gong,63 M. Gonin,35Y. Goto,56, 57R. Granier de Cassagnac,35N. Grau,2, 14 18
S.V. Greene,67G. Grim,38M. Grosse Perdekamp,25 T. Gunji,12 H.-˚A. Gustafsson,40, ∗T. Hachiya,56 J.S. Haggerty,7 19
K.I. Hahn,18 H. Hamagaki,12 J. Hamblen,64 H.F. Hamilton,1 R. Han,54 S.Y. Han,18 J. Hanks,14, 63 20
S. Hasegawa,29T.O.S. Haseler,21 K. Hashimoto,56, 58 E. Haslum,40 R. Hayano,12 X. He,21 M. Heffner,37 21
T.K. Hemmick,63 T. Hester,8 J.C. Hill,28M. Hohlmann,19 R.S. Hollis,8W. Holzmann,14 K. Homma,22 B. Hong,32 22
T. Horaguchi,22 D. Hornback,64T. Hoshino,22 N. Hotvedt,28 J. Huang,7 S. Huang,67 T. Ichihara,56, 57 23
R. Ichimiya,56 Y. Ikeda,66K. Imai,29, 34, 56 M. Inaba,66 A. Iordanova,8 D. Isenhower,1 M. Ishihara,56 M. Issah,67 24
D. Ivanishchev,55 Y. Iwanaga,22B.V. Jacak,63 M. Jezghani,21J. Jia,7, 62 X. Jiang,38 J. Jin,14 B.M. Johnson,7 25
T. Jones,1 K.S. Joo,46 D. Jouan,53 D.S. Jumper,1, 25 F. Kajihara,12J. Kamin,63 S. Kanda,12 J.H. Kang,71 26
J. Kapustinsky,38 K. Karatsu,34, 56 M. Kasai,56, 58 D. Kawall,42, 57M. Kawashima,56, 58 A.V. Kazantsev,33 27
T. Kempel,28 J.A. Key,49 V. Khachatryan,63A. Khanzadeev,55 K.M. Kijima,22 J. Kikuchi,68 A. Kim,18B.I. Kim,32 28
C. Kim,32D.J. Kim,30 E.-J. Kim,10G.W. Kim,18 M. Kim,61 Y.-J. Kim,25 B. Kimelman,45 E. Kinney,13 A. Kiss,´ 17 29
E. Kistenev,7 R. Kitamura,12 J. Klatsky,20D. Kleinjan,8 P. Kline,63 T. Koblesky,13 L. Kochenda,55 B. Komkov,55 30
M. Konno,66J. Koster,25D. Kotov,55, 59 A. Kr´al,15 A. Kravitz,14G.J. Kunde,38 K. Kurita,56, 58 M. Kurosawa,56, 57 31
Y. Kwon,71 G.S. Kyle,50R. Lacey,62Y.S. Lai,14J.G. Lajoie,28A. Lebedev,28 D.M. Lee,38 J. Lee,18 K.B. Lee,32 32
K.S. Lee,32 S Lee,71 S.H. Lee,63 M.J. Leitch,38 M.A.L. Leite,60 X. Li,11 P. Lichtenwalner,45 P. Liebing,57 33
S.H. Lim,71 L.A. Linden Levy,13 T. Liˇska,15H. Liu,38 M.X. Liu,38 B. Love,67 D. Lynch,7 C.F. Maguire,67 34
Y.I. Makdisi,6 M. Makek,72 M.D. Malik,49 A. Manion,63V.I. Manko,33 E. Mannel,7, 14 Y. Mao,54, 56 H. Masui,66 35
F. Matathias,14 M. McCumber,38, 63 P.L. McGaughey,38 D. McGlinchey,13, 20 C. McKinney,25 N. Means,63 36
A. Meles,50 M. Mendoza,8 B. Meredith,25 Y. Miake,66 T. Mibe,31 A.C. Mignerey,41 K. Miki,56, 66 A. Milov,7, 69 37
D.K. Mishra,4 J.T. Mitchell,7 S. Miyasaka,56, 65 S. Mizuno,56, 66 A.K. Mohanty,4P. Montuenga,25 H.J. Moon,46 38
T. Moon,71 Y. Morino,12A. Morreale,8D.P. Morrison,7, † T.V. Moukhanova,33T. Murakami,34, 56 J. Murata,56, 58 39
A. Mwai,62 S. Nagamiya,31, 56 K. Nagashima,22 J.L. Nagle,13, ‡ M. Naglis,69 M.I. Nagy,17, 70 I. Nakagawa,56, 57 40
H. Nakagomi,56, 66 Y. Nakamiya,22 K.R. Nakamura,34, 56T. Nakamura,56K. Nakano,56, 65 S. Nam,18 C. Nattrass,64 41
P.K. Netrakanti,4 J. Newby,37 M. Nguyen,63 M. Nihashi,22 T. Niida,66 S. Nishimura,12 R. Nouicer,7, 57 T. Novak,70 42
N. Novitzky,30, 63 A.S. Nyanin,33 C. Oakley,21E. O’Brien,7 S.X. Oda,12C.A. Ogilvie,28 M. Oka,66 K. Okada,57 43
Y. Onuki,56 J.D. Orjuela Koop,13 J.D. Osborn,43 A. Oskarsson,40M. Ouchida,22, 56 K. Ozawa,12, 31 R. Pak,7 44
V. Pantuev,26, 63 V. Papavassiliou,50 I.H. Park,18 J.S. Park,61S. Park,61 S.K. Park,32W.J. Park,32S.F. Pate,50 45
M. Patel,28 H. Pei,28 J.-C. Peng,25H. Pereira,16D.V. Perepelitsa,7G.D.N. Perera,50 D.Yu. Peressounko,33 46
J. Perry,28 R. Petti,7, 63 C. Pinkenburg,7 R. Pinson,1 R.P. Pisani,7 M. Proissl,63 M.L. Purschke,7H. Qu,21 47
J. Rak,30 B.J. Ramson,43 I. Ravinovich,69 K.F. Read,52, 64 S. Rembeczki,19 K. Reygers,44 D. Reynolds,62 48
V. Riabov,48, 55 Y. Riabov,55, 59 E. Richardson,41T. Rinn,28 D. Roach,67G. Roche,39, ∗S.D. Rolnick,8M. Rosati,28 49
C.A. Rosen,13 S.S.E. Rosendahl,40 Z. Rowan,5 J.G. Rubin,43 P. Ruˇziˇcka,27 B. Sahlmueller,44, 63 N. Saito,31 50
T. Sakaguchi,7 K. Sakashita,56, 65 H. Sako,29 V. Samsonov,48, 55S. Sano,12, 68M. Sarsour,21S. Sato,29, 31 T. Sato,66 51
S. Sawada,31B. Schaefer,67 B.K. Schmoll,64 K. Sedgwick,8 J. Seele,13 R. Seidl,25, 56, 57 A. Sen,64 R. Seto,8 52
P. Sett,4 A. Sexton,41 D. Sharma,63, 69 I. Shein,24 T.-A. Shibata,56, 65 K. Shigaki,22 M. Shimomura,28, 66 53
K. Shoji,34, 56 P. Shukla,4 A. Sickles,7, 25 C.L. Silva,28, 38 D. Silvermyr,40, 52C. Silvestre,16 K.S. Sim,32 B.K. Singh,3 54
C.P. Singh,3 V. Singh,3 M. Sluneˇcka,9 M. Snowball,38 R.A. Soltz,37 W.E. Sondheim,38 S.P. Sorensen,64 55
I.V. Sourikova,7 P.W. Stankus,52E. Stenlund,40 M. Stepanov,42, 50, ∗ S.P. Stoll,7 T. Sugitate,22 A. Sukhanov,7 56
T. Sumita,56 J. Sun,63 J. Sziklai,70 E.M. Takagui,60 A. Taketani,56, 57 R. Tanabe,66 Y. Tanaka,47 S. Taneja,63 57
K. Tanida,34, 56, 57, 61M.J. Tannenbaum,7 S. Tarafdar,3, 69 A. Taranenko,48, 62 H. Themann,63 D. Thomas,1 58
T.L. Thomas,49 R. Tieulent,21 A. Timilsina,28 T. Todoroki,56, 66 M. Togawa,57A. Toia,63 L. Tom´aˇsek,27 59
M. Tom´aˇsek,15, 27 H. Torii,22 C.L. Towell,1R. Towell,1 R.S. Towell,1I. Tserruya,69Y. Tsuchimoto,22 C. Vale,7 60
H. Valle,67 H.W. van Hecke,38E. Vazquez-Zambrano,14A. Veicht,14, 25 J. Velkovska,67R. V´ertesi,70M. Virius,15 61
V. Vrba,15, 27 E. Vznuzdaev,55 X.R. Wang,50, 57 D. Watanabe,22 K. Watanabe,66 Y. Watanabe,56, 57 62
Y.S. Watanabe,12, 31 F. Wei,28, 50 R. Wei,62 J. Wessels,44 A.S. White,43 S.N. White,7 D. Winter,14 63
C.L. Woody,7 R.M. Wright,1 M. Wysocki,13, 52 B. Xia,51 L. Xue,21 S. Yalcin,63 Y.L. Yamaguchi,12, 56, 63 64
K. Yamaura,22 R. Yang,25 A. Yanovich,24 J. Ying,21 S. Yokkaichi,56, 57 J.H. Yoo,32 I. Yoon,61 Z. You,54 65
G.R. Young,52 I. Younus,36, 49 H. Yu,54 I.E. Yushmanov,33W.A. Zajc,14 A. Zelenski,6 S. Zhou,11and L. Zou8 66
(PHENIX Collaboration) 67
1Abilene Christian University, Abilene, Texas 79699, USA
68
2Department of Physics, Augustana College, Sioux Falls, South Dakota 57197, USA
69
3Department of Physics, Banaras Hindu University, Varanasi 221005, India
70
4Bhabha Atomic Research Centre, Bombay 400 085, India
71
5Baruch College, City University of New York, New York, New York, 10010 USA
72
6Collider-Accelerator Department, Brookhaven National Laboratory, Upton, New York 11973%–5000, USA
73
7Physics Department, Brookhaven National Laboratory, Upton, New York 11973%–5000, USA
74
8University of California-Riverside, Riverside, California 92521, USA
75
9Charles University, Ovocn´y trh 5, Praha 1, 116 36, Prague, Czech Republic
76
10Chonbuk National University, Jeonju, 561%–756, Korea
77
11Science and Technology on Nuclear Data Laboratory, China Institute of Atomic Energy, Beijing 102413, P. R. China
78
12Center for Nuclear Study, Graduate School of Science, University
79
of Tokyo, 7%–3%–1 Hongo, Bunkyo, Tokyo 113%–0033, Japan
80
13University of Colorado, Boulder, Colorado 80309, USA
81
14Columbia University, New York, New York 10027 and Nevis Laboratories, Irvington, New York 10533, USA
82
15Czech Technical University, Zikova 4, 166 36 Prague 6, Czech Republic
83
16Dapnia, CEA Saclay, F-91191, Gif-sur-Yvette, France
84
17ELTE, E¨otv¨os Lor´and University, H-1117 Budapest, P´azm´any P. s. 1/A, Hungary
85
18Ewha Womans University, Seoul 120-750, Korea
86
19Florida Institute of Technology, Melbourne, Florida 32901, USA
87
20Florida State University, Tallahassee, Florida 32306, USA
88
21Georgia State University, Atlanta, Georgia 30303, USA
89
22Hiroshima University, Kagamiyama, Higashi-Hiroshima 739%–8526, Japan
90
23Department of Physics and Astronomy, Howard University, Washington, DC 20059, USA
91
24IHEP Protvino, State Research Center of Russian Federation, Institute for High Energy Physics, Protvino, 142281, Russia
92
25University of Illinois at Urbana-Champaign, Urbana, Illinois 61801, USA
93
26Institute for Nuclear Research of the Russian Academy of Sciences, prospekt 60%–letiya Oktyabrya 7a, Moscow 117312, Russia
94
27Institute of Physics, Academy of Sciences of the Czech Republic, Na Slovance 2, 182 21 Prague 8, Czech Republic
95
28Iowa State University, Ames, Iowa 50011, USA
96
29Advanced Science Research Center, Japan Atomic Energy Agency, 2%–4
97
Shirakata Shirane, Tokai-mura, Naka-gun, Ibaraki-ken 319%–1195, Japan
98
30Helsinki Institute of Physics and University of Jyv¨askyl¨a, P.O.Box 35, FI-40014 Jyv¨askyl¨a, Finland
99
31KEK, High Energy Accelerator Research Organization, Tsukuba, Ibaraki 305%–0801, Japan
100
32Korea University, Seoul, 136%–701, Korea
101
33Russian Research Center “Kurchatov Institute”, Moscow, 123098 Russia
102
34Kyoto University, Kyoto 606%–8502, Japan
103
35Laboratoire Leprince-Ringuet, Ecole Polytechnique, CNRS-IN2P3, Route de Saclay, F-91128, Palaiseau, France
104
36Physics Department, Lahore University of Management Sciences, Lahore 54792, Pakistan
105
37Lawrence Livermore National Laboratory, Livermore, California 94550, USA
106
38Los Alamos National Laboratory, Los Alamos, New Mexico 87545, USA
107
39LPC, Universit´e Blaise Pascal, CNRS-IN2P3, Clermont-Fd, 63177 Aubiere Cedex, France
108
40Department of Physics, Lund University, Box 118, SE-221 00 Lund, Sweden
109
41University of Maryland, College Park, Maryland 20742, USA
110
42Department of Physics, University of Massachusetts, Amherst, Massachusetts 01003%–9337, USA
111
43Department of Physics, University of Michigan, Ann Arbor, Michigan 48109%–1040, USA
44Institut f¨ur Kernphysik, University of Muenster, D-48149 Muenster, Germany
113
45Muhlenberg College, Allentown, Pennsylvania 18104%–5586, USA
114
46Myongji University, Yongin, Kyonggido 449%–728, Korea
115
47Nagasaki Institute of Applied Science, Nagasaki-shi, Nagasaki 851%–0193, Japan
116
48National Research Nuclear University, MEPhI, Moscow Engineering Physics Institute, Moscow, 115409, Russia
117
49University of New Mexico, Albuquerque, New Mexico 87131, USA
118
50New Mexico State University, Las Cruces, New Mexico 88003, USA
119
51Department of Physics and Astronomy, Ohio University, Athens, Ohio 45701, USA
120
52Oak Ridge National Laboratory, Oak Ridge, Tennessee 37831, USA
121
53IPN-Orsay, Universite Paris Sud, CNRS-IN2P3, BP1, F-91406, Orsay, France
122
54Peking University, Beijing 100871, P. R. China
123
55PNPI, Petersburg Nuclear Physics Institute, Gatchina, Leningrad region, 188300, Russia
124
56RIKEN Nishina Center for Accelerator-Based Science, Wako, Saitama 351%–0198, Japan
125
57RIKEN BNL Research Center, Brookhaven National Laboratory, Upton, New York 11973%–5000, USA
126
58Physics Department, Rikkyo University, 3%–34%–1 Nishi-Ikebukuro, Toshima, Tokyo 171%–8501, Japan
127
59Saint Petersburg State Polytechnic University, St. Petersburg, 195251 Russia
128
60Universidade de S˜ao Paulo, Instituto de F´ısica, Caixa Postal 66318, S˜ao Paulo CEP05315%–970, Brazil
129
61Department of Physics and Astronomy, Seoul National University, Seoul 151%–742, Korea
130
62Chemistry Department, Stony Brook University, SUNY, Stony Brook, New York 11794%–3400, USA
131
63Department of Physics and Astronomy, Stony Brook University, SUNY, Stony Brook, New York 11794%–3800, USA
132
64University of Tennessee, Knoxville, Tennessee 37996, USA
133
65Department of Physics, Tokyo Institute of Technology, Oh-okayama, Meguro, Tokyo 152%–8551, Japan
134
66Institute of Physics, University of Tsukuba, Tsukuba, Ibaraki 305, Japan
135
67Vanderbilt University, Nashville, Tennessee 37235, USA
136
68Waseda University, Advanced Research Institute for Science and
137
Engineering, 17 Kikui-cho, Shinjuku-ku, Tokyo 162%–0044, Japan
138
69Weizmann Institute, Rehovot 76100, Israel
139
70Institute for Particle and Nuclear Physics, Wigner Research Centre for Physics, Hungarian
140
Academy of Sciences (Wigner RCP, RMKI) H-1525 Budapest 114, POBox 49, Budapest, Hungary
141
71Yonsei University, IPAP, Seoul 120-749, Korea
142
72University of Zagreb, Faculty of Science, Department of Physics, Bijeniˇcka 32, HR-10002 Zagreb, Croatia
143
The PHENIX collaboration has measured φ meson production in d+Au collisions at √sN N = 200 GeV using the dimuon and dielectron decay channels. The φ meson is measured in the forward (backward) d-going (Au-going) direction, 1.2 < y < 2.2 (−2.2 < y < −1.2) in the transverse-momentum (pT) range from 1–7 GeV/c, and at midrapidity |y| < 0.35 in the pT range below
7 GeV/c. The φ meson invariant yields and nuclear-modification factors as a function of pT, rapidity,
and centrality are reported. An enhancement of φ meson production is observed in the Au-going direction, while suppression is seen in the d-going direction, and no modification is observed at midrapidity relative to the yield in p+p collisions scaled by the number of binary collisions. Similar behavior was previously observed for inclusive charged hadrons and open heavy flavor indicating similar cold-nuclear-matter effects.
PACS numbers: 25.75.Dw
144
∗Deceased
†PHENIX Co-Spokesperson: morrison@bnl.gov ‡PHENIX Co-Spokesperson: jamie.nagle@colorado.edu
I. INTRODUCTION
145
Collisions of deuterons with gold nuclei (d+Au) are of significant interest in the study of the strongly coupled 146
Quark Gluon Plasma (QGP) produced at the Relativistic Heavy Ion Collider (RHIC) [1, 2]. The highly asymmetric 147
collisions of a small projectile and a large target nucleus provide a way to investigate the initial state of a nucleus-148
nucleus collision experimentally, potentially disentangling effects due to QGP formation from the cold-nuclear-matter 149
effects. The latter include modification of the parton distribution functions (PDFs) in the nucleus relative to those 150
in the nucleon [3], initial-state energy loss [4], and the so-called Cronin effect. The Cronin effect refers to the 151
enhancement of high-pT particle production in p+A collisions relative to that in p+p collisions scaled by the number 152
of binary collisions and is often attributed to multiple scattering of the incoming parton inside the target nucleus [5–8]. 153
In addition, results from recent p(d)+A collisions at the Large Hadron Collider and RHIC suggest that long-range 154
correlations, either present in the initial state or induced by the evolution of the medium, play an important role even 155
in these small collision systems [7–20]. Detailed studies of particle production systematics in d+Au at RHIC may 156
inform this question [21–26]. 157
PHENIX has measured the production of identified particles, such as π, K and p, at midrapidity in d+Au and 158
Au+Au collisions and has found intriguing similarities between the K/π and p/π ratios in peripheral Au+Au and 159
central d+Au collisions [24]. However, it was observed that the ratio of spectra in peripheral Au+Au to those in 160
central d+Au starts above one at low-pT and trends to a constant value of ∼ 0.65 for all identified particles at high pT. 161
One explanation for the low-pT rise is a relative deficit of midrapidity soft particle yield in d+Au collisions compared 162
to Au+Au, which could be due to the participant asymmetry in the d+Au collisions producing a rapidity shift in the 163
peak of particle production [9]. Consequently, measuring identified particles in different regions of rapidity provides 164
a more complete picture of d+Au collisions and sheds light on the relationship between p+p, d+Au and Au+Au. 165
Measuring identified particle production at forward rapidity also enables access to the low-x region where nuclear 166
PDFs (nPDFs) are not well known and where one expects parton-saturation effects to begin to manifest in modified 167
particle production. 168
The yield of φ mesons in high energy heavy ion collisions provides key information about the QGP, as the yield 169
is potentially sensitive to medium-induced effects such as strangeness enhancement [27], a phenomenon associated 170
with soft particles in bulk matter which can be accessed through the measurements of φ meson production [28–37]. 171
PHENIX measures φ meson production over a wide rapidity range and for various collision systems such as p+p, 172
d+Au and Au+Au. The production of φ mesons has already been measured in p+p, d+Au, Cu+Cu and Au+Au at 173
midrapidity [30, 36, 38] and in p+p at forward and backward rapidities [39] over a wide range in pT. 174
In this paper, the production of φ mesons is determined at forward and backward rapidities via dimuons detected 175
in the PHENIX muon spectrometers and at midrapidity via dielectrons detected in the PHENIX central arms. Mea-176
surements of the φ meson nuclear-modification factor (RdAu) in d+Au collisions versus rapidity and versus pT are 177
presented. The results presented here are based on d+Au collisions at √sN N = 200 GeV recorded in 2008. The 178
luminosity used in φ → µ+µ− analysis corresponds to 60 nb−1 which is equivalent to a nucleon-nucleon integrated 179
luminosity of 24 pb−1, while the luminosity used in φ → e+e− analysis corresponds to 71 nb−1 which is equivalent to 180
a nucleon-nucleon integrated luminosity of 28 pb−1. 181
II. EXPERIMENT
182
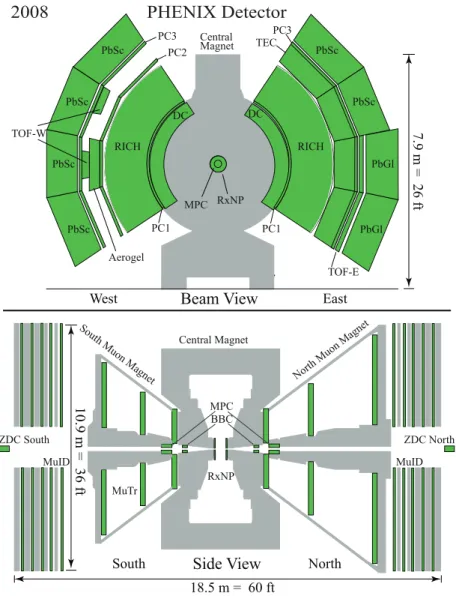
Figure 1 shows a schematic of the PHENIX detector, which is described in detail in Ref. [40]. The detectors relevant 183
for the analysis of the φ meson in the dilepton channels are the central arms, two muon spectrometers and the two 184
beam-beam counters. 185
The PHENIX central arms measure particles by using drift chambers (DC) and pad chambers for the tracking 186
and momentum measurement of charged particles, ring imaging ˇCerenkov detectors (RICH) for the separation of 187
electrons up to the π meson ˇCerenkov radiation threshold at 5 GeV/c, and an electromagnetic calorimeter (EMCal) 188
for the measurement of spatial positions and energies of photons and electrons. The EMCal comprises six sectors of 189
lead-scintillator calorimeter and two sectors of lead-glass calorimeter. 190
The muon spectrometers, located at forward and backward rapidity, are shielded by absorbers composed of 19 cm 191
of copper and 60 cm of iron. Each spectrometer comprises the muon tracker (MuTr) immersed in a radial magnetic 192
field of integrated bending power of 0.8 T·m, and backed by the muon identifier (MuID). The muon spectrometers 193
subtend 1.2 < |η| < 2.2 and the full azimuth. The MuTr comprises three sets of cathode strip chambers while the 194
MuID comprises five planes of Iarocci tubes interleaved with steel absorber plates. The momentum resolution, δp/p, 195
of particles in the analyzed momentum range is about 5%, independent of momentum and dominated by multiple 196
scattering. Muon candidates are identified by matching tracks reconstructed in the MuTr to MuID tracks that 197
West
South
Side View
Beam View
PHENIX Detector
2008
North East MuTr MuID MuID RxNP MPC RxNP PbSc PbSc PbSc PbSc PbSc PbGl PbSc PbGl TOF-E PC1 PC1 PC3 PC2 Central Magnet Central Magnet Nort h M uon M agne t Sout h M uon M agne t TEC PC3 BBC MPC BB RICH RICH DC DC ZDC North ZDC South Aerogel TOF-W 7.9 m = 26 ft 10.9 m = 36 ft 18.5 m = 60 ftFIG. 1. (color online) A schematic side view of the PHENIX detector configuration in the 2008 data-taking period.
penetrate through to the last MuID plane. The minimum momentum of a muon to reach the last MuID plane is 198
∼2 GeV/c. 199
Beam-beam counters (BBC), comprising two arrays of 64 ˇCerenkov counters covering the pseudorapidity range 200
3.1 < |η| < 3.9, measure the collision vertex along the beam axis (zvtx) with 0.5 cm resolution in addition to providing 201
a minimum-bias (MB) trigger. 202
III. DATA ANALYSIS
203
This section describes the details of the measurement of the φ meson in φ → µ+µ− and φ → e+e−decay channels. 204
A. φ → µ+µ−
measurement
205
The dimuon data set for this analysis was collected in 2008 using a MB trigger that requires at least one hit in each 206
of the BBC detectors in conjunction with the MuID Level-1 dimuon trigger. Also, at least two tracks were required 207
to penetrate to the last layer of the MuID. The MB trigger measures 88 ± 4% of the total d+Au inelastic cross section 208
of 2260 mb [21]. 209
A set of cuts was employed to select good muon candidates and improve the signal to background ratio. Event 210
selection requires the BBC collision z vertex to be reconstructed within ±30 cm of the center of the interaction region 211
along the beam axis. The MuTr tracks are matched to the MuID tracks at the first MuID layer in both position and 212
angle. The track is required to have at least 8 of 10 possible hits in the MuID. 213
The invariant mass distribution is formed by combining muon candidate tracks of opposite charge. In addition to 214
low mass vector mesons, the invariant mass spectra in the region of interest contain uncorrelated and correlated back-215
grounds. The uncorrelated backgrounds arise from random combinatoric associations of unrelated muon candidates 216
while the correlated backgrounds arise from open charm decay (e.g., D ¯D where both mesons decay semileptonically 217
to muons), open bottom decay, η and ω Dalitz decays and from the Drell-Yan process. The correlated background 218
is much smaller than the uncorrelated background for all centralities. It is also established from simulation that the 219
background is dominated by the uncorrelated contribution from decays, such as K, π → µν, that occur in front of 220
and inside the absorber. A smaller contribution to the background comes from hadron decays in the muon tracker 221
volume. When combined into track pairs, these pairs produce a broad distribution of invariant masses and also a 222
broad distribution of χ2
vtx, the parameter resulting from fitting the two muon tracks with the BBC measured event 223
vertex position. This procedure separates the foreground and background spectra by applying a cut of χ2
vtx < 4.0 224
to extract foreground spectra and a cut of χ2
vtx > 4.0 to extract background spectra. The cut value, χ2vtx,cut= 4.0, 225
is selected such that it retains as much of the signal as possible within the foreground, while still allowing sufficient 226
statistics in the background sample. This procedure is described in detail in Ref. [39]. 227
To extract the φ meson signal, the background pairs are subtracted from the foreground pairs. Because the pairs 228
with χ2
vtx > 4.0 represent only the uncorrelated part of the background the shape of their mass distribution is 229
slightly altered to account for the contribution of correlated pairs, which have much smaller contribution according 230
to simulation results. This is done by fitting a fourth order polynomial to the ratio of the foreground to background 231
distributions in the nonresonance region (0.3 < Mµ+µ− < 0.5 GeV/c
2 and 1.5 < M
µ+µ− < 2.5 GeV/c
2). The 232
background distribution is then multiplied by the polynomial in the entire mass range. Figure 2 shows the resulting 233
foreground and renormalized background distributions. 234
)
2(GeV/c
-µ + µM
0 0.5 1 1.5 2 2.5 3 3.5 4 4.5)
2dN/dM (pairs per 40 MeV/c
0 500 1000 1500 2000 2500 3000 3500 Foreground Background < 7 GeV/c T 1 < p 1.2 < y < 2.2
+Au at 200 GeV, 0-88% centrality d
FIG. 2. (color online) The unlike-sign dimuon invariant mass spectrum (solid red points) and the renormalized background spectrum (open blue circles).
In the mass range 0.3 < Mµ+µ− < 2.5 GeV/c
2, the resulting distribution after subtraction has contributions from 235
three mesons: ω, ρ, and φ mesons. The distribution is fitted with the sum of two Gaussian functions and the Breit-236
Wigner function convoluted with a Gaussian. The Gaussian functions are used to fit the ω and φ mesons while the 237
Breit-Wigner convoluted with a Gaussian is used to fit the ρ meson. Figure 3 shows the results. 238
The parameters of the fit are fixed to the world average values of the masses and widths of the three mesons [41] 239
and the widths of the Gaussian distributions, which account for the detector mass resolution, are constrained by the 240
values obtained from the simulation. The φ meson mass resolution is ∼85 MeV/c2. Because the invariant mass peak 241
of the φ meson is partly resolved in the plot, while ω and ρ meson peaks cannot be resolved, only an estimate of the 242
combined yield of these two mesons is allowed. In the fit, the ratio of the ω and ρ mesons, Nρ/Nω, is set to 0.58, 243
derived as the ratio of their corresponding production cross sections, σρ/σω = 1.15 ± 0.15, consistent with values 244
found in jet fragmentation [42], multiplied by the ratio of their branching ratios [41]. 245
)
2(GeV/c
-µ + µM
0 0.5 1 1.5 2 2.5)
2dN/dM (pairs per 40 MeV/c
-200 0 200 400 600 800 1000 1200 1400
Muon pairs
Total fit
-µ
+µ
→
ω
+
ρ
-µ
+µ
→
φ
poly-1
+Au at 200 GeV, 0-88% centrality
d
< 7 GeV/c
T
1 < p 1.2 < y < 2.2
FIG. 3. (color online) The fitted unlike-sign dimuon spectra after background subtraction.
The yield extraction is performed in bins of pT over the range 1 < pT < 7 GeV/c for the rapidities 1.2 < |y| < 2.2, 246
in bins of y for the pT range 1 < pT < 7 GeV/c, and in different centrality classes. 247
The acceptance and reconstruction efficiency (Aεrec) of the muon spectrometers, including the MuID trigger effi-248
ciency, is determined by passing pythia 6.421 (default parameters) [43] generated φ mesons through a full geant [44] 249
simulation of the PHENIX detector. The pythia simulation output is embedded into real d+Au data events and 250
then reconstructed in the same manner as data. Identical cuts to those used in the data analysis are applied to this 251 embedded simulation. 252
y
-3
-2
-1
0
1
2
3
(GeV/c)
Tp
0
1
2
3
4
5
6
7
8
-610
-510
-410
-310
-210
-110
rec ε AFIG. 4. (color online) The Aεrec as a function of rapidity (x-axis) and pT (y-axis) for φ mesons.
Figure 4 shows the Aεrec as a function of pT and rapidity for φ mesons. The Aεrec reaches a few percent at high-pT 253
and rapidly decreases at low momentum limiting this study to pT > 1 GeV/c. 254
B. φ → e+e−
measurement
255
The dielectron data set for this analysis was recorded in 2008 using a MB trigger that required at least one hit in 256
each of the BBC detectors with an ERT (EMCal-RICH trigger). The ERT requires a minimum energy deposit of 0.6 257
and 0.8 GeV/c in a tile of 2 × 2 EMCal towers matched to a hit in the RICH. The trigger efficiencies are described 258
in detail in Ref. [45]. 259
A set of quality assurance cuts is applied to the data to select good electron candidates and improve the signal 260
to background ratio. Event selection requires the BBC collision z vertex to be reconstructed within ±30 cm of the 261
center of the interaction region along the beam direction. Charged tracks are reconstructed using the DC and pad 262
chambers and requiring pT > 0.2 GeV/c. Electrons are identified mainly by the RICH detector. Furthermore, an 263
electron candidate is required to have a good match to a cluster in the EMCAL, and the energy, E, of the cluster 264
must satisfy the requirement E/p > 0.5, where p is the momentum measured by the DCs. The RICH and EMCal 265
combined provide an e/π rejection factor of order 104. 266
Electrons and positrons reconstructed in an event are combined into pairs. The resulting mass spectrum contains 267
both the signal and an inherent background. The uncorrelated part of the background is estimated via an event-268
mixing technique [46], which combines electrons from different events within the same centrality and vertex class. To 269
extract the φ meson raw yield, the subtracted mass spectrum is fitted by a function consisting of several contributions. 270
The φ and ω meson peaks are approximated by a Breit-Wigner distribution convolved with a Gaussian distribution. 271
Parameters of the Breit-Wigner part are set to the global averaged values [41] and the width of the Gaussian part is 272
to account for the detector mass resolution. Because the production ratio of ρ meson to ω meson is assumed to be 273
1.15, their ratio in the fit is given by the ratio of their branching ratios to e+e− in vacuum. The φ meson yield is 274
then extracted by summing up the bin contents in a ±3σ window, where σ is extracted from the fit, and subtracting 275
the background determined by integrating the polynomial over the same window. 276
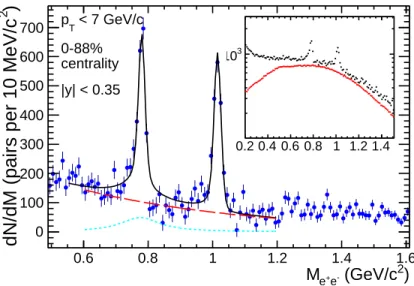
Figure 5 shows an example of the fit to the mixed event subtracted mass spectrum. The mixed events were 277
normalized in the mass range between 0.7 to 1.5 GeV/c2. The stability of the results was checked by varying the 278
normalization region, and the difference was included in the systematic errors. The ratio of real to normalized mixed 279
events was found to be flat in the region of interest for this analysis indicating the validity of the normalization. 280
Complete details describing the estimation of the systematic uncertainty on the raw yield extraction by varying the 281
background normalization, fitting functions, range and counting method can be found in Ref. [45]. 282
)
2(GeV/c
-e + eM
0.6 0.8 1 1.2 1.4 1.6)
2dN/dM (pairs per 10 MeV/c
0100 200 300 400 500 600 700 pT < 7 GeV/c 0-88% centrality |y| < 0.35 0.2 0.4 0.6 0.8 1 1.2 1.4 3 10
FIG. 5. (color online) pT-integrated unlike-sign e+e−mass spectrum measured by the PHENIX central arms after subtracting the
uncorrelated combinatorial background in the minimum-bias d+Au collisions. The dotted-line shows the ρ meson contribution and the dashed line is the polynomial background, which describes the residual correlated background. The insert shows the raw spectrum before subtraction, overlaid with the normalized combinatorial background, which is estimated using the mixed-event technique.
The detector acceptance and reconstruction efficiency, as well as trigger efficiency were determined using a 283
geant [44] based simulation of the PHENIX detector that tuned the detector response to a set of characteris-284
tics (dead and hot channel maps, gains, noise, etc) that described the performance of each detector subsystem. The 285
φ → e+e− decays were generated with a realistic p
T distribution of φ mesons, within |y| < 0.5 in rapidity, and in full 286
azimuth. The simulated φ meson mean and width of the invariant mass peak were verified to match the measured 287
values in real data at all pT. More details are given in Ref. [38]. 288
C. Calculation of invariant yields and nuclear-modification factors
289
The dilepton φ meson invariant yield in a given rapidity, pT, and centrality bin is 290 Bll 2πpT d2N dydpT = 1 2πpT 1 ∆y∆pT cNφ εtotNevt, (1)
where Bll is the φ → l+l− branching ratio, Nφ is the measured φ meson yield, Nevt is the number of sampled MB 291
events in the given centrality bin, ∆y is the width of the rapidity bin, ∆pT is the width of the pT bin, , and c is the 292
BBC bias correction factor [21, 47]. εtot includes trigger efficiencies, acceptance and reconstruction efficiency [45, 48]. 293
The data points are corrected to account for the finite width of the analyzed pT bins [49]. 294
To gain insight into nuclear medium effects and particle production mechanisms in d+Au collisions, the ratio of the 295
φ meson yields in d+Au collisions to p+p collisions scaled by the number of nucleon-nucleon collisions in the d+Au 296
system, Ncoll[21], is calculated as: 297 RdAu= d2N dAu/dydpT Ncoll× d2Npp/dydpT , (2) where d2N
dAu/dydpT is the per-event yield of particle production in d+Au collisions and d2Npp/dydpT is the 298
per-event yield of the same process in p+p collisions. The p+p invariant yield used in the RdAu calculation for 299
the µ+µ− decay channel is the p+p differential cross section from Ref. [39] divided by the p+p total cross section, 300
42.2 mb. The measured p+p differential cross sections for e+e−and K+K−decay channels are consistent [38] and the 301
p+p reference used in the e+e− RdAu calculations is extracted from a Tsallis function fit of the combined e+e− and 302
K+K− spectra. 303
D. Systematic uncertainties
304
The systematic uncertainties associated with the measured invariant yields and nuclear modification factors can 305
be divided into three categories based upon the effect each source has on the measured results. All uncertainties 306
are reported as standard deviations. Type-A: point-to-point uncorrelated uncertainties that allow the data points to 307
move independently with respect to one another and are added in quadrature with statistical uncertainties. Type-B: 308
point-to-point correlated uncertainties that allow the data points to move coherently within the quoted range. Type-309
C: correlated uncertainties that allow the data points to move together by a common multiplicative factor, a global 310
uncertainty. 311
At forward and backward rapidities, a 5% type-A uncertainty is assigned to signal extraction, which corresponds to 312
the average variation between the results from the different yield extraction fits. Type-B uncertainties, point-to-point 313
correlated uncertainties to some degree in pT, include a 4% uncertainty from MuID tube efficiency and 2% from 314
MuTr overall efficiency. An 8% uncertainty on the yield is assigned to account for a 2% absolute momentum scale 315
uncertainty, which was estimated by measuring the J/ψ mass. 316
A 9% (8%) uncertainty is assigned to the −2.2 < y < −1.2 (1.2 < y < 2.2) rapidity bins due to the uncertainties in 317
the Aεrecdetermination method itself. The Aεrec at the lowest pT bin is small and sensitive to variations in the slope 318
of the input pT distribution which affects the differential cross section calculations at this pT bin. To understand 319
this effect, the pT dependent cross section is fitted by three commonly used fit functions (Hagedorn [50], Kaplan [51], 320
and Tsallis [38]) over the pT range, 2 < pT < 7 GeV/c, and the fitted functions are extrapolated to the lowest pT 321
bin, 1 < pT < 2 GeV/c. The differences between the values extracted from these fits and the measured one at 322
the lowest pT bin is within 8%, hence an additional 8% systematic uncertainty is assigned to the lowest pT bin to 323
account for these differences. For the pT integrated and rapidity dependent invariant yields the 8% uncertainty is 324
assigned to all data bins. Type-B systematic uncertainties are added in quadrature and are shown as boxes. Finally, 325
an overall normalization uncertainty of 10% (0.1%–5.8%) for p+p (d+Au) is assigned to the BBC bias correction (c) 326
uncertainties and are labeled as type-C [23]. The BBC bias correction uncertainties for d+Au vary with centrality 327
and are considered as type-B for centrality dependent spectra. 328
For the nuclear modification factor, the type-A systematic uncertainties arise from the quadratic sum of type-A 329
systematic uncertainty in p+p and d+Au invariant yields [39]. Systematic uncertainties including MuID and MuTr 330
TABLE I. Systematic uncertainties included in the invariant yield and the nuclear modification factor calculations at forward and backward rapidities. As explained in the text, there is an 8% type-B systematic uncertainty due to small acceptance that impacts the low-pT region only which is not listed below.
Source Value (%) Type
Signal extraction 5 A
MuID efficiency 4 B
MuTr efficiency 2 B
Aεrec[north/south] 8 / 9 B
Absolute momentum scale 8 B
Total Type-B 13 B
BBC bias correction for p+p (d+Au) 10 (0.1–5.8) C
Ncoll 5–7 C
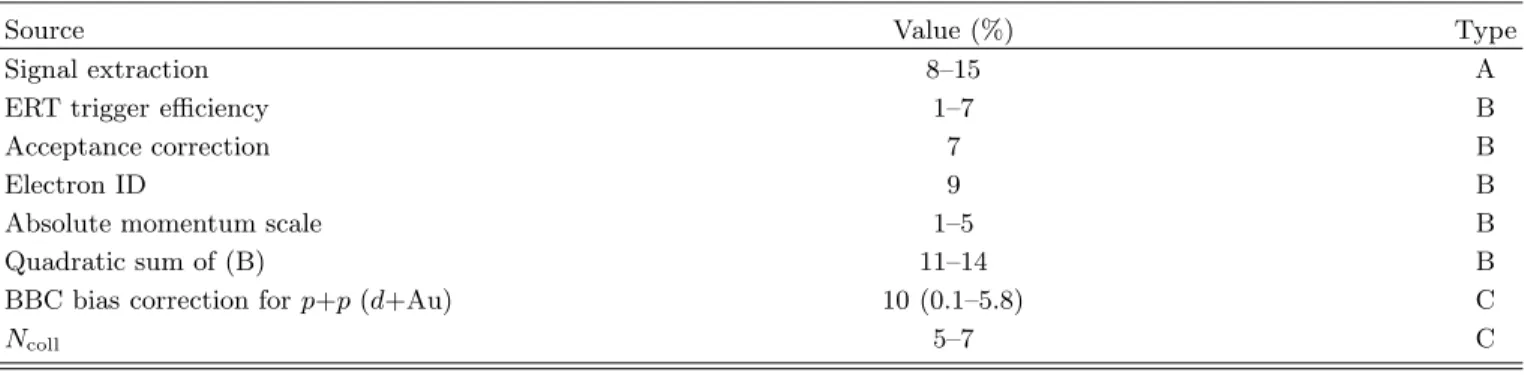
TABLE II. Systematic uncertainties included in the invariant yield and the nuclear modification factor calculations at midra-pidity.
Source Value (%) Type
Signal extraction 8–15 A
ERT trigger efficiency 1–7 B
Acceptance correction 7 B
Electron ID 9 B
Absolute momentum scale 1–5 B
Quadratic sum of (B) 11–14 B
BBC bias correction for p+p (d+Au) 10 (0.1–5.8) C
Ncoll 5–7 C
efficiencies and absolute momentum scale are the same between the d+Au and p+p invariant yields and cancel out. 331
A 9% (7%) systematic uncertainty in the Aεrec at −2.2 < y < −1.2 (1.2 < y < 2.2), that is carried over from p+p, 332
is added in quadrature to type-B systematic uncertainties listed in Table I. The acceptance limitation at the lowest 333
pT bin is the same between d+Au and p+p data because it is collected using the same detector and the associated 334
type-B systematic uncertainty cancels out. Type-C systematic uncertainties for the nuclear modification factor are 335
the quadratic sum of the type-C systematic uncertainties for the invariant yields of p+p and d+Au collisions and the 336
uncertainty associated with Ncoll. The systematic uncertainties are listed in Table I. 337
At midrapidity, the main contribution to the systematic uncertainties of type-A is the uncertainty associated with 338
the raw yield extraction, 8%–15%. This uncertainty is calculated by varying the background normalization, fitting 339
functions, range, and counting methods. Type-B systematic uncertainties, point-to-point correlated uncertainties in 340
pT, include uncertainties in the ERT trigger efficiency (1%–7%) and electron identification (9%), which are estimated 341
by varying the analysis cuts. The acceptance correction uncertainty is 7% and the momentum scale uncertainty is 342
1%–5%. An overall normalization uncertainty, type-C, was assigned for the p+p (d+Au) BBC bias correction, which 343
amounts to 10% (0.1%–5.8%). 344
For the nuclear-modification factor, the electron identification and branching ratio uncertainties are the same 345
between p+p and d+Au and cancel out. As for the rest of the systematic uncertainties, the uncertainties for each 346
type are added in quadrature between p+p and d+Au. Additionally, the Ncoll uncertainty is added in quadrature to 347
the rest of type-C uncertainties. The systematic uncertainties are listed in Table II. 348
IV. RESULTS
349
Figure 6 shows the φ meson invariant yields in d+Au and p+p as a function of pT in the Au-going direction 350
−2.2 < y < −1.2, in the d-going direction 1.2 < y < 2.2, and at midrapidity |y| < 0.35. The invariant yields measured 351
at forward and backward rapidities for all centralities are significantly different from each other. At midrapidity, the 352
magnitude of the invariant yield is close to 353
that of the backward rapidity, in contrast to what was observed in p+p collisions [38] where the forward and backward 354
(GeV/c)
Tp
0 1 2 3 4 5 6]
-2[(GeV/c)
TN/dydp
2d
llB
-1)
Tp
π
(2
-10 10 -9 10 -8 10 -7 10 -6 10 -5 10 Centrality: 0-100%PHENIX
= 200 GeV NN s +Au d 6% Global Uncertainty ±-2.2<y<-1.2
1.2<y<2.2
|y|<0.35
FIG. 6. (color online) φ meson invariant yields as a function of pT in the Au-going direction (solid blue squares) and in the
d-going direction (solid red points). The φ meson invariant yields at midrapidity are shown as solid green triangles. The vertical bars represent the statistical uncertainties and the boxes represent type-B systematic uncertainties. The ±6% global uncertainty is the associated type-C uncertainty.
rapidities have the same invariant yields and both are smaller than the midrapidity invariant yield. 355
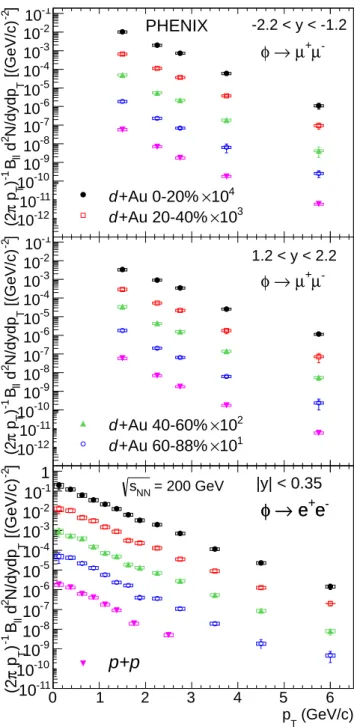
Figure 7 shows the invariant yields as a function of pT for the different centrality intervals measured in p+p and 356
d+Au collisions. The d+Au data are presented in different centrality classes: 0%–20%, 20%–40%, 40%–60%, and 357
60%–88%, which are determined using the BBC over the pseudorapidity range 3.1 < |η| < 3.9, for the 1.2 < |y| < 2.2 358
and |y| < 0.35 regions. The three panels describe the three rapidity regions. The same centrality definition is used as 359
in Ref. [47]. The wide rapidity coverage of the full PHENIX detector over an extended pT range is demonstrated. 360
Figure 8 shows the RdAu for φ mesons measured in all centralities as a function of pT at forward and backward 361
rapidities and at midrapidity, also compared with RdAu measured in the φ → K+K− decay channel [36]. The φ 362
meson RdAu behavior measured in the three different rapidity regions is not the same. In the Au-going direction, 363
the RdAu is consistent with unity at the lowest measured pT and increases to RdAu ∼ 2 at pT = 2.7 GeV/c. It then 364
decreases to unity at the highest measured pT. In the d-going direction strong suppression is observed at the lowest 365
measured pT and then the RdAu increases to unity at higher pT. At midrapidity, where the measurement starts at 366
pT =0, the yield of the φ meson is suppressed below 1 GeV/c and RdAu is consistent with unity above that. The 367
RdAu measured in the φ → K+K−channel agrees with the measurement of φ → e+e−within uncertainties in the pT 368
region where the measurements overlap. The enhanced yield observed in the Au-going direction at intermediate pT 369
is characteristic of the Cronin effect [5]: enhancement of high pT particle production in d+Au collisions relative to 370
scaled p+p collisions with a corresponding depletion at low pT. The φ enhancement in the Au-going direction and 371
the suppression in the d-going direction are consistent with what is observed by ALICE in p+Pb collisions at √sN N 372
=5.02 TeV in −4.46 < y < −2.96 and 2.03 < y < 3.53 [53]. 373
Figure 9 shows the RdAuof the φ meson as a function of rapidity, summed over the pT range 1 < pT < 7 GeV/c and 374
integrated over all centralities. The RdAuis enhanced in the Au-going direction, shows no modification at midrapidity 375
and is suppressed in the d-going direction. 376
Figure 10 shows that the φ meson nuclear modification factor, measured as a function of rapidity, is consistent with 377
that of leptons coming from decays of heavy flavor particles [22, 26]. This similarity is interesting given that heavy 378
flavor quark production is expected to be dominated by hard processes over the accessed pT range. In contrast, one 379
expects a significant contribution to φ meson production from soft processes, particularly at low pT where the yield 380
is dominant. This backward/forward enhancement/suppression in d+Au collisions is also observed in d+Au charged 381
hadron density results measured by PHOBOS [10]. The charged hadron result is often considered as a rapidity shift 382
in the Au-going direction via soft processes. 383
Figure 10 also shows the J/ψ RdAu [52]. In the case of the J/ψ, the relative RdAu modification as a function of 384
rapidity is similar to that of the φ meson and heavy flavor decay leptons. However, the J/ψ suffers from additional 385
suppression at backward and midrapidity, which could be due to a larger break up cross section or effects in the 386
0 1 2 3 4 5 6 ] -2 [(GeV/c) T N/dydp 2 dll B -1 ) T p π (210-12 -11 10 -10 10 -9 10 -8 10 -7 10 -6 10 -5 10 -4 10 -3 10 -2 10 -1 10 4
10
×
+Au 0-20%
d
310
×
+Au 20-40%
d
-µ
+µ
→
φ
-2.2 < y < -1.2PHENIX
0 1 2 3 4 5 6 ] -2 [(GeV/c) T N/dydp 2 dll B -1 ) T p π (210-12 -11 10 -10 10 -9 10 -8 10 -7 10 -6 10 -5 10 -4 10 -3 10 -2 10 -1 10 210
×
+Au 40-60%
d
110
×
+Au 60-88%
d
1.2 < y < 2.2-µ
+µ
→
φ
(GeV/c) T p 0 1 2 3 4 5 6]
-2[(GeV/c)
TN/dydp
2d
llB
-1)
Tp
π
(2
10
-11 -1010
-910
-810
-710
-610
-510
-410
-310
-210
-110
1
-e
+e
→
φ
|y| < 0.35
-e
+e
→
φ
p+p
= 200 GeV NN sFIG. 7. (color online) Invariant pT spectra of the φ meson
for different centrality classes in d+Au and p+p collisions at √sN N = 200 GeV [39]. The vertical bars represent the
statistical uncertainties and the boxes represent type-B sys-tematic uncertainties. Type-C syssys-tematic uncertainties are 0.1%–5.8% for d+Au invariant yields and 10% for p+p in-variant yields. The spectra are scaled by arbitrary factors for clarity. (GeV/c) T p 0 1 2 3 4 5 6 7 dAu
R
0 0.5 1 1.5 2 2.5 3 3.5 (-2.2 < y < -1.2) -µ + µ → φ ( 1.2 < y < 2.2) -µ + µ → φ (|y|<0.35) -e + e → φ (|y|<0.35) -K + K → φ 13% Global Uncertainty ± = 200 GeV NN s +Au d Centrality: 0-100% PHENIXFIG. 8. (color online) The φ meson nuclear-modification fac-tor, RdAu, as a function of pT. The solid blue squares
indi-cate the Au-going direction and the solid red circles indiindi-cate the d-going direction. The upright black triangles are for φ → K+K−at midrapidity [36] while the inverted triangles
are for φ → e+e−. The vertical bars represent the
statisti-cal uncertainties and the boxes represent type-B systematic uncertainties. The ±13% global uncertainty is the associated type-C uncertainty. y -2.5 -2 -1.5 -1 -0.5 0 0.5 1 1.5 2 2.5 dAu
R
0 0.2 0.4 0.6 0.8 1 1.2 1.4 1.6 1.8 2 (|y|<0.35) -e + e → φ (|y|<0.35) -K + K → φ (-2.2 < y < -1.2) -µ + µ → φ ( 1.2 < y < 2.2) -µ + µ → φ = 200 GeV NN s +Au d < 7 GeV/c T 1 < p Centrality: 0-100% 13% Global Uncertainty ± PHENIXFIG. 9. (color online) The φ meson nuclear modification fac-tor, RdAu, as a function of rapidity. The solid blue squares
indicate the Au-going direction while the d-going direction is shown in solid red circles. At midrapidity, the upright black triangles are for φ → K+K− [36] while the inverted
trian-gles are for φ → e+e−. The midrapidity points are slightly
displaced from zero for clarity. The vertical bars represent the statistical uncertainties and the boxes represent type-B systematic uncertainties. The ±13% global uncertainty is the associated type-C uncertainty.
y -3 -2 -1 0 1 2 3 dAu
R
0 0.2 0.4 0.6 0.8 1 1.2 1.4 1.6 1.8 2 < 7 (GeV/c) T 1 < p φ < 7 (GeV/c) T 0 < p ψ J/Heavy Flavor decay < 6 (GeV/c) T
leptons 1 < p
PHENIX
d+Au sNN = 200 GeVCentrality: 0-100%
FIG. 10. (color online) J/ψ [52] (full green circles), heavy flavor decay leptons [22, 26] (full blue triangles) and φ me-son (full red squares) nuclear modification factors, RdAu, as a
function of rapidity. The vertical bars represent the statistical uncertainties and the boxes represent type-B systematic un-certainties. The type-C systematic uncertainties associated with heavy-flavor and J/ψ meson measurements are 10% and 8%, respectively. coll N 0 2 4 6 8 10 12 14 16 18 20 dAu
R
0 0.5 1 1.5 2 2.5 (-2.2 < y < -1.2) -µ + µ → φ ( 1.2 < y < 2.2) -µ + µ → φ (|y|<0.35) -e + e → φ (|y|<0.35) -K + K → φ < 7 GeV T 1< p = 200 GeV NN s +Au d 10% Global Uncertainty ±PHENIX
FIG. 11. (color online) The φ meson nuclear modification factor, RdAu, as a function of Ncoll. The solid blue squares
indicate the Au-going direction while the d-going direction is shown in solid red circles. At midrapidity, the upright black triangles are for φ → K+K−[36] while the inverted triangles
are for φ → e+e−. The vertical bars represent the
statisti-cal uncertainties and the boxes represent type-B systematic uncertainties. The ±10% global uncertainty is the associated type-C uncertainty. dAu
R
0 0.5 1 1.5 2 2.5 3 (a) Centrality: 0 - 20 %PHENIX
12% Global Uncertainty ± dAuR
0 0.5 1 1.5 2 2.5 3 (b) Centrality: 20 - 40 % = 200 GeV NN s 12% Global Uncertainty ± dAuR
0 0.5 1 1.5 2 2.5 3 (c) Centrality: 40 - 60 % 12% Global Uncertainty ± 0 1 2 3 4 5 6 7 dAuR
0 0.5 1 1.5 2 2.5 3 Centrality: 60 - 88 %(-2.2 < y < -1.2)
-µ
+µ
→
φ
( 1.2 < y < 2.2)
-µ
+µ
→
φ
(|y|<0.35)
-e
+e
→
φ
(|y|<0.35)
-K
+K
→
φ
(d) 13% Global Uncertainty ±(GeV/c)
Tp
FIG. 12. (color online) The φ meson RdAu as a
func-tion of pT for the centralities (a) 0%–20%, (b) 20%–40%,
(c) 40%–60%, and (d) 60%–88% in the Au-going direction (solid blue squares) and the d-going direction (solid red cir-cles). At midrapidity, the upright black triangles are from φ → K+K− [36] while the upside down triangles are from
φ → e+e−. The vertical bars represent the statistical
un-certainties and the boxes represent type-B systematic uncer-tainties. The ±12%–13% global uncertainty is the associated type-C uncertainty.
higher-energy-density backward-rapidity region. 387
At midrapidity, PHENIX measured the nuclear-modification factors of protons and of several mesons from the light 388
(π) meson up to the φ meson with a mass similar to that of protons. The results show no significant dependence 389
of RdAu on the mass of the particle [24], whereas the measurements reveal a significant dependence of RdAu on the 390
number of valence quarks. All mesons show no or very small enhancement in comparison to protons in the low to 391
medium pT region. 392
Figure 11 shows the RdAu integrated over the pT range 1 < pT < 7 GeV/c as a function of centrality for three 393
rapidity intervals: −2.2 < y < −1.2, 1.2 < y < 2.2 and |y| < 0.35. The RdAu is integrated over the pT range 394
1 < pT < 7 GeV/c and the rapidity ranges −2.2 < y < −1.2, 1.2 < y < 2.2 and |y| < 0.35. In the Au-going direction, 395
the RdAu shows an indication of enhancement with Ncoll and in the d-going direction shows a strong suppression at 396
high Ncoll. At midrapidity, the RdAu for φ mesons reconstructed in e+e− is consistent with unity at all centralities. 397
This is also consistent with the measurement done in the K+K− decay channel. 398
Figure 12 shows RdAu as a function of pT in different d+Au centrality classes for three rapidity regions covered by 399
the PHENIX detector: backward, mid, and forward rapidities. In the most peripheral collisions (60%–88%), shown 400
in the lowest panel of the figure, the nuclear-modification factor measured in all three rapidity regions is consistent 401
with unity at all measured pT. In the more central collisions the RdAu remains at unity only in the midrapidity region 402
for pT above 1 GeV/c. This is consistent between the measurements done in the e+e− and in the K+K− decay 403
channels. In the Au-going direction, the RdAu reaches a maximum at pT close to 2.7 GeV/c with an amplitude that 404
grows towards more central collisions. At higher pT the RdAu diminishes, approaching unity in all measured centrality 405
classes. In the d-going direction, all points above 2.7 GeV/c are consistent with unity. Below pT =2.7 GeV/c Fig. 12 406
shows RdAu < 1, with more suppression in the most central collisions compared to other centralities. 407
The enhancement at backward rapidity is consistent with nuclear pT broadening at moderate pT and gluon anti-408
shadowing, while the suppression at forward rapidity may suggest gluon shadowing and/or partonic energy loss. The 409
RdAu enhancement (suppression) at backward (forward) rapidity in the most central collisions decreases gradually 410
from central to peripheral collisions where for the most peripheral collisions RdAu shows no overall modification. 411
Whether the φ meson is dominated by soft or hard processes remains an open question. 412
V. SUMMARY AND CONCLUSIONS
413
PHENIX has measured the production of φ mesons in d+Au collisions at √sN N = 200 GeV via their decay to 414
dimuons and dielectrons. The φ meson is measured in the forward, d-going direction, 1.2 < y < 2.2 in the pT range 415
from 1 to 7 GeV/c, at midrapidity |y| < 0.35 in the pT range below 7 GeV/c, and in the backward, the Au-going 416
direction, −2.2 < y < −1.2 in the pT range from 1 to 7 GeV/c. 417
The measurements reveal that the φ meson yields in d+Au compared to binary collision scaled p+p at pT > 2 GeV/c 418
are suppressed in the d-going direction and enhanced in the Au-going direction. The yield measured at midrapidity 419
is consistent with binary collision scaled p+p. No significant modification of φ meson production is observed in 420
the most peripheral d+Au collisions. With centrality increasing from semi-peripheral events to central the RdAu 421
shows more pronounced suppression in the d-going and more increasing enhancement in Au-going direction. In that 422
rapidity region, the RdAuhas a pT dependence, which is characteristic of a Cronin-type effect. A similar enhancement 423
(suppression) was observed by ALICE in p+Pb collisions at √sN N = 5.02 TeV [53]. The rapidity dependence of 424
the RdAu in φ-meson production is similar to the open heavy flavor modification [26] which may indicate a general 425
rapidity shift compared to the symmetric system and/or similar cold-nuclear matter effects are present in both the φ 426
meson and open heavy-flavor production. 427
ACKNOWLEDGMENTS
428
We thank the staff of the Collider-Accelerator and Physics Departments at Brookhaven National Laboratory and 429
the staff of the other PHENIX participating institutions for their vital contributions. We acknowledge support from 430
the Office of Nuclear Physics in the Office of Science of the Department of Energy, the National Science Foundation, 431
Abilene Christian University Research Council, Research Foundation of SUNY, and Dean of the College of Arts 432
and Sciences, Vanderbilt University (U.S.A), Ministry of Education, Culture, Sports, Science, and Technology and 433
the Japan Society for the Promotion of Science (Japan), Conselho Nacional de Desenvolvimento Cient´ıfico e Tec-434
nol´ogico and Funda¸c˜ao de Amparo `a Pesquisa do Estado de S˜ao Paulo (Brazil), Natural Science Foundation of China 435
(P. R. China), Ministry of Science, Education, and Sports (Croatia), Ministry of Education, Youth and Sports (Czech 436
Republic), Centre National de la Recherche Scientifique, Commissariat `a l’´Energie Atomique, and Institut National de 437
Physique Nucl´eaire et de Physique des Particules (France), Bundesministerium f¨ur Bildung und Forschung, Deutscher 438
Akademischer Austausch Dienst, and Alexander von Humboldt Stiftung (Germany), National Science Fund, OTKA, 439
K´aroly R´obert University College, and the Ch. Simonyi Fund (Hungary), Department of Atomic Energy and Depart-440
ment of Science and Technology (India), Israel Science Foundation (Israel), Basic Science Research Program through 441
NRF of the Ministry of Education (Korea), Physics Department, Lahore University of Management Sciences (Pak-442
istan), Ministry of Education and Science, Russian Academy of Sciences, Federal Agency of Atomic Energy (Russia), 443
VR and Wallenberg Foundation (Sweden), the U.S. Civilian Research and Development Foundation for the Indepen-444
dent States of the Former Soviet Union, the Hungarian American Enterprise Scholarship Fund, and the US-Israel 445
Binational Science Foundation. 446
APPENDIX
447
Tables III–VI show the numerical values of the measured invariant yields and RdAu that are plotted in Figs. 6–12. 448
As noted in each caption, the first uncertainty is statistical and the second is type-B systematic. 449
TABLE III. Invariant yields of φ meson production as a function of pTat different d+Au centrality classes. The first uncertainty
is statistical and the second is type-B systematic.
pminT pmaxT 2BllπpT d2 N dydpT (GeV/c)−2 (GeV/c) 0%–100% 0%–20% 20%–40% 40%–60% 60%–88% −2.2 < y < −1.2 1.0 2.0 (4.35±0.41±0.65)×10−7 (1.01±0.12±0.15)×10−6 (6.56±1.32±0.98)×10−7 (4.94±0.83±0.74)×10−7 (1.89±0.32±0.28)×10−7 2.0 2.5 (8.70±0.75±1.13)×10−8 (1.95±0.19±0.25)×10−7 (1.12±0.17±0.15)×10−7 (5.47±0.87±0.71)×10−8 (2.32±0.44±0.30)×10−8 2.5 3.0 (3.09±0.25±0.40)×10−8 (7.35±0.68±0.95)×10−8 (3.68±0.62±0.48)×10−8 (2.23±0.32±0.29)×10−8 (7.05±1.51±0.92)×10−9 3.0 4.5 (2.70±0.22±0.35)×10−9 (5.95±0.82±0.77)×10−9 (3.79±0.49±0.49)×10−9 (1.87±0.29±0.24)×10−9 (6.52±3.22±0.85)×10−10 4.5 7.0 (6.35±1.72±0.83)×10−11 (1.10±0.39±0.14)×10−10 (9.61±3.51±1.25)×10−11 (4.28±2.40±0.56)×10−11 (2.59±1.04±0.34)×10−11 1.2 < y < 2.2 1.0 2.0 (2.00±0.25±0.30)×10−7 (3.37±0.65±0.51)×10−7 (2.93±0.61±0.44)×10−7 (3.47±0.76±0.52)×10−7 (1.82±0.31±0.27)×10−7 2.0 2.5 (3.80±0.54±0.49)×10−8 (9.30±1.59±1.21)×10−8 (5.47±0.73±0.71)×10−8 (4.42±0.71±0.57)×10−8 (2.07±0.44±0.27)×10−8 2.5 3.0 (1.68±0.18±0.22)×10−8 (3.47±0.56±0.45)×10−8 (2.18±0.37±0.28)×10−8 (1.60±0.25±0.21)×10−8 (6.52±1.07±0.85)×10−9 3.0 4.5 (1.48±0.14±0.19)×10−9 (2.60±0.63±0.34)×10−9 (1.80±0.60±0.23)×10−9 (1.44±0.24±0.19)×10−9 (6.24±1.33±0.81)×10−10 4.5 7.0 (6.23±1.51±0.81)×10−11 (1.16±0.27±0.15)×10−10 (7.13±3.73±0.93)×10−11 (5.55±1.78±0.72)×10−11 (2.39±1.40±0.31)×10−11 |y| < 0.35 0.00 0.25 (9.81±2.88±3.01)×10−6 (1.93±0.76±0.55)×10−5 (1.23±0.53±0.33)×10−5 (8.92±4.22±2.42)×10−6 (4.87±2.74±1.26)×10−6 0.25 0.50 (7.18±0.74±1.57)×10−6 (1.23±0.22±0.23)×10−5 (1.03±0.16±0.22)×10−5 (5.46±1.02±1.05)×10−6 (4.28±0.81±0.81)×10−6 0.50 0.75 (3.49±0.35±0.71)×10−6 (6.11±1.00±1.30)×10−6 (4.52±0.69±0.90)×10−6 (3.96±0.54±0.69)×10−6 (2.18±0.36±0.39)×10−6 0.75 1.00 (2.19±0.18±0.42)×10−6 (3.54±0.46±0.70)×10−6 (3.13±0.36±0.58)×10−6 (1.54±0.20±0.25)×10−6 (1.28±0.17±0.22)×10−6 1.00 1.25 (1.18±0.09±0.21)×10−6 (2.16±0.24±0.40)×10−6 (1.51±0.17±0.27)×10−6 (7.44±1.13±1.21)×10−7 (5.70±0.93±0.93)×10−7 1.25 1.50 (6.20±0.49±1.08)×10−7 (1.26±0.14±0.22)×10−6 (8.92±0.99±1.51)×10−7 (4.87±0.67±0.77)×10−7 (2.37±0.38±0.39)×10−7 1.50 1.75 (2.75±0.24±0.46)×10−7 (6.32±0.78±1.08)×10−7 (3.13±0.45±0.51)×10−7 (1.90±0.30±0.30)×10−7 (1.65±0.26±0.27)×10−7 1.75 2.00 (1.59±0.15±0.26)×10−7 (3.31±0.43±0.55)×10−7 (2.34±0.30±0.37)×10−7 (1.32±0.21±0.21)×10−7 (4.11±1.03±0.67)×10−8 2.00 2.50 (9.22±0.62±1.48)×10−8 (2.01±0.18±0.32)×10−7 (1.29±0.12±0.20)×10−7 (7.15±0.85±1.13)×10−8 (3.60±0.56±0.59)×10−8 2.50 3.00 (3.19±0.24±0.49)×10−8 (7.12±0.71±1.10)×10−8 (3.54±0.44±0.53)×10−8 (2.84±0.39±0.44)×10−8 (1.10±0.22±0.18)×10−8 3.00 4.00 (6.17±0.49±0.94)×10−9 (1.15±0.14±0.18)×10−8 (8.92±1.10±1.36)×10−9 (5.52±0.81±0.88)×10−9 (1.94±0.44±0.33)×10−9 4.00 5.00 (9.45±1.25±1.47)×10−10 (2.27±0.37±0.37)×10−9 (1.27±0.26±0.20)×10−9 (8.74±2.06±1.57)×10−10 (1.87±1.10±0.34)×10−10 5.00 7.00 (1.02±0.19±0.17)×10−10 (1.46±0.45±0.25)×10−10 (1.98±0.50±0.03)×10−10 (8.27±3.16±1.59)×10−11 (4.79±2.74±0.90)×10−11
TABLE IV. RdAuas a function of rapidity of φ meson summed over the pT range, 1 < pT < 7 GeV/c for 0%–100% centrality.
The first uncertainty is statistical and the second is type-B systematic.
ymin ymax RdAu
-2.2 -2.0 1.23±0.12±0.20 -2.0 -1.7 1.30±0.13±0.21 -1.7 -1.1 1.34±0.13±0.21 -0.35 0.35 1.02±0.11±0.07 1.2 1.7 0.90±0.11±0.13 1.7 2.0 0.79±0.07±0.11 2.0 2.2 0.44±0.06±0.06
TABLE V. RdAu vs Ncoll of φ meson at 1 < pT < 7 GeV/c. The first uncertainty is statistical and the second is type-B
systematic.
RdAu
Centrality hNcolli −2.2 < y < −1.2 1.2 < y < 2.2 |y| < 0.35
0%–20% 15.1±1.0 1.26±0.21±0.21 0.73±0.12±0.12 1.03±0.11±0.09 20%–40% 10.2±0.7 1.25±0.20±0.20 0.65±0.10±0.11 1.00±0.10±0.09 40%–60% 6.6±0.4 1.18±0.20±0.19 0.80±0.11±0.13 0.86±0.09±0.08 60%–88% 3.2±0.2 1.24±0.22±0.20 0.95±0.17±0.16 1.04±0.11±0.09
TABLE VI. RdAu and pT at different d+Au centrality classes. The first uncertainty is statistical and the second is type-B systematic. pmin T pmaxT RdAu (GeV/c) 0%–100% 0%–20% 20%–40% 40%–60% 60%–88% −2.2 < y < −1.2 1.0 2.0 0.92±0.10±0.12 1.07±0.14±0.14 1.03±0.22±0.13 1.20±0.22±0.16 0.94±0.17±0.12 2.0 2.5 1.57±0.16±0.19 1.78±0.20±0.18 1.51±0.25±0.15 1.14±0.19±0.11 1.00±0.20±0.10 2.5 3.0 2.19±0.22±0.26 2.63±0.29±0.26 1.95±0.35±0.19 1.83±0.28±0.18 1.19±0.26±0.12 3.0 4.5 1.66±0.17±0.20 1.84±0.28±0.18 1.74±0.25±0.17 1.33±0.22±0.13 0.95±0.47±0.10 4.5 7.0 1.03±0.30±0.12 0.90±0.33±0.09 1.17±0.44±0.12 0.80±0.46±0.08 1.00±0.41±0.10 1.2 < y < 2.2 1.0 2.0 0.42±0.06±0.05 0.36±0.07±0.05 0.46±0.10±0.06 0.84±0.19±0.11 0.91±0.16±0.12 2.0 2.5 0.69±0.10±0.08 0.85±0.15±0.08 0.74±0.11±0.07 0.92±0.16±0.09 0.89±0.20±0.09 2.5 3.0 1.20±0.14±0.13 1.24±0.21±0.12 1.15±0.21±0.12 1.31±0.22±0.13 1.10±0.19±0.11 3.0 4.5 0.91±0.10±0.10 0.80±0.20±0.08 0.83±0.28±0.08 1.02±0.18±0.10 0.91±0.20±0.09 4.5 7.0 1.01±0.26±0.11 0.95±0.24±0.10 0.87±0.46±0.09 1.04±0.35±0.10 0.92±0.55±0.09 |y| < 0.35 0.00 0.25 0.70±0.29±0.18 0.69±0.33±0.18 0.65±0.33±0.16 0.73±0.40±0.19 0.82±0.51±0.21 0.25 0.50 0.72±0.18±0.08 0.62±0.17±0.07 0.76±0.21±0.08 0.63±0.18±0.07 1.00±0.28±0.11 0.50 0.75 0.74±0.18±0.07 0.65±0.19±0.06 0.71±0.19±0.07 0.97±0.24±0.10 1.10±0.29±0.11 0.75 1.00 0.71±0.15±0.07 0.58±0.14±0.06 0.75±0.16±0.07 0.57±0.12±0.06 0.98±0.21±0.10 1.00 1.25 0.86±0.20±0.09 0.80±0.20±0.08 0.82±0.20±0.08 0.63±0.16±0.06 0.99±0.26±0.10 1.25 1.50 0.89±0.22±0.09 0.91±0.23±0.09 0.95±0.24±0.09 0.81±0.21±0.08 0.81±0.22±0.08 1.50 1.75 0.75±0.18±0.07 0.87±0.22±0.08 0.63±0.16±0.06 0.60±0.16±0.06 1.10±0.28±0.10 1.75 2.00 0.82±0.19±0.08 0.86±0.22±0.08 0.89±0.22±0.09 0.78±0.21±0.08 0.50±0.17±0.05 2.00 2.50 1.20±0.26±0.12 1.30±0.30±0.13 1.20±0.28±0.12 1.10±0.26±0.10 1.10±0.29±0.11 2.50 3.00 1.30±0.29±0.13 1.50±0.34±0.14 1.10±0.26±0.10 1.30±0.33±0.13 1.10±0.31±0.10 3.00 4.00 1.20±0.27±0.13 1.20±0.28±0.12 1.30±0.32±0.13 1.30±0.33±0.13 0.94±0.30±0.09 4.00 5.00 1.30±0.33±0.14 1.60±0.43±0.17 1.30±0.39±0.14 1.40±0.47±0.15 0.63±0.40±0.07 5.00 7.00 1.80±0.54±0.21 1.30±0.52±0.15 2.70±0.91±0.30 1.70±0.80±0.19 2.10±1.30±0.23


![FIG. 10. (color online) J/ψ [52] (full green circles), heavy flavor decay leptons [22, 26] (full blue triangles) and φ me-son (full red squares) nuclear modification factors, R dAu , as a function of rapidity](https://thumb-eu.123doks.com/thumbv2/123doknet/14098615.465337/14.918.481.841.90.818/circles-leptons-triangles-squares-nuclear-modification-function-rapidity.webp)


