Publisher’s version / Version de l'éditeur:
Vous avez des questions? Nous pouvons vous aider. Pour communiquer directement avec un auteur, consultez la première page de la revue dans laquelle son article a été publié afin de trouver ses coordonnées. Si vous n’arrivez pas à les repérer, communiquez avec nous à [email protected].
Questions? Contact the NRC Publications Archive team at
[email protected]. If you wish to email the authors directly, please see the first page of the publication for their contact information.
https://publications-cnrc.canada.ca/fra/droits
L’accès à ce site Web et l’utilisation de son contenu sont assujettis aux conditions présentées dans le site
LISEZ CES CONDITIONS ATTENTIVEMENT AVANT D’UTILISER CE SITE WEB.
ISOT 2010 International Symposium on Optomechatronic Technologies: 25
October 2010, Toronto, ON [Proceedings], pp. 1-6, 2010-10-25
READ THESE TERMS AND CONDITIONS CAREFULLY BEFORE USING THIS WEBSITE. https://nrc-publications.canada.ca/eng/copyright
NRC Publications Archive Record / Notice des Archives des publications du CNRC :
https://nrc-publications.canada.ca/eng/view/object/?id=db406f02-b814-49a9-9121-bcc7f30358fe
https://publications-cnrc.canada.ca/fra/voir/objet/?id=db406f02-b814-49a9-9121-bcc7f30358fe
NRC Publications Archive
Archives des publications du CNRC
This publication could be one of several versions: author’s original, accepted manuscript or the publisher’s version. / La version de cette publication peut être l’une des suivantes : la version prépublication de l’auteur, la version acceptée du manuscrit ou la version de l’éditeur.
Access and use of this website and the material on it are subject to the Terms and Conditions set forth at
Rapid clustering from colorized 3D point cloud data for reconstructing
building interiors
http://www.nrc-cnrc.gc.ca/irc
Ra pid c lust e ring from c olorize d 3 D point c loud da t a for
re c onst ruc t ing building int e riors
N R C C - 5 3 6 0 2
K u l d e e p ; K n o p f , G . K . ; C a n a s , R .
O c t o b e r 2 0 1 0
A version of this document is published in / Une version de ce document se trouve dans:
ISOT 2010 International Symposium on Optomechatronic Technologies,
Toronto, ON, October 25-27, 2010, pp. 1-6
The material in this document is covered by the provisions of the Copyright Act, by Canadian laws, policies, regulations and international agreements. Such provisions serve to identify the information source and, in specific instances, to prohibit reproduction of materials without written permission. For more information visit http://laws.justice.gc.ca/en/showtdm/cs/C-42
Les renseignements dans ce document sont protégés par la Loi sur le droit d'auteur, par les lois, les politiques et les règlements du Canada et des accords internationaux. Ces dispositions permettent d'identifier la source de l'information et, dans certains cas, d'interdire la copie de documents sans permission écrite. Pour obtenir de plus amples renseignements : http://lois.justice.gc.ca/fr/showtdm/cs/C-42
Rapid Clustering of Colorized 3D Point Cloud Data
for Reconstructing Building Interiors
Kuldeep K.Sareen,
member, IEEEFaculty of Engineering, The University of Western Ontario London, Ontario, N6A 5B9, Canada
George K. Knopf,
member, IEEEFaculty of Engineering, The University of Western Ontario London, Ontario, N6A 5B9, Canada
Robert Canas,
member, IEEEInstitute for Research in Construction National Research Council, London, Ontario, N6G 4X8, Canada
Abstract - Range scanning of building interiors generates very
large, partially spurious and unstructured point cloud data. Accurate information extraction from such data sets is a complex task due to the presence of multiple objects, diversity of their shapes, large disparity in the feature sizes, and the spatial uncertainty due to occluded regions. A fast segmentation of such data is necessary for quick understanding of the scanned scene. Unfortunately, traditional range segmentation methodologies are computationally expensive because they rely almost exclusively on shape parameters (normal, curvature) and are highly sensitive to small geometric distortions in the captured data. This paper introduces a quick and effective segmentation technique for large volumes of colorized range scans from unknown building interiors and labelling clusters of points that represent distinct surfaces and objects in the scene. Rather than computing geometric parameters, the proposed technique uses a robust Hue, Saturation and Value (HSV) color model as an effective means of identifying rough clusters (objects) that are further refined by eliminating spurious and outlier points through region growth and a fixed distance neighbors (FDNs) analysis. The results demonstrate that the proposed method is effective in identifying continuous clusters and can extract meaningful object clusters, even from geometrically similar regions.
Keywords- 3D scanning; point data clustering; virtual reality; scene reconstruction
I. INTRODUCTION
Various disciplines use range scanning as an efficient, accurate and fast means of acquiring 3D shape information from complex scenes. These range scanning systems have been significantly improved over the last decade and are capable of capturing geometries of very large objects, complex surfaces, industrial facilities, occupied building interiors and historical sites. This process captures spatial 3D points on the visible surface(s) of the scanned scene that are used in numerous applications such as reverse engineering, computer graphics, computer vision, as-design-as-built checking and virtual reality environment reconstruction. Each application uses the captured data in its own unique way according to its explicit set of requirements. Thus, post-processing strategies of one application may not be applicable to another. However, the generalized data processing steps for all these applications include: (a) identifying the application’s specific needs, (b) defining the desired information, and (c) accurately devising methodologies for specific information extraction from a large, noisy and partially erroneous scanned data set.
Range scanning of building interiors often generates huge, noisy and partially spurious point data sets of varying density that often corresponds to multiple objects in the scanned scene. At this scanning stage, the shape capturing process should aim at minimizing the density variations, so that point-based visualization can effectively be used for quick quality evaluation of the captured data [1]. In this application, the process of extracting accurate geometric information is more important than generating complete surface models required in typical mechanical engineering tasks. Building layouts, feature clusters, and object identification are some of the typical geometric characteristics that the post processing algorithms are expected to extract.
Most of the traditional data segmentation techniques use geometric parameters (surface normal or curvature) to distinguish between dissimilar surfaces [2-4] and thus, often generate over-segmented data in a multi-object scenario. Moreover, it is computationally very expensive to compute derived geometric parameters from a large, cohesive scanned data set such as building interiors. On the other hand, segmentation strategies for large scanned data (terrestrial and aerial scanning) works on piecewise planar surface approximation using local analytical geometries [5-7]. This approach is suitable for geometrically consistent features such as exterior building facets, walls, roofs, and grounds. These shape approximation approaches often fail to extract accurate clusters from unstructured point data of interior objects with dissimilar features and varying levels of surface complexity.
Many real time applications such as virtual reality modeling, as-design as-built evaluations, computer vision, and web-based monitoring requires rapid segmentation strategies that can quickly extract meaningful data clusters for better understanding of the scanned scene. The main objectives here are (a) accelerating the clustering process and (b) extracting clusters representing objects and not the individual surfaces. The clustering process can be sped up by avoiding the computation of additional geometric attributes, such as normals, by saving its corresponding computational cost (O(n2
) using triangulation and O(p•n) through surface fitting), where
p-defines the number of points used to plane approximation. Instead of computing approximated surface properties of the scanned data, the feature parameters, such as color and spatial proximity, can be used to extract accurate object clusters and subsequently, perform reliable object identification.
In this regard, the following paper introduces a rapid color- based clustering methodology for segmenting building interiors that works directly on colored points and extracts object clusters that can be used for quick virtual reality modeling. An effective Hue, Saturation and Value (HSV) color model is used to address the common limitations of the standard Red, Green and Blue (RGB) color model. The hue parameter along with the data saturation criterion and the spatial conformity, in terms of fixed distance neighbors (FDNs), are used to effectively segment the scanned data. A typical building interior is scanned and clustered to illustrate the performance of the proposed algorithm.
The organization of the paper is as follows. Section II summarizes the published research on point data clustering and segmentation. The unique aspects of scanning complex building interiors are discussed briefly in Section III, and their domain specific needs are identified. Section IV introduces the proposed algorithm, defines the related terminology and elaborates on the main steps. Section V compiles the results of this rapid color-based clustering methodology. Finally, Section VI concludes with a summary of the findings of the algorithm and proposes future research directions.
II. PREVIOUS WORK
Point data clustering approaches can be broadly categorized into two groups: edge-based and regions-based approaches as compiled briefly in the following sub-sections.
A. Edge-Based Segmentation
Edge-based segmentation were primarily used for data compressions by identifying sharp variations in the surface geometry using approximated geometrical derivatives (surface normal, dihedral angles or principal curvatures etc.). A sharp variation signifies the region boundaries and the enclosed data represents the cluster. However such approaches often result in disjointed, isolated edge segments for noisy data [2]. Therefore, it is difficult to extract accurate clusters due to the absence of closed boundaries. Many algorithms [3, 4] attempted to devise robust methodologies to close the extracted open boundaries from the scanned data set to improve the overall clustering performance and demonstrated their effectiveness on single object's scan data. Their suitability on large objects with discontinuous topology is limited and even though these edge-based approaches don’t require complex seed point selection, their clustering limitations make it unsuitable for large data structures.
B. Region-Based Segmentation
This type of segmentation approaches attempt to extract data clusters directly from point data using bottom-up or top-down approaches. The bottom-up approach expands the cluster starting from an initial seed point by measuring the similarity criteria [8, 9] of unallocated neighboring points. Chang and Park [8] combined the Bayesian theory and Markov random field (MRF) approach to access the prior regional shape, which extracts parametric surfaces by representing the scanned objects by a series of local planar surfaces. Wang et al. [9] developed a reliable region-growing and merging algorithm based on the uncertainty of the segmented data and demonstrated on simple geometries.
The top-down approach, on the other hand, subdivides the point data based on its deviations from the fitted surface. Such segmentation methods identify simple surface features (planes, cylinders and spheres) in the scanned range data and cluster them into groups. Depth field of 2.5D terrestrial scan data set is used to extract simplified planar surfaces for building exteriors [5-7]. Some non-planar features such as trees [10] and industrial objects [11] have also been extracted using these region approximation strategies. However, most of these top-down methods have been demonstrated on exterior scanned scenes, where the shapes are known and thus can be easily approximated. Building interiors on the other hand, exhibits varying feature sizes with diverse shapes and thus cannot be approximated with priori-shape functions.
Thus, data clusters are normally extracted using region growth approach by mapping the scanned data with analytical shapes through their fitting characteristics [5-7, 12] or geometrical similarity [8, 13, 14] of surface properties. However, these approaches require the computation of additional geometric parameters, which is computationally expensive for complex scanned scenes. Thus, these are not suitable for speed intensive applications such as virtual reality. Moreover, the scanned data of building interiors captures the cohesive data of multiple objects and thus, the segmentation must focus on extracting clusters that represent individual objects and not the over-segmented surfaces.
In order to develop a rapid clustering methodology, computation of additional geometric parameters can be avoided. Instead point-based parameters such as color can be used as a discriminating attribute for achieving the desired segmentation. Many image segmentation algorithms [15-17] have demonstrated the advantages of using color in scene segmentation, yet very few methods [18, 19] have used color in 3D space for extracting point clusters from complex scanned environment. Thus, this paper presents a rapid point-based clustering methodology that attempts to extract unified clusters corresponding to interior objects in the scanned scene from colorized point cloud data. This approach combines a color-based strategy with spatial proximity using FDNs and a region growth approach that improves the robustness of the algorithm by maintaining the neighborhood coherence of spatial data points.
C. Contributions of the Paper
This paper identifies the domain specific needs of a typical scanning application involving building interiors. Then, it presents a color-based clustering methodology for extracting individual data segments from cohesive scanned set of multiple objects. The segmented data set can be effectively used for subsequent shape analysis, such as surface modeling or pattern recognition. This approach is inspired by, but is not similar to the work by Zhan et al. [19]. It uses a robust HSV color model and works directly on points. Further, no assumption regarding the surface properties is imposed on the scanned data. The extracted clusters are refined by investigating spatial proximity using fixed distance neighbors (FDNs) and region growth approaches of the point data set. This process removes the outliers and thus improves the accuracy of the extracted data clusters.
III. 3DSCANNING OF BUILDING INTERIORS
A typical range scanning process for building interiors generates a large, cumulative data set representing multiple objects. Such range scanning and subsequent post-processing strategies for speed-intensive applications have the following application specific needs:
A. Scan Planning and Data Density
The point data set captured in building interior applications is normally huge and it requires fast visualization and post-processing tools for reliable information extraction. Direct point-based visualization and editing approaches [1, 20] are quite fast and effective as they do not require expensive intermediate surface re-modeling. These approaches use points and their corresponding approximated normals for creating accurate virtual reality environments. A consistent data density is an absolute necessity for robust implementation of these point based methodologies. However, the captured data density varies based on its distance from the scanner. Thus, accurate, feature-based scan planning must be devised to generate a sufficiently dense point cloud data set during the shape capturing process for effective visualization and reliable information extraction in subsequent post-processing stages.
B. Data Handling and Simplification
The large size of the captured data demands efficient simplification or segmentation strategies that work in conjunction with other information extraction processes. In case of building interiors, the post processing strategies must take into account the geometric complexity and shape diversity of the of the scanned features. All these post-processing strategies must minimize the computation of additional parameters in order to reduce the overall implementation cost. Ideally, these strategies should work directly on points. Further the data must be segmented into the clusters with least data compression so that shape features can be preserved for subsequent surface modeling, if required.
C. Point Data Processing
The main objectives of point data processing for building interiors include (a) extracting desired geometric feature information and (b) segmenting the object’s data for better scene understanding and subsequent processing. A complete surface model extraction is neither helpful, nor required in this case [11] as the points represent cohesive data of multiple objects. Instead, certain specific geometric information such as building layouts, section areas, interior volumes, region clusters, and interior object identification are of major importance. Authors have already developed a direct point-based layout extraction methodologies [21] for point data sets of occupied building interiors. This present paper proposes another post-processing methodology that works directly on points and extracts unified clusters from colorized point data sets without computing additional geometrical parameters.
IV. COLOR BASED DATA CLUSTERING ALGORITHM
The proposed methodology identifies object clusters from the scanned data set by using a color-based segmentation and subsequent cluster refinement approach. Initially, the colored
data set is generated by mapping the 3D scanned data to its corresponding colored images as explained below:
A. Colored Image Mapping
A FARO® laser scanner (LS880) captures the spatial
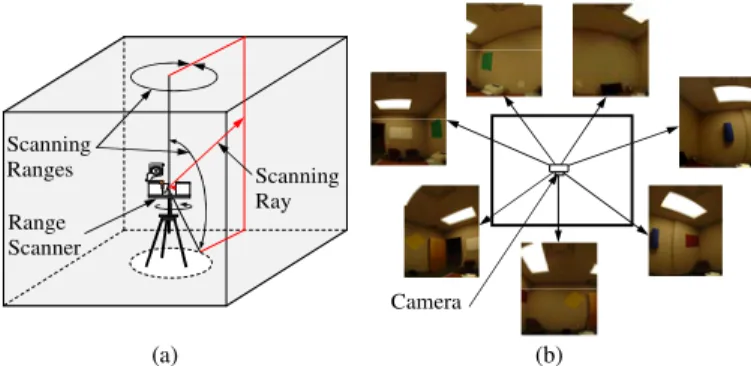
geometry of building interiors. A scanner-mounted Nikon D70 digital camera captures the color information in the form of multiple, wide angle images of the scanned scene such that the pictures and the range images are perfectly aligned. A movable mechanism (Figure 1) helps in synchronizing the coordinate systems of these two shape capturing systems. Figure 2 shows (a) a schematic room scanning set-up and (b) a set of colored images taken by a scanner-mounted camera. The captured data points are mapped to its panoramic colored image at the optical plane. The RGB color values from the pixels are assigned to their mapped scanned points (XYZ). Thus, the resultant data characterize the spatial position and its color.
Coordinate Offset Image Position Scanning Position Tripod Revolving Mirror Laser Mounting Bracket
Figure 1. (a) Range scanning and (b) Colored image capturing positions of the FARO ® scanner.
Scanning Ray Scanning Ranges Camera Range Scanner (a) (b)
Figure 2. (a) A typical scanning scheme of building interiors (b) A schematic represention of color images captured by the bracket mounted camera.
Primarily, the scanned data density defines the geometric accuracy and governs the level of detail of the overall shape capturing process. The color parameter only enhances the information associated with these captured point. Thus, generating an initial, dense point cloud data set is an absolute necessity for accurate post-processing.
B. Point Cloud Clustering
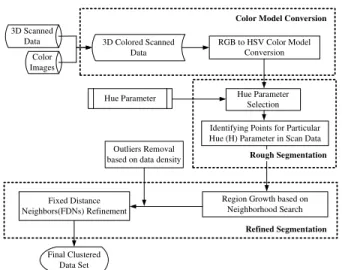
The proposed clustering methodology has three main steps (a) color model conversion (b) rough cluster extraction using color attributes and (c) cluster refinement using FDNs and region growth as shown in Figure 3.
3D Scanned Data Color Images RGB to HSV Color Model Conversion Hue Parameter Selection
Region Growth based on Neighborhood Search Identifying Points for Particular Hue (H) Parameter in Scan Data
Fixed Distance Neighbors(FDNs) Refinement
Outliers Removal based on data density
Final Clustered Data Set
Hue Parameter 3D Colored Scanned
Data
Color Model Conversion
Rough Segmentation
Refined Segmentation
Figure 3. An overview of the proposed color-based clustering methodology. 1) Colour Model Conversion (RGB to HSV): The RGB
color model (Figure 4(a)) is extensively used in display devices but it does not support a robust color segmentation strategy due to (a) high correlation among its three color sub-spaces and (b) its dependency on intensity parameters [18]. Zhan, [19] has used RGB based segmentation strategy, which generates over-segmented data sets and subsequent region growth and merging strategies were reguired to refine the segmentation results. Further, a unified RGB colored model (Figure4(a)) does not facilitate an intuitive seed selection methodology. Thus, this RGB color model is converted into a more efficient HSV color model (Figure 4(b)).
Gra y
(a) (b) Figure 4. (a) RGB color model cube (b) HSV color model cone.
The basic color in the HSV model is characterized by its Hue (H) parameter (Figure 4(b)), whereas, the Saturation (S) and Value (V) represent variations of the same Hue. Thus, the points can be clustered based in their Hue similarity, which reduces the segmentation complexity due to fewer discriminating parameters. This HSV-based segmentation strategy handles the usual limitations of RGB color model effectively and facilitates a robust segmentation approach. Algorithm 1 describes the steps used to achieve the desired color model conversion for each point.
2) Rough Data Clustering: This initial stage extracts data
clusters that corresponds to a specific hue range with limited deviation span. The points are grouped together into a cluster if their Hue deviation (ΔH) is within a permissible limit. A
point data saturation parameter (Sr), control the data extraction
process based on an allowable hue deviation value as
compiled in Algorithm 2. The saturation parameter (Sr) is
defined as a ratio of the increase in number of extracted points to the cummulative extracted points in the previous stage.
Algorithm 1: RGB to HSV Color Model Conversion
Input : RGB Value (0-255) Normalize RGB values from 0-1
norm_R=(R/255); norm_G=(G/255);norm_B = (B/255); Compute: Maximum and Minimum Normalized Value Norm_Min=min(norm_R,norm_G,norm_B ) Norm_Max = max( norm_R, norm_G, norm_B )
del_Max = Norm_Max - Norm_Min Initalize: Value (V) = Norm_Max
if (Norm_Max = 0) H = 0º; S = 0;
else S = del_Max / Norm_Max for Hue (H)
Case 1: Norm_Max = norm_R
H = 60*((norm_G – norm_B)/del_Max) Case 2: Norm_Max = norm_G
H = 60*((norm_B – norm_R)/del_Max) Case 3: Norm_Max = norm_B
H = 60*((norm_R – norm_G)/del_Max) end for if H < 0 H = 360° + H end if end if
Algorithm 2: RGB to HSV Color Model Conversion
Input : Point cloud data with color info ( i, j, X,Y,Z,H,S,V) Main Hue values in data set (H1,H2,H3...Hn)
Permissible Hue Array (ΔH1, ΔH2, ΔH3, …… ΔHm,)
Define: Cluster for H = CH; Point with Hue H = pH; NH=0;
nH =size(CH)=0; $PrevnH= 0; Sr=0.03; $Prev ΔH=0;
for each Hue Seed H, Do pH →
add
CH ; nH=size(CH)
for k = 1 to q
for each point (pq)
if 2 H Δ H ≤ 2 H Δ -H ij k k + ≤ H ; pH → add CH; nH= nH+1; end if end for
Checking the Data Saturation Condition
if -$Prev ≥ ∑ H N H H n n S r $Prev nH= nH; NH = NH+nH; $Prev ΔH= ΔHm; nH = 0; Continue; else Break; end if end for end for
return Updated Cluster CH
Hence, this approach first extracts rough, under-segmented clusters for specific Hue sub-space, which not only gives an initial guess of the interior object shapes but also provides an intuitive means of selecting seed points for subsequent extraction of refined and accurate clusters.
3) Refined Clustering: The rough clusters for a particular
Hue represent two type of data sets (a) Outliers or spurious data and (b) Rough object clusters. In this refinement stage, spurious data and outliers are removed and object’s clusters are refined. This refinement is achieved using a robust region growth aproach with fixed distance neighbours investigation (algorithm 3). A FDNthreshold defines the minimum number of
points required within a pre-computed fixed average distance (FDAvg.) based on average data density. The data cluster is
extracted by searching neighboring points within a fixed distance (m•FDAvg.) that ensures that the expansion process
have sufficient marching seeds to extract large clusters. FDNthreshold is also used to compare the data density and
detecting outliers. The points with the least neighbouring point count are defined as outliers and are removed. Then, the region growth approach extracts high density data clusters through region growth based on their spatial proximity and hue parameter similarity.
Algorithm 3: Refined Segmentation using FDNs
Input : Rough Data Clusters [CH] for Hue [H], FDNthreshold; nH=size(CH); Kp-neighboring finding functionΨ (pi) FDNi = no. of FDNs around each point (pi); FDAvg.; m;
Outlier Removal for i=1 to nH
if FDNi ≤ FDNthreshold Remove pi; Update [CH];
end for
Refined Cluster Extraction
for i=1 to size(CH)
pi →
add
[FCH]; pi →
remove
[CH]
Call Function MngCluster (pi, CH)
end for Function MngCluster (pi, CH) {Kpi} Ψ(pi) for j=1 to size{ Kpi } Compute Δpij =(pj-pi) ifΔpij ≥ m•FDAvg.
pj add → [FCH]; pj →add TempArray; pj →
remove
[CH]
else Continue
end for
while TempArray is not empty Do T=TempArray(1)
Delete TempArray(1) ; Call MngCluster (T,CH)
end while Return;
V. RESULTS AND DISCUSSION
A. Experimental Results
The proposed rapid clustering approach is implemented on a colorized data set of (a) a curvature continuous data of round ball with opposite quadrants characterized by the same color and (b) an office interior environment involving multiple objects and few colored sheets on the walls. Figure 5 shows the results of extracted clusters from the ball data (m=1.5, H=120º and 240º) and Figure 6 and 7 shows the rough and refined clusters of the room scanned data (H= 0º, 120º, and 240º, m=2,
FDAvg.=1.5cm, FDNthreshold=5, Sr=3%), which are extracted
from the office scan data using color based rough clustering and subsequent refinement by spatial proximity investigation using FDNs, respectively. The wall data is not shown in Figure 7 to enhance the visual clarity.
Figure 5. Point cloud clustering results of a colored ball (a) Colored ball surface (b) point cloud data of the ball and its segmented results using the
proposed algorithm based on (c) green (d) blue hue parameter.
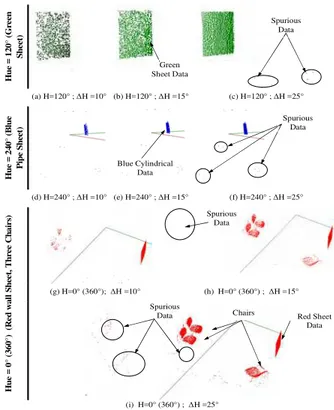
(i) H=0° (360°) ; ΔH =25° H u e = 1 20° ( G re en She e t) (a) H=120° ; ΔH =10° (b) H=120° ; ΔH =15° (c) H=120° ; ΔH =25° H u e = 2 40° ( B lu e Pi pe Shee t) (d) H=240° ; ΔH =10° (e) H=240° ; ΔH =15° (f) H=240° ; ΔH =25° H u e = 0 ° ( 360° ) ( R e d w al l Shee t, Thre e C h a ir s) (g) H=0° (360°); ΔH =10° (h) H=0° (360°) ; ΔH =15° Spurious
Data Chairs Red Sheet Data Spurious Data Spurious Data Spurious Data Green Sheet Data Blue Cylindrical Data
Figure 6. Point cloud clustering results of a room scan using the proposed algorithm for (a–c) Green (d-f) Blue and (g-i) Red hue with corresponding
clustering parameters.
Chairs Data Spurious Data in dark region with open door
Table Data
Colored Sheet Data
Figure 7. Refined interior clusters, extracted using the proposed region growth and FDN investigation (m=2; Sr=3%, FDAvg=1.5cm.)
(a) Original ball surface
(b) Ball point cloud data
(c) Segmented data set
B. Discussion
The proposed methodology extracts unique data clusters based on a robust HSV color model. Initial rough clusters, extracted with a large permissible variation in hue component (20-25º), and followed by a concise cluster refinement using restricted FDNthreshold, parameters is an effective cluster
extraction approach. A multiple factor (m) of 1.5-2 extracts large homogeneous clusters. Further, unique data clusters can be extracted even from curvature continuous regions (quadrants, Figure 6) and from geometrically consistent data set (color sheets from walls, Figure 7). It is also observed that outliers or spurious data points are often extracted at regions with low color saturations and are difficult to identify. However, such color inconsistencies can be handled effectively (Figure 7) in the refinement stage using robust region growth approach with FDNs. The extracted data set represents objects which may be further segmented based on geometrical properties if required for reverse engineering. However, here the main objective was to extract rapid clusters for quick visualization and scene understanding and the proposed approach can be effectively used for such applications. In future, the robustness of the proposed methodology will be improved by combining the color parameters with other adaptive, geometry-based constraints.
VI. CONCLUSIONS AND FUTURE WORK
A rapid two-stage, color-based clustering algorithm is presented that can accurately extract contiguous object surfaces directly from a colorized 3D point cloud data for fast virtual reality applications. A robust HSV color model is initially used to perform a rough segmentation based on the hue component of the data points. A point data saturation criterion is used to control the data clustering at this stage. A non-recursive fixed
distance neighbors strategy then removes the outliers and refines the extracted clusters using a region growth approach. This methodology has been successfully demonstrated on a building interior environment involving multiple objects. The pure point-based approach can extract individual clusters for different objects in the scanned scene, even from geometrically consistent regions. Further, the region growth approach can control the segmentation level and can extract unified clusters for objects or their individual surfaces. The proposed segmentation algorithm presents a fast data segmentation strategy, but lacks the robustness in handling points with very low color saturation. Thus, the future work will focus on improving the robustness of this approach by exploring other perceptive color models and geometric features. The authors are also trying to incorporate shape hierarchy into the clustering approach for extracting an adaptive data clusters based on their spatial complexity.
ACKNOWLEDGMENT
This work has been supported, in part by the Natural Sciences and Engineering Research Council of Canada. The authors also acknowledge the support of the National Research Council of Canada, London, Ontario, Canada.
REFERENCES
[1] L. Linsen, "Point cloud representation," University of Karlsruhe, Germany Technical Report, Faculty of Informatics, 2001.
[2] T. Fan, G. Medioni, and R. Nevatia, "Segmented description of 3D surfaces," IEEE Transactions on Robotics and Automation, vol. 3, pp. 527-538, 1987.
[3] A. D. Sappa and M. Devy, "Fast range image segmentation by an edge detection strategy," in Third International Conference on 3-D Digital
Imaging and Modeling, 2001, pp. 292–299.
[4] M. A. Wani and H. R. Arabnia, "Parallel edge region-based segmentation algorithm targeted at reconfigurable multiring network,"
Journal of Supercomputing, vol. 25, pp. 43–62, 2003.
[5] H.-G. Maas and G. Vosselman, "Two algorithms for extracting building models from raw laser altimetry data," ISPRS Journal of
Photogrammetry & Remote Sensing, vol. 54, pp. 153-163, 1999.
[6] P. Dorninger and C. Nothegger, "3D Segmentation of unstructured point clouds for building modeling," in Photography Image Analysis Munich, Germany, 2007, pp. 196-221.
[7] G. Vosselman and S. Dijkman, "3D Building Model Reconstruction from Point Clouds and Ground Plans," in International Archives of
Photogrammetry and Remote Sensing. vol. XXXIV, 2001, pp. 37-43.
[8] I. S. Chang and R. H. Park, "Segmentation based on fusion of range and intensity images using robust trimmed methods," Pattern Recognition, vol. 34, pp. 1951-1962, 2001.
[9] G. Wang, Z. Houkes, G. Ji, B. Zheng, and X. Li, "An estimation-based approach for range image segmentation: On the reliability of primitive extraction," Pattern Recognition, vol. 36, pp. 157–169, 2003.
[10] X. Ning, X. Zhang, Y. Wang, and M. Jaeger, "Segmentation of architecture shape information from 3D point cloud," in 8th
international Conference on Virtual Reality Continuum and Its
Applications in industry (VRCAI '09.), S. N. Spencer, Ed. Yokohama,
Japan: ACM, New York, NY, 2009, pp. 127-132.
[11] T. Rabbani, F. A. V. Heuvel, and G. Vosselman, "Segmentation of point clouds using smoothness constraints," in International Archives of the
Photogrammetry, Remote Sensing and Spatial and Information Sciences.
vol. 36 Dresden, Germany, 2006, pp. 248-253.
[12] F. Rottensteiner, J. Trinder, S. Clode, and K. Kubik, "Automated delineation of roof planes from lidar data," in ISPRS WG III/3, III/4, V/3
Workshop "Laser scanning 2005" Enschede, the Netherlands, 2005. [13] A. Hoover, G. Jean-Baptiste, X. X Jiang, P. J. Flynn, H. Bunke, D. B.
Goldgof, K. K. Bowyer, D. W. Eggert, A. W. Fitzgibbon, and R. B. Fisher, "An experimental comparison of range image segmentation algorithms," PAMI, vol. 18, pp. 673-689, 1996.
[14] K. Koster and M. Spanin, "MIR: An approach to robust clustering-application to range image segmentation," IEEE Transactions on Pattern
Analysis and Machine Intelligence, vol. 22, pp. 430–444, 2000.
[15] Y. M. Engelberg, A. C. Chavel, U. Stroh, A. M. Weiss, and S. R. Rotman, "Rapid color-based segmentation in digital image processing," in 8th SPIE Meeting on Optical Engineering in Israel: Optoelectronics
and Applications in Industry and Medicine,, 1972, pp. 157-165.
[16] H.-D. Cheng and Y. Sun, "A Hierarchical approach to color image segmentation using homogeneity," IEEE Transactions on Image
Processing, vol. 9, pp. 2071-2082, 2000.
[17] H. D. Cheng, X. H. Jiang, Y. Sun, and J. Wang, "Color image segmentation:advances and prospects," Pattern Recognition, vol. 34, pp. 2259-2281, 2001.
[18] C. Zhang and P. Wamg, "A New Method of Color Image Segmentation Based on Intensity and Hue Clustering," in International Conference on
Pattern Recognition (ICPR), IEEE Computer Society. vol. 3
Washington, DC, USA, 2000, pp. 3617-3623
[19] Q. Zhan, Y. Liang, and Y. Xiao, "Color-based segmentation of point clouds," in ISPRS Laser Scanning Workshop, 2009, pp. 248-252. [20] M. Zwicker, M. Pauly, O. Knoll, and M. Gross, "Pointshop 3D:an
interactive system for point based surface editing," ACM Transactions
on Graphics (TOG), vol. 21, pp. 322-329, 2002.
[21] K. K.Sareen, G. K. Knopf, and R. Canas, "Point cloud simplification and civil building layout extraction from large data-set involving multiple objects," in Proceedings of the 21st IASTED International Conference