Publisher’s version / Version de l'éditeur:
International Journal of Pavement Engineering, 9, March 1, pp. 1-8, 2008-03-01
READ THESE TERMS AND CONDITIONS CAREFULLY BEFORE USING THIS WEBSITE.
https://nrc-publications.canada.ca/eng/copyright
Vous avez des questions? Nous pouvons vous aider. Pour communiquer directement avec un auteur, consultez la
première page de la revue dans laquelle son article a été publié afin de trouver ses coordonnées. Si vous n’arrivez pas à les repérer, communiquez avec nous à [email protected].
Questions? Contact the NRC Publications Archive team at
[email protected]. If you wish to email the authors directly, please see the first page of the publication for their contact information.
Archives des publications du CNRC
This publication could be one of several versions: author’s original, accepted manuscript or the publisher’s version. / La version de cette publication peut être l’une des suivantes : la version prépublication de l’auteur, la version acceptée du manuscrit ou la version de l’éditeur.
Access and use of this website and the material on it are subject to the Terms and Conditions set forth at
Deformation and tracking in bituminous sealants in summer temperatures: pseudo-field behavior
Collins, P.; Veitch, M.; Masson, J-F.; Al-Qadi, I. L.
https://publications-cnrc.canada.ca/fra/droits
L’accès à ce site Web et l’utilisation de son contenu sont assujettis aux conditions présentées dans le site LISEZ CES CONDITIONS ATTENTIVEMENT AVANT D’UTILISER CE SITE WEB.
NRC Publications Record / Notice d'Archives des publications de CNRC:
https://nrc-publications.canada.ca/eng/view/object/?id=6f05376a-cffa-4641-a681-8c61e654cd73 https://publications-cnrc.canada.ca/fra/voir/objet/?id=6f05376a-cffa-4641-a681-8c61e654cd73
D e f o r m a t i o n a n d t r a c k i n g o f b i t u m i n o u s
s e a l a n t s i n s u m m e r t e m p e r a t u r e s : p s e u d o
-f i e l d b e h a v i o u r
N R C C - 4 8 6 5 0
C o l l i n s , P . ; V e i t c h , M . ; M a s s o n , J - F . ; A l - Q a d i ,
I .
A version of this document is published in / Une version de ce document se trouve dans: International Journal of Pavement Engineering, v. 9, no. 1, March 2008, pp. 1-8
The material in this document is covered by the provisions of the Copyright Act, by Canadian laws, policies, regulations and international agreements. Such provisions serve to identify the information source and, in specific instances, to prohibit reproduction of materials without written permission. For more information visit http://laws.justice.gc.ca/en/showtdm/cs/C-42
Les renseignements dans ce document sont protégés par la Loi sur le droit d'auteur, par les lois, les politiques et les règlements du Canada et des accords internationaux. Ces dispositions permettent d'identifier la source de l'information et, dans certains cas, d'interdire la copie de documents sans permission écrite. Pour obtenir de plus amples renseignements : http://lois.justice.gc.ca/fr/showtdm/cs/C-42
in Summer Temperatures: Pseudo-Field Behaviour
P. COLLINS† M. VEITCH† J-F. MASSON*† I. AL-QADI ‡
†Institute for Research in Construction, National Research Council of Canada, Ottawa, ON, K1A 0R6, Canada
‡Illinois Center for Transportation, University of Illinois at Urbana-Champaign 205 N Mathews MC-250, Urbana, IL 61801, USA
* [email protected]; tel +1 613 993 2144; fax : +1 613 952 8102 Abstract
The bituminous sealants used in the maintenance of roadways sometimes fail due to the excessive deformation or flow under the shearing action of tires in summer temperatures. To address this issue, a small-scale tracking test was developed and applied to twenty-one sealants held at temperatures between 46°C and 82°C, typical temperature maxima in North America. The results indicate that sealant shear deformation increase linearly or non-linearly with temperature, and that above a temperature threshold, sealants deform excessively and track. The tracking temperature is readily identified. Some sealants tracked at fairly low temperatures, 46°C to 64°C, but most sealants only tracked at 76°C or beyond. It is concluded that the tracking temperature may be a suitable specification parameter to assist in the selection of sealants with resistance to tracking.
1. Introduction
Bituminous sealants are most often used in the preventive maintenance of flexible pavements (Chong, 1990; Smith and Romine, 1999; Masson et al. 2003). Ideally, sealants would perform their function of waterproofing the pavement surface for more than a decade (Masson et al, 2005), but sealants sometimes fail prematurely. In hot weather, sealants can fail by tracking or by shear deformation in the wheel path. Tracking entails the running of sealants over a meter or two and it is for the most part limited to freshly applied sealants (Masson, 1992). In contrast, shear deformation entails a deformation of a few centimeters over several months or years (Marino, 1995). Currently, sealant deformation is measured by a flow test that poorly represents field conditions (Masson et al., 2006). For tracking and shear deformation to be properly addressed in a specification, their extent and variation with temperature must first be documented. Ideally, this tracking and deformation would be measured in the field, but such measurements are time consuming, expensive, and require traffic control. In addition, the field variables are difficult to control (Masson et al, 2006).
To address sealant deformation quickly and inexpensively, the French Rut Tester was tested unsuccessfully, but a small-scale tracking test showed more promise (Masson et al., 2006). Here, we report on the use of this tracking test to assess the propensity of sealants to deform and track under the shear of a rubber wheel between 46 °C and 82°C, thus providing data on pseudo-field behaviour in a range of summer temperatures typical of North America.
2. Experimental
2.1 Small scale tracking test
A Portland Cement Concrete (PCC) disc with a rout of sealant through its diameter was placed on a Taber abraser (Masson et al. 2006, ASTM D4060) where a wheel covered with a rubber band rotated over the sample in a circular path under a load of 250 g and a radius of 45 mm (figure 1). This test was applied to twenty-one sealants available throughout North America. All sealants were purported to meet or exceed the ASTM D1190 or D3405 specifications. The test temperatures were 46ºC, 52ºC, 58ºC, 64ºC, 70ºC, 76ºC, and 82ºC, the maximum pavement temperature in various North American locations as expressed in the performance grading of asphalt binders, i.e., ASTM D6373.
[Insert figure 1 about here]
2.2 Sample preparation
A sample consisted of a PCC disc with a sealant in a rout. The disc measured approximately 100 mm in diameter and 13 mm in thickness, and the rout was 10 mm wide and 5 mm deep. To prevent the sealant from flowing off the disc when hot, cloth tape was applied on the circumference of the disc. The sealant was heated to about 185 ºC in a tin can and poured into the rout in one slow pass to prevent the entrapment of air bubbles. The rout was filled until the sealant rose just above the surface of the disc. The sealant was left to cure for 7 days. The excess sealant was removed by means of a heated
blade, so that the sealant was flush with the disc surface. To mimic field conditions, the sealant was covered with a fine layer of cement dust that prevented excessive tackiness.
2.3 Test procedure
Each sealant was subject to 15 cycles of the wheel circling the disc near the perimeter at about 60 rpm. To control the temperature, the Taber abraser was placed in an oven. During the test, the temperature of the sample was monitored using another sample with a thermocouple embedded in the sealant. The tracking test was performed when the thermocouple showed T ±0.4ºC, where T was the sought temperature. The sample was left in the oven no longer than 15 minutes after it had reached the sought temperature. The wheel was changed as needed, to prevent the buildup of sealant on the rubber band, the need for which increased with temperature.
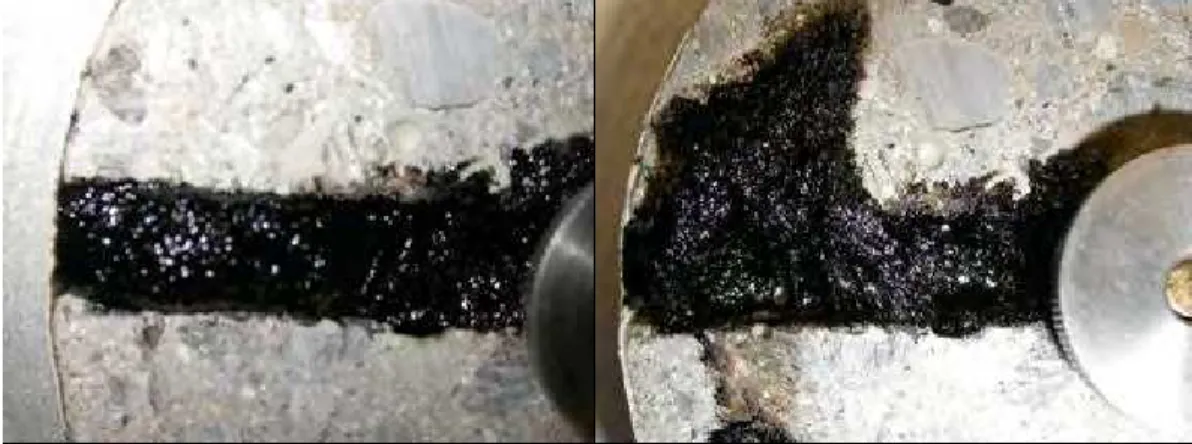
After the sealant had been subjected to the test, the shear deformation was measured perpendicularly to the rout with a micrometer. Figure 2 shows the deformation of a sealant at 70ºC. The average deformation length of a sealant at a particular temperature was obtained by taking the arithmetic mean of four measurements – two measurements from each duplicate. The temperature at which a sealant tracked was also noted. A sealant was considered to track when >75% of the wheel path was covered with sealant (figure 3).
[Insert figure 2 about here] [Insert figure 3 about here]
3. Results
The shear deformation for the sealants after the tracking tests at various temperatures is found in table 1. There was a great variation in the resistance of the sealants to deform. This is nicely shown in figure 4, for the lowest test temperature of 46ºC. At this temperature the deformation ranged from 0 to 5.9 mm.
[Insert table 1 about here] [Insert figure 4 about here]
Sealant shear deformation often increased with temperature, but the increase was material dependant. For example, both sealant L and G showed little to no deformation at 46ºC, but they showed a >15 mm difference in behaviour at 64ºC (table 1). Over the whole temperature range, sealants differed in their resistance to deformation and they provided either for a linear or a non-linear increase in shear deformation with temperature.
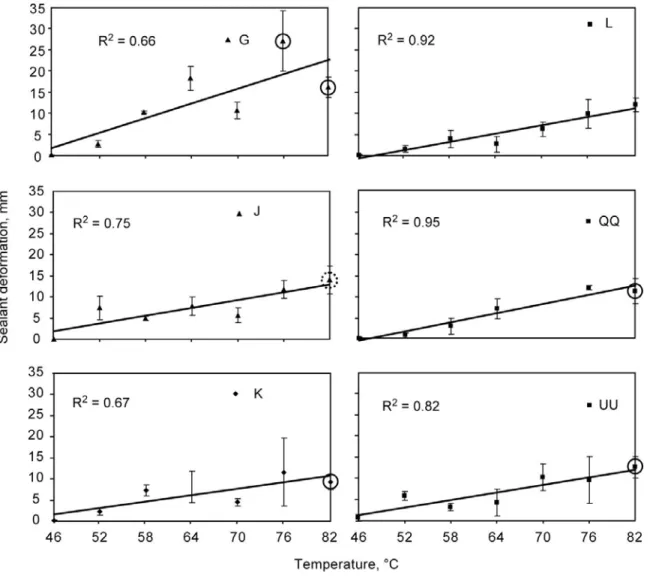
3.1 Linear increase in shear deformation with temperature
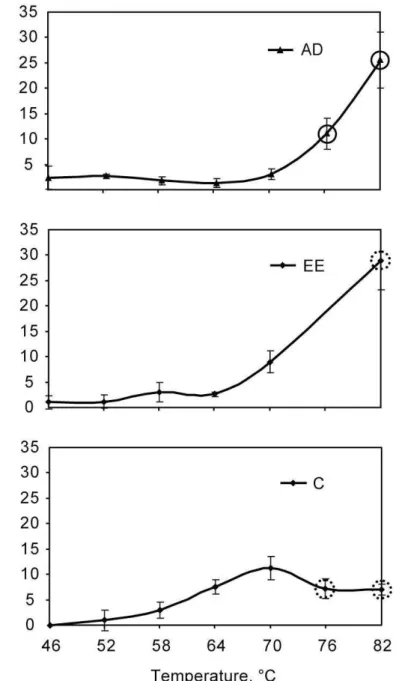
Twelve sealants in twenty-one displayed a linear increase in deformation with temperature. Six sealants showed no deformation at the lowest temperature of 46°C (figure 5). On the graphs, the error bars show the standard deviations, whereas the circles indicate the temperature at which the tracking of the sealant over the concrete disk was observed. A solid circle indicates the tracking over the duplicate samples at a given temperature, whereas a dotted circle indicates the tracking over one sample, bearing in mind the 75 % limit of surface coverage for sealant smearing to be identified as tracking.
[Insert figure 5 about here]
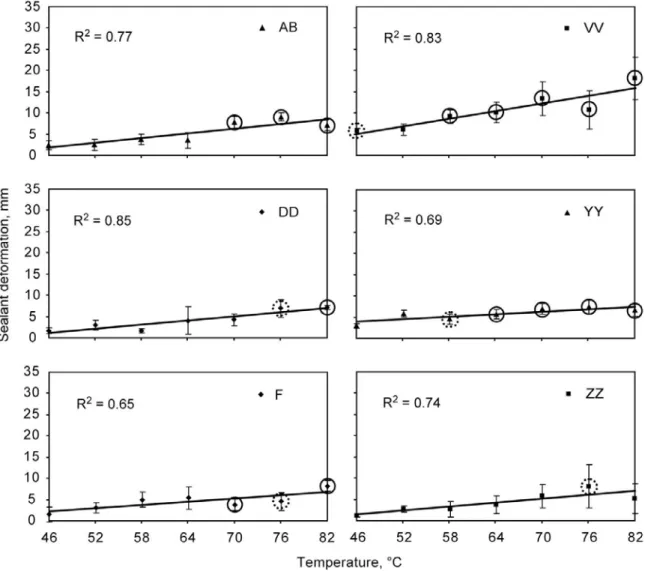
The other six sealants with a linear increase in deformation with temperature showed some tracking at 46°C (figure 6). These sealants would likely have shown no deformation had the temperature been below 46°C. At this temperature of 46°C, the deformation ranged from a low of 1.2 mm for sealant ZZ to a high of 3.0 mm for sealant VV, which showed the greatest deformation of all the sealants in this group, 18 mm at 82ºC.
[Insert figure 6 about here]
The increase in shear deformation with temperature, i.e., the slope or the rate of deformation, varied from 0.1 mm/°C for sealant YY (figure 6) to 0.58°C/min for sealant
G (figure 5), with several sealants with a rate near 0.3 °C/min (table 2). As shown in
figures 5 and 6, the extent of deformation at any temperature was affected by both the level of tracking at 46°C and the rate of tracking. At 82°C, sealants G, J, WW and VV, showed large deformations, with sealant VV showing the largest one of all.
It is noteworthy that the shear deformation of the sealants was not independent of tracking, indicated by the circles in figures. 5 and 6. Sealants YY and VV, with fairly high deformations near 5 mm at 46°C also showed significant tracking at low temperatures. Sealant VV showed tracking at nearly all the temperatures, whereas sealant YY (figure 6) showed tracking at ≥58°C. Sealants AB and F started tracking at 70°C, and all sealants in this group showed tracking at 82°C, except for sealant L.
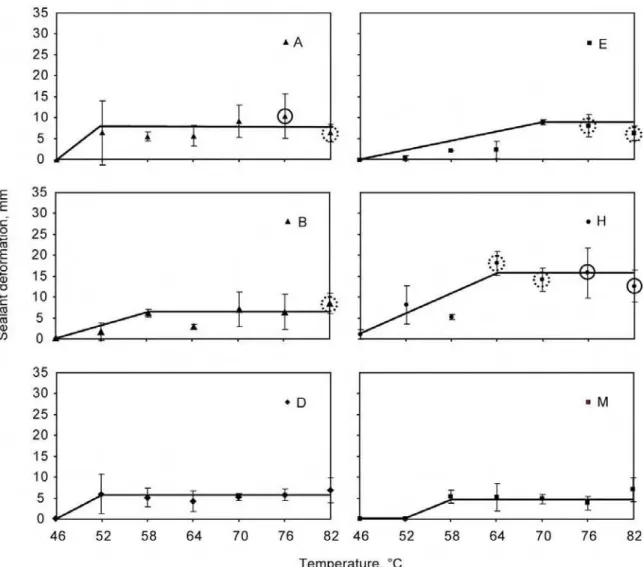
3.2 Non-linear increase in shear deformation with temperature
Six sealants showed a linear increase in shear deformation at low temperatures, before it leveled at a higher temperature (figure 7). Sealants A, B, D, and M all showed deformations below 10 mm at any temperature, and by 52°C or 58ºC their deformation had reached their maximum. The fairly good resistance to shear deformation apparently also led to tracking resistance, as neither D nor M showed any tracking, even at 82°C. The resistance to shear deformation of sealants E and H was similar to those just described, with the difference that the plateau was at a higher deformation or at a higher temperature. Sealant H had a fairly poor resistance to tracking at ≥64°C.
[Insert figure 7 about here]
Sealants AD, EE and C showed other non-linear trends in their shear deformation with temperature (figure 8). Sealants AD and EE were nearly unaffected by temperature of 46°C to 64°C, but their deformation increased very rapidly beyond 64ºC. At 82ºC, their deformation was the highest of all the sealants tested, which also correlated with tracking.
And finally, sealant C showed a trend in shear deformation like no other sealant, but it did show, like many others, tracking at 76°C.
[Insert figure 8 about here]
4. Discussion
The tracking test highlighted two sealant failure modes under pseudo-field conditions: deformation and tracking. The wheel covered with an elastic band of natural rubber was much like a truck tire, which is 65% natural rubber (Rouse, 1997), and the temperatures were those encountered across North America. Of course, there were differences with true field conditions, possibly the most obvious being the difference in the shear forces provided by the circular motion of the wheel and the load applied to the sealant. On this basis, the results of tracking, which affect the very surface of sealants and for which temperature is an important parameter while the load is not as important, may be a more reliable indicator of performance than the shear deformation.
The tracking of sealants was easy to identify and it allowed for sealant differentiation. As shown in table 3, only one sealant tracked at 46°C, another tracked at 58 and 64°C, and the greater the rise in temperature, the greater the number of sealants that tracked. Three sealants did not track at any of the test temperatures, as indicated by >82°C in table 3 Tracking resistance may thus be a promising specification parameter.
The shear deformation under the test conditions also allowed for sealant differentiation. The trends in the resistance to deformation with temperature allowed for the identification of two main groups of sealants, but except maybe for the sudden and rapid rise in deformation of sealants AD and EE past 70°C (figure 8), failure may be more difficult to define in terms of simple shear deformation. As a result, it may be more difficult to define a specification parameter to account for this sealant characteristic.
5. Conclusion
Sealants used to maintain roadways sometimes fail in summer. In an effort to characterize the behaviour of sealants under the shearing action of tires in summer temperatures, a small-scale tracking test was devised, the test temperatures meant to reproduce maxima across North America. The test allowed for the characterization of twenty-one sealants, each of which with a unique behaviour. Sealants could be grouped based on their shear deformation, which either increased linearly or non-linearly with temperature. The temperature at which sealants began to track was also monitored. Some sealants tracked at fairly low temperatures, 46°C to 64°C, but most sealants only tracked at 76°C or beyond. The resistance to tracking was found to be a better criterion to characterize sealants than shear deformation.
References
ASTM D1190. Standard Specification for Concrete Joint Sealer, Hot-Applied Elastic Type, The American Society for Testing and Materials, 100 Barr Harbor Drive, West Conshohocken, PA, USA.
ASTM D3405. Standard Specification for Joint Sealants, Hot-Applied, for Concrete and Asphalt Pavements, The American Society for Testing and Materials, 100 Barr Harbor Drive, West Conshohocken, PA, USA.
ASTM D 4060. Test Method for Abrasion Resistance of Organic Coatings by the Taber Abraser, The American Society for Testing and Materials, 100 Barr Harbor Drive, West Conshohocken, PA, USA.
ASTM D6373 Standard Specification for Performance Graded Asphalt Binder, The American Society for Testing and Materials, 100 Barr Harbor Drive, West
Conshohocken, PA, USA.
Chong, G. J. Rout and seal cracks in flexible pavements: a cost effective preventive maintenance procedure. Transportation Research Record 1990, 1268, 8-16.
Masson, J-F., Crack sealants for asphalt pavements: equipment and application, 1992, report A2016.1 (Institute for Research in Construction, National Research Council Canada, Ottawa: Canada. In French).
Masson, J-F., Boudreau, S., Girard, C., Guidelines for sealing and filling cracks in
asphalt concrete pavement: A best practice, 2003 (National Guide to Sustainable
Municipal Infrastructure, National Research Council: Ottawa, Canada). Available online from: http://www.infraguide.gc.ca
Masson, J-F., Collins, P., Lowery M. Temperature control of hot-poured sealants during the sealing of pavement cracks. Construction and Building Materials 2005, 19, 423–429
Smith K.L. and Romine A. R., Materials and procedure for sealing and filling cracks in asphalt-surfaced pavements: Manual of practice, 1999 (Publication No. FHWA-RD-99-147, Federal Highway Administration: Washington DC).
Masson, J-F., Collins, P., Perraton, D., Al-Qadi, I. Rapid assessment of the tracking resistance of bituminous crack sealants” Canadian Journal of Civil Engineering, submitted for publication (2006).
Marino, J., Hot-pour crack seal annual report, 1995 (Materials Branch, Engireering Services, Street division: City of Vancouver, Canada).
Rouse, R., Crumb rubber modifiers for asphalt pavements. In Asphalt Science and
Captions
Table 1. Mean sealant deformation in mm, and standard deviation (S.D.) Table 2. Linear rates of sealant deformations (mm/°C)
Table 3. Onset temperatures for sealant tracking
Figure 1. Set-up for the small-scale tracking test.
Figure 2. A sealant before (left) and after some shear deformation. PCC disk rotation was counter-clockwise.
Figure 3. Tracking of a sealant at 70°C
Figure 4. Average sealant deformation at 46ºC. The deformation of sealant VV exceeded 3 mm (see Table 1).
Figure 5. Linear increases in shear deformation for sealants without a deformation at 46°C.
Figure 6. Linear increases in shear deformation for sealants with some deformation at 46°C.
Figure 7. Increase in sealant shear deformation up to a plateau.
Table 1. Mean sealant deformation in mm, and standard deviation (S.D.)
Temp. 46ºC 52ºC 58ºC 64ºC 70ºC 76ºC 82ºC
Sealant Mean S.D. Mean S.D. Mean S.D. Mean S.D. Mean S.D. Mean S.D. Mean S.D. A 0.0 0.0 1.6 0.8 5.6 1.1 5.8 2.4 9.3 3.9 15.1 2.1 6.5 2.4 B 0.0 0.0 1.5 2.1 6.0 1.0 2.8 0.6 6.9 4.2 6.3 4.2 8.5 2.4 C 0.0 0.0 1.0 2.0 3.0 1.7 7.7 1.4 11.3 2.3 11.1 6.9 7.1 1.0 D 0.1 0.1 5.8 4.7 5.1 2.2 4.2 2.4 5.1 0.8 5.7 1.4 6.8 3.0 E 0.1 0.1 0.4 0.7 2.3 0.0 2.4 2.1 9.6 0.6 14.2 10.6 6.4 1.7 F 1.8 1.8 3.4 1.2 5.3 1.8 5.7 2.6 4.1 1.4 4.8 2.1 8.5 1.2 G 0.0 0.0 2.7 0.8 10.1 0.2 18.1 2.8 10.5 1.9 26.9 7.1 16.2 2.5 H 1.0 1.1 8.1 4.6 5.2 0.5 18.1 2.8 14.2 2.8 15.8 6.0 12.6 4.0 J 0.0 0.0 7.4 2.8 4.9 0.5 7.8 2.2 5.7 1.8 11.8 2.2 14.0 3.3 K 0.1 0.1 2.2 0.9 7.1 1.4 8.0 3.7 4.3 0.9 11.4 8.0 9.1 1.8 L 0.1 0.1 1.5 0.8 3.9 2.0 2.6 1.8 6.2 1.7 9.9 3.4 11.9 1.6 M 0.1 0.0 0.0 0.0 5.4 1.6 5.2 3.2 4.8 1.2 3.8 1.6 7.0 2.8 AB 2.4 1.1 2.4 1.3 3.7 1.3 3.5 1.8 7.8 1.4 9.0 0.9 7.1 1.3 AD 2.4 2.3 2.7 0.4 1.9 0.8 1.5 0.9 3.2 1.0 11.1 3.0 25.7 5.5 DD 1.8 0.7 3.2 1.2 1.9 0.5 4.2 3.2 4.4 1.4 7.1 2.1 7.3 0.5 EE 1.3 1.4 1.5 1.3 3.3 1.9 2.9 0.4 9.2 2.1 n.d. n.d. 29.1 5.8 QQ 0.2 0.2 1.0 0.6 3.1 1.9 7.2 2.4 n.d. n.d. 12.1 3.0 11.4 3.4 VV 5.9 0.6 6.1 1.3 9.3 1.6 10.3 2.4 13.5 4.0 10.8 4.5 18.2 5.0 WW 1.0 0.8 6.2 1.1 3.5 0.9 4.7 3.2 10.6 3.2 10.0 5.5 13.0 2.6 YY 3.0 0.6 5.9 0.7 4.5 1.2 5.7 1.1 6.9 1.3 7.4 1.7 6.7 1.4 ZZ 1.2 0.4 2.7 0.8 2.7 1.8 3.7 2.1 5.8 2.8 8.1 5.1 5.2 3.5 n.d.: not determined.
Table 2. Linear rates of sealant deformations (mm/°C)
Sealant Rate Sealant Rate YY 0.10 VV 0.30 F 0.13 WW 0.30 ZZ 0.15 J 0.31 DD 0.16 L 0.32 AB 0.19 QQ 0.36 K 0.25 G 0.58
Table 3. Onset temperatures for sealant tracking
46°C 58°C 64°C 70°C 76°C 82°C > 82°C VV YY H AB, DD, F, A, C, E, G, AD, ZZ B, J, K, EE, UU, QQ, D, L, M,
Figure 1. Set-up for the small-scale tracking test.
Figure 2. A sealant before (left) and after some shear deformation. PCC disk rotation was counter-clockwise.
Figure 3. Tracking of a sealant at 70°C. 0 1 2 Sealant deformation (mm) 3 VV YY AD AB DD F EE ZZ UU H QQ M D E L B G J K C A
Figure 4. Average sealant deformation at 46ºC. The deformation of sealant VV exceeded 3 mm (see Table 1).
Figure 5. Linear increases in shear deformation for sealants without a deformation at 46°C.
Figure 6. Linear increases in shear deformation for sealants with some deformation at 46°C.