Publisher’s version / Version de l'éditeur:
Review of Scientific Instruments, 81, 8, pp. 083101-1-083101-8, 2010-07-15
READ THESE TERMS AND CONDITIONS CAREFULLY BEFORE USING THIS WEBSITE. https://nrc-publications.canada.ca/eng/copyright
Vous avez des questions? Nous pouvons vous aider. Pour communiquer directement avec un auteur, consultez la première page de la revue dans laquelle son article a été publié afin de trouver ses coordonnées. Si vous n’arrivez pas à les repérer, communiquez avec nous à PublicationsArchive-ArchivesPublications@nrc-cnrc.gc.ca.
Questions? Contact the NRC Publications Archive team at
PublicationsArchive-ArchivesPublications@nrc-cnrc.gc.ca. If you wish to email the authors directly, please see the first page of the publication for their contact information.
NRC Publications Archive
Archives des publications du CNRC
This publication could be one of several versions: author’s original, accepted manuscript or the publisher’s version. / La version de cette publication peut être l’une des suivantes : la version prépublication de l’auteur, la version acceptée du manuscrit ou la version de l’éditeur.
For the publisher’s version, please access the DOI link below./ Pour consulter la version de l’éditeur, utilisez le lien DOI ci-dessous.
https://doi.org/10.1063/1.3465556
Access and use of this website and the material on it are subject to the Terms and Conditions set forth at
Optical coherence tomography monitoring of angioplasty balloon
inflation in a deployment tester
Azarnoush, Hamed; Vergnole, Sébastien; Bourezak, Rafik; Boulet, Benoît;
Lamouche, Guy
https://publications-cnrc.canada.ca/fra/droits
L’accès à ce site Web et l’utilisation de son contenu sont assujettis aux conditions présentées dans le site LISEZ CES CONDITIONS ATTENTIVEMENT AVANT D’UTILISER CE SITE WEB.
NRC Publications Record / Notice d'Archives des publications de CNRC:
https://nrc-publications.canada.ca/eng/view/object/?id=43091996-87be-4df0-8eff-958bc9736d46 https://publications-cnrc.canada.ca/fra/voir/objet/?id=43091996-87be-4df0-8eff-958bc9736d461
Industrial Materials Institute, National Research Council of Canada, Boucherville, Quebec J4B 6Y4, Canada
2
Centre for Intelligent Machines, McGill University, Montreal, Quebec H3A 2A7, Canada
共Received 18 March 2010; accepted 28 June 2010; published online 2 August 2010兲
We present an innovative integration of an intravascular optical coherence tomography probe into a computerized balloon deployment system to monitor the balloon inflation process. The high-resolution intraluminal imaging of the balloon provides a detailed assessment of the balloon quality and, consequently, a technique to improve the balloon manufacturing process. A custom-built swept-source optical coherence tomography system is used for real-time imaging. A semicompliant balloon with a nominal diameter of 4 mm is fabricated for the experiments. Imaging results correspond to balloon deployment in air and inside an artery phantom. A characterization of the balloon diameter, wall thickness, compliance, and elastic modulus is provided, based on image segmentation. Using the images obtained from the probe pullback, a three-dimensional visualization of the inflated balloon is presented. 关doi:10.1063/1.3465556兴
I. INTRODUCTION
Intravascular optical coherence tomography共IVOCT兲 is a minimally invasive technique that provides detailed cross-sectional imaging of the artery wall. This technology has evolved rapidly in the past few years thanks to the develop-ment of swept-source optical coherence tomography 共SS-OCT兲.1
Many studies2–5 have clearly demonstrated the clinical relevance of IVOCT for the diagnosis of atheroscle-rosis and for monitoring the results of percutaneous coronary interventions.
In the current paper, we propose a novel application of the IVOCT technology, i.e., the monitoring of balloon infla-tion in a balloon deployment tester. A deployment tester is used to test the quality of balloons through inflation under predetermined conditions. Traditionally, it can be equipped with a laser scanner that is used externally to provide mea-surements of the balloon’s outer diameter at a given location. Such assessment, unfortunately, is limited to a side view and a particular angle. Combining IVOCT with a deployment tester allows a full characterization of balloon diameter and wall thickness during the inflation process. Measurements are not limited to a single location but with a quick pullback, the whole balloon can be imaged at a given pressure. Com-bining the computerized balloon inflation provided by the deployment tester with the accurate measurements of IVOCT results in a tool that can benefit many applications. For bal-loon development alone, one can validate balbal-loon perfor-mance, explore new designs, validate balloon deformation models, or extract mechanical properties. The system can be used with a phantom or an excised artery to provide further applications. Not only can one follow balloon inflation with more realistic conditions, one can also obtain a very good
setup to simulate angioplasty procedures with IVOCT moni-toring. This not only benefits balloon manufacturers but also the developers of percutaneous coronary intervention devices and clinical users.
In the following, we present the structure of our optical coherence tomography imaging balloon 共OCTIB兲 catheter and its integration in the deployment tester. Imaging results are provided for balloon deployment in air and inside a phan-tom. We then present a characterization of balloon diameter, wall thickness, and mechanical properties, all obtained from segmentation of OCT images.
II. MATERIALS AND METHODS
In this section, the components and the structure of the optical coherence tomography imaging balloon catheter are described.
A. OCT
OCT is an imaging modality that is now being used in many clinical applications,6 including cardiovascular research.5 It is a nondestructive imaging technique, divided into two categories: the time-domain OCT共Ref. 7兲 and the Fourier-domain OCT 共FD-OCT兲 which itself is further di-vided into spectral domain OCT8,9 and SS-OCT,10–12 also known as optical Fourier domain imaging.13 Measurements in this paper are performed with SS-OCT. We thus briefly review SS-OCT principles and describe our SS-OCT setup.
1. SS-OCT principles
A basic configuration of the SS-OCT setup is presented in Fig. 1. The light coming from the wavelength-swept source is split by an optical coupler into two parts, one of which goes into the reference arm and the other into the sample arm. The light reflected from the reference arm with
a兲Electronic mail: guy.lamouche@imi.cnrc-nrc.gc.ca.
intensity Irand the backscattered light from the sample with
intensity Is are then combined in the coupler to create
inter-ference fringes. Assuming that the sample arm only contains a single reflector, the intensity received by the photodetector is given by
I= Ir+ Is+ 2
冑
IrIscos冋
2
c 共t兲2⌬z
册
, 共1兲 where c is the speed of light,共t兲 is the optical frequency as a function of the time t, and ⌬z is the optical path delay between the two arms of the interferometer. In the presence of many reflectors, Eq.共1兲takes a more complicated form to include a term describing the mutual interference between the reflectors.For a source providing an ideal linear sweep in fre-quency, we have 共t兲 =0+共⌬/⌬t兲t, where 0 is the start
sweep optical frequency and ⌬is the swept bandwidth dur-ing the time interval ⌬t. Most commercial sources for SS-OCT do not provide such an ideal linear sweep, but the non-linearity can be corrected with one of the many techniques found in the literature.14–16
Assuming an ideal linear sweep, the modulation term of the interference fringes is given by
Imod⬀ cos
冉
2 c 0· 2⌬z + 2 c ⌬ ⌬tt· 2⌬z冊
. 共2兲 The amplitude of the inverse Fourier transform of Imod isthen computed 兩F−1关I
mod兴兩 ⬀ 关␦共f − f1兲 +␦共f + f1兲兴, 共3兲
where f1=共2⌬z / c兲共⌬/⌬t兲. The depth information ⌬z is thus
recovered by computing ⌬z =共1 / 2兲c共⌬t / ⌬兲f1.
This simple model illustrates one of the shortcomings of SS-OCT and FD-OCT in general; one cannot distinguish the positive depths from the negative depths. This is referred to as the mirror artifact, which is avoided in our system by placing the sample on one side of the zero-delay position in the sample arm.
2. Experimental SS-OCT setup
We use a custom-built SS-OCT system that operates with a commercial swept source. For this work, we use a wavelength-swept laser source共HSL2000, Santec, Komaki, Japan兲, operating with a sweep rate of 30 kHz and a sweep range of over 110 nm around 1.31 m wavelength to pro-vide a measured axial OCT resolution of about 12 m in air.
The SS-OCT system is configured as a Mach–Zehnder inter-ferometer with balanced detection and is packaged as a mo-bile unit. The setup is presented in Fig.2.
B. Balloon production
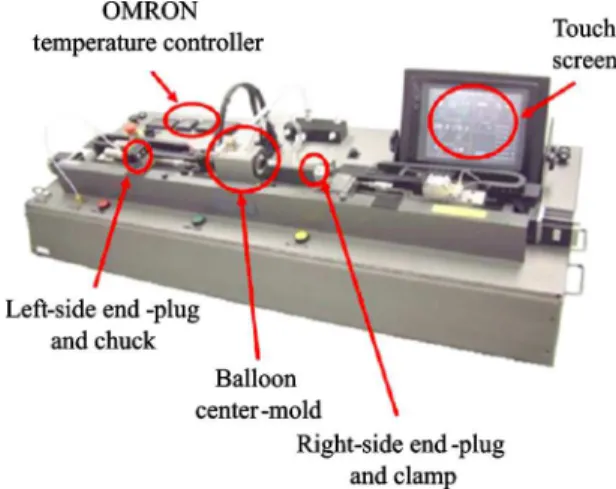
A balloon was fabricated to perform this first investiga-tion of the combinainvestiga-tion of OCT with a balloon deployment apparatus. The balloon fabrication process17 is generally composed of three main phases, i.e., extrusion, double-end stretching, and balloon forming. In the first phase, the aim is to extrude tubing with high concentricity and uniform wall thickness. An extruded polyurethane tube 共Pellethane, 55D, Dunn Industries, Inc., Manchester, NH兲 was used for balloon production. In the usual second phase, i.e., the double-end stretching, both ends of the tube are stretched under high temperature, leaving in the middle an unstretched segment called parison. The polyurethane used in this work is more elastic than other balloon production materials, e.g., Pebax. A large stretch would cause the material to shrink back to its original length. Therefore, this second-phase was skipped and no double-end stretching was performed. In the third phase, the balloon forming is executed through a blow mold-ing process by a balloon-formmold-ing machine共9810H, Interface Catheter Solutions, Laguna Niguel, CA兲, illustrated in Fig.3. In blow molding, the operator places the proximal end of the tube into the chuck on the left side, which is connected to a
FIG. 1.共Color online兲 Basic configuration of a fibered SS-OCT setup 共Cp: coupler, D: detector兲.
FIG. 2.共Color online兲 SS-OCT setup 共Cp1 and Cp2: couplers, PC: polar-ization controller, Cir1 and Cir2: circulators, D: balanced detection, ATU: artery testing unit兲.
FIG. 3. 共Color online兲 The balloon forming machine 共9810-H, Interface Catheter Solutions兲.
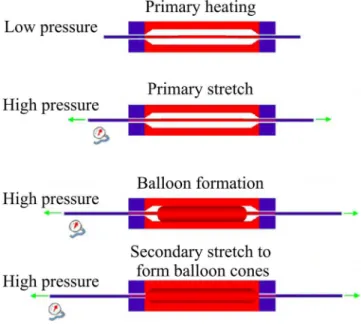
supply of compressed nitrogen. The distal end goes through the center mold and the distal-end plugs. Compressed nitro-gen is blown through the proximal end at a low pressure, while the heater jaws warm up the piece. Different stages of the balloon forming process are demonstrated in Fig.4. Dur-ing the primary heatDur-ing stage, the pressure and temperature are raised, followed by axial prestretching of both ends. The process then enters the primary stretch phase, where both ends are further stretched at a predetermined speed to a specified length. This causes the tube to be extended inside the mold and expanded due to pressure, which leads to for-mation of the balloon. A secondary stretch is applied to form the cones of the balloon on both sides. At the end of the process the mold is cooled down, the pressure is released, and the balloon is ready to be removed from the mold.
Table I presents the values of parameters that we used for different stages of the balloon forming process. The ma-chine advances from each stage to the next, once a user-defined condition on temperature, pressure, etc., is satisfied. The choice of these conditions and the applied stretch, pres-sure, and temperature affect the balloon quality, e.g., wall thickness, mechanical properties, and burst pressure.
The balloon forming process produced a semicompliant balloon with dimensions of共4 ⫻ 15 mm2兲, with an inner
di-ameter of 1.2 mm and an outer didi-ameter of 1.50 mm in the balloon tubing.
C. Structure of the OCTIB catheter
Figure5 illustrates the composition of the OCTIB cath-eter. The IVOCT probe is composed of a single-mode fiber enclosed within a spiral metallic tube in the proximal region and within a polymer tube in the distal region. At the tip of the probe, light is focused by a gradient index共GRIN兲 lens and redirected at 90° by a right-angle prism. The optical components are enclosed in a metallic ferrule. Rotation and translation are ensured by a custom pullback unit. The ferrule is 700 m in diameter but the maximum probe diameter is 800 m at the spiral metallic tube. It rotates in water within a polymer sheath共PS兲. The polymer sheath is used to protect the OCT probe and to prevent it from drifting away from the center of the balloon while rotating. The diameter of the polymer sheath should be close to the diameter of the probe in order to facilitate inclusion of the OCT assembly inside the balloon. On the other hand, it should provide sufficient space to allow the probe to be easily rotated with minimal friction. A heat-shrinkable Teflon tube 关fluorinated ethylene propylene共FEP兲, Zeus, Inc., Orangeburg, SC兴 was chosen to achieve the desired characteristics. Teflon is a suitable mate-rial for this application, since it is translucent and causes small friction. After shrinking, approximate inner and outer diameters of 0.9 and 1.0 mm were, respectively, obtained for the Teflon tube. The probe and its polymer sheath are in-serted into the balloon. Figure 6 provides a cross-sectional view for the proximal tube of the OCTIB catheter. As shown in this figure, the polymer sheath divides the lumen of the balloon catheter into two isolated lumens. The lumen be-tween the polymer sheath and the balloon is allocated to a high-pressure liquid, used for deployment of the balloon. Within the polymer sheath, a low-pressure lumen contains the rotating OCT probe. It was essential to isolate the two lumens; if the high pressure water was allowed inside the
FIG. 4. 共Color online兲 Balloon forming stages.
TABLE I. Balloon forming parameters.
Primary heating
Primary stretch and balloon formation
Secondary stretch
Mold temperature target共°C兲 90 170 175
Pressure共atm兲 5 30 20
Stretch共mm兲 30 35 38
Terminating condition Temperature ⬎80 ° C After 4 s Temperature ⬎150 ° C
FIG. 5.共Color online兲 OCTIB catheter 共B: Balloon, F: ferrule, PS: polymer sheath, GRIN: gradient-index lens, LB: light beam, OF: optical fiber, PT: polymer tube, RAP: right-angle prism兲.
polymer sheath, it would be necessary to entrap it with a tight sealing at the proximal end. This could restrict or ham-per the probe motion. The two-lumen approach revealed to be an efficient solution. In Sec. II D, we describe how both lumens are connected to their respective low-pressure and high-pressure lines.
D. OCTIB catheter in the computerized balloon deployment setup
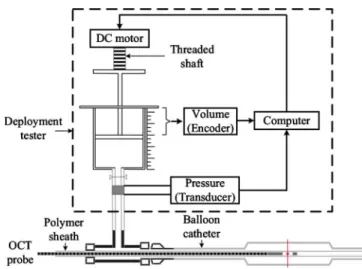
Percutaneous coronary intervention is usually performed using a manual inflation device monitored by a pressure gauge. However, in order to quantify, record, and analyze the measurements, we use a computerized deployment setup which is based on a hydraulic pressure tester共Interface Cath-eter Solutions, model PT-3070, Laguna Niguel, CA兲. Figure
7 illustrates the experimental setup, used to deploy the bal-loon. This setup allows for programming customized infla-tion and deflainfla-tion cycles. In our experiments, water was used as the pressurization medium. A dc motor drives a syringe plunger, which delivers the deployment volume. The position of the plunger, measured by an encoder, corresponds to the amount of the delivered volume. A transducer measures the pressure. Based on these real-time measurements, a com-puter commands the motor to achieve a desired pressure. The OCT probe and the polymer sheath are introduced into the
balloon tube using a T-connector as shown in Fig. 7. This connector also provides a connection between the deploy-ment tester and the high-pressure lumen, delimited by the polymer sheath and the balloon.
III. RESULTS
In this section, we first present images and movie clips obtained from real-time monitoring of balloon inflation un-der various conditions. This provides a qualitative demon-stration of the new opportunities provided by the combina-tion of IVOCT with a balloon deployment tester. We then present a more quantitative assessment of balloon inflation by extracting balloon diameters and thicknesses at various pressures. These data are of high interest for balloon design. An example of the use of such data is provided by extracting mechanical properties of the balloon material.
A. Real-time imaging results
Imaging results correspond to balloon deployment both in air and inside an artery phantom. A frame rate of 20 frames per second共fps兲 was selected for image acquisition. The pressure values represent the pressures relative to the atmospheric pressure.
1. Balloon deployment in air
Figure 8 illustrates a photography of the of the OCT probe within an inflated balloon in air. Although imaging is performed with infrared light, we include red light in the system to locate the measurement region visually. Red light departing the OCT probe is clearly visible in Fig.8. Figure9
presents a movie clip made from an OCT monitoring of the
FIG. 6. Cross-section of the OCTIB catheter共proximal side兲.
FIG. 7. 共Color online兲 The balloon deployment setup.
FIG. 8. 共Color online兲 Photo of the inflated balloon.
FIG. 9. Balloon inflation in the air from a negative pressure to a positive pressure of 2 atm. Frame rate is 20 fps. Markers represent 1 mm in optical thickness共enhanced online兲.关URL: http://dx.doi.org/10.1063/1.3465556.1兴
balloon inflation at a single location from a negative pressure to a positive pressure of 2 atm. Some artifacts, such as the one at nine o’clock position, appear in the images. They are due to deflection and reflection of light at the air-balloon interfaces. To perform cross-sectional imaging at different locations along the axis of the balloon, a pullback of the OCT probe can be performed. Figure 10 presents a movie clip obtained from a motorized pullback at a speed of 2.5 mm/s at an inflation pressure of 4 atm, giving a 125 m step between two successive cross-sectional images. The pullback was performed from the tube distal to the balloon to the tube proximal to the balloon. A pullback makes it pos-sible to carry out a volumetric assessment of the balloon at different pressures and check the homogeneity of the balloon deformation along the longitudinal axis. Combination of the obtained tomographic images can provide a three-dimensional view of the balloon which is presented as a movie clip in Fig.11. This figure depicts the balloon, inflated at a pressure of 4 atm. The three-dimensional共3D兲 view is composed of 200 cross-sectional frames.
2. Balloon deployment inside an artery phantom
This subsection presents imaging of the balloon inside a custom-built optical phantom.18The phantom is composed of three layers with different optical scattering and optical at-tenuation properties. These layers simulate the layers of the coronary artery, namely, intima, media, and adventitia. The
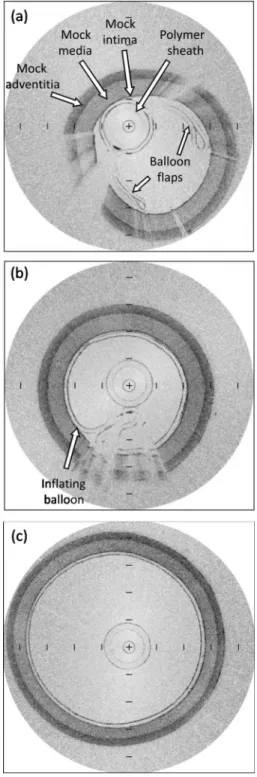
phantom also has relevant mechanical properties in the low deformation regime. Figure12illustrates OCT images of the balloon inside the phantom at different pressures, i.e., a negative pressure, 0 and 4 atm. The nominal diameter of the balloon is higher than the inner diameter of the phantom. Therefore, prior to insertion, the balloon is manually folded. The balloon folding in the form of flaps in Fig.12共a兲and the balloon folding during inflation in Fig.12共b兲 are visible. In Figs.12共a兲and12共b兲, some segments of the phantom image
FIG. 11.共Color online兲 3D rendering of the balloon, obtained from a pull-back at a pressure of 4 atm 共enhanced online兲. 关URL: http://dx.doi.org/ 10.1063/1.3465556.3兴
FIG. 10. Motorized pullback inside the balloon at an inflation pressure of 4 atm. Frame rate is 20 fps. Markers represent 1 mm in optical thickness 共enhanced online兲.关URL: http://dx.doi.org/10.1063/1.3465556.2兴
FIG. 12. Real-time imaging of balloon deployment inside an artery phan-tom. Frame rate is 20 fps. Markers represent 1 mm in optical thickness.共a兲 OCT image of the folded balloon inside the phantom at a negative pressure. 共b兲 OCT image of the inflating balloon inside the phantom at a pressure of 0 atm.共c兲 OCT image of the inflated balloon inside the phantom at a pres-sure of 4 atm.
are distorted due to the deflection of light in some folded parts of the balloon. When the balloon is dilated at a pressure of 4 atm 关Fig. 12共c兲兴, the phantom can be viewed without such distortions. Figure13presents a movie clip of the bal-loon inflation inside the phantom from a negative pressure to a pressure of 3 atm.
B. Characterization of the balloon diameter, wall thickness, and mechanical properties
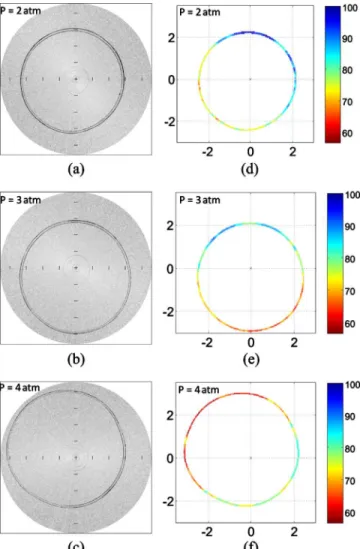
In this section, we present an application of our setup in a quantitative assessment of the balloon quality. Figure 14
presents cross-sectional images of the balloon at pressures 共P兲 of 2, 3, and 4 atm. Each OCT image 关Figs.14共a兲–14共c兲兴 is coupled with a deformation profile 关Figs. 14共d兲–14共f兲兴, which provides a detailed analysis of balloon diameter and thickness at different angles. In order to obtain these defor-mation profiles, the first step is to perform image segmenta-tion to obtain the coordinates of the points, which delimit the two surfaces of the balloon. The algorithm is based on the fact that these surfaces in a typical A-scan correspond to two adjacent single-lobe distributions. The segmentation algo-rithm detects the peaks of these two distributions to localize the inner and outer balloon surfaces. Cubic B-splines19 are then used to connect the detected positions for both surfaces, which result in two smooth curves representing the inner and outer surfaces. Raw OCT images provide measurements with a length scale in optical thickness, i.e., the product of geo-metrical distance and refractive index. The next step is thus to carry out adjustments to achieve scales that represent real distance values. The markers in the OCT images in Figs.
14共a兲–14共c兲represent 1 mm in optical thickness. The imag-ing is performed in water. Results in Figs. 14共d兲–14共f兲 are given in true geometric dimension after correcting for refrac-tion and converting optical length to geometrical length with the various refractive indices. The final step is to obtain a color map to differentiate visually between segments with varying thickness. The underdeployed segments are closer to the center of the balloon and generally have a larger wall thickness. These segments are depicted in blue. The overde-ployed segments, on the other hand, are farther from the
center and generally possess a smaller wall thickness. These segments are depicted in red. The thickness values repre-sented next to the color map in Figs.14共d兲–14共f兲are calcu-lated in micrometers.
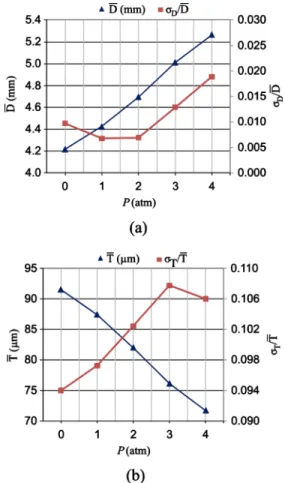
An overall assessment of the balloon diameter and thick-ness at different pressures is presented in Fig.15. As shown in Fig. 15共a兲, the average value of diameter over different angles increases from 4.2 mm at a pressure of 0 atm to 5.3 mm at a pressure of 4 atm. Figure15共a兲also depicts the ratio of standard deviation of the diameter共D兲 to its average
共D¯ 兲, which can be helpful in characterizing deployment sym-metry. This ratio increases as pressure increases from 1 to 4 atm. This is consistent with the fact that the balloon is deployed more asymmetrically at larger pressures 关Fig.
14共f兲兴. The ratio decreases as the pressure increases from 0 to 1 atm. The reason is that at a pressure of 0 atm, the balloon is not fully deployed to a round shape. Therefore, at a pres-sure of 0 atm, the diameter variation at different angles is larger than the diameter variation at a pressure of 1 atm.
As demonstrated in Fig.15共b兲, the average thickness of the wall decreases from 91.5 to 71.7 m as pressure in-creases from 0 to 4 atm. The ratio of the standard deviation
FIG. 13. Balloon inflation inside the phantom from a negative pressure to a pressure of 3 atm. Frame rate is 20 fps. Markers represent 1 mm in optical thickness共enhanced online兲.关URL: http://dx.doi.org/10.1063/1.3465556.4兴
FIG. 14. 共Color online兲 共a兲–共c兲 OCT images of the balloon at different pressures and共d兲–共f兲 the balloon deformation profiles with the thickness color map in microns. For共a兲–共c兲, frame rate is 20 fps and markers represent 1 mm in optical thickness. For共d兲–共f兲, scales are in millimeters and repre-sent geometric thickness.
of the wall thickness共T兲 to its average 共T¯ 兲 determines the
extent to which uniform wall thickness is preserved at differ-ent pressures关Fig.15共b兲兴. The higher the slope of this ratio with respect to pressure, the faster the balloon approaches its burst pressure. Figure15共b兲 reveals that the wall thickness becomes less uniform when pressure is increased from 0 to 3 atm, a trend that stops when the pressure is further in-creased from 3 to 4 atm.
In order to characterize the mechanical properties of the balloon, we estimate its compliance and modulus of elastic-ity. We define the compliance of the balloon as the variation of its volume with respect to its internal pressure. We assume that the cross-sectional area does not vary significantly in the axial direction. By measuring variation of cross-sectional area with respect to pressure, a normalized-over-the-length value will be obtained for compliance. Figure16共a兲 demon-strates the cross-sectional area A at different pressures. The area is obtained by summation of surface area of all tri-angles, formed by the center and each two adjacent nodes on the inner surface of the balloon. Since the balloon is not under pressure at 0 atm, the corresponding point is elimi-nated in estimation of the compliance. A normalized compli-ance of 2.35 mm2/atm is calculated using linear regression. One of the goals of the balloon forming process is to increase the elastic modulus of the material, which is achieved by heating and stretching of the material resulting in a better molecular orientation. The conducted experiments in this paper can be used to obtain an estimation of the
elas-tic modulus for the produced balloon. The hoop stress is calculated using the equation for thin-walled vessels
=P· r
T , 共4兲
whereis the hoop stress, P is the internal pressure, r is the radius, and T is the wall thickness. Equation共4兲 is valid for 2r / T ⬎ 20. In our experiments, we have 2r / T ⬎ 40. In order to estimate the hoop stress, we replace in Eq.共4兲
r= D¯ /2,
共5兲 T= T¯ .
The strain at each pressure is defined as
=l− l0 l0
, 共6兲
where l0is the cross-sectional perimeter of the balloon at the
pressure of 0 atm and l is the cross-sectional perimeter at the corresponding pressure. Figure16共b兲depicts calculations of strain versus hoop stress for the balloon cross-section. An elastic modulus of 0.05 GPa is obtained from linear regres-sion. The elastic modulus for the polyurethane tube that was
FIG. 15.共Color online兲 OCT characterization of 共a兲 balloon diameter and 共b兲 wall thickness.
FIG. 16.共Color online兲 OCT characterization of 共a兲 balloon compliance and 共b兲 elastic modulus.
used to fabricate the balloon is approximately 0.02 GPa. This indicates that after the balloon forming process the elastic modulus has been increased by 150%.
IV. CONCLUSION
We have presented an innovative integration of IVOCT imaging with a balloon deployment setup. The resulting setup allows accurate real-time monitoring of balloon infla-tion under predetermined condiinfla-tions and is a valuable tool to validate and optimize balloon designs. In this paper, based on segmentation of the obtained images, we assessed the bal-loon diameter and wall thickness at different pressures. Such assessment is important in controlling the balloon quality.
Although the focus of this paper was on characterization of the balloon quality, the proposed setup has many more applications. We have demonstrated that it can be used to extract mechanical properties. It can also be used in the velopment of future generation of minimally invasive de-vices for percutaneous coronary interventions. One can monitor balloon inflation within an artery phantom or an excised artery to assess the efficiency of innovative balloon angioplasty or stent deployment procedures.
ACKNOWLEDGMENTS
The authors would like to thank Christian de Grandpré for invaluable technical support and Charles-Etienne Bisail-lon for producing the phantom. We also acknowledge the financial support of the Genomics and Health Initiative of the National Research Council and the financial support of the Natural Sciences and Engineering Research Council of Canada.
1
G. J. Tearney, S. Waxman, M. Shishkov, B. J. Vakoc, M. J. Suter, M. I. Freilich, A. E. Desjardins, W.-Y. Oh, L. A. Bartlett, M. Rosenberg, and B. E. Bouma, J. Am. Coll. Cardiol. 1, 752共2008兲.
2
T. Kume, T. Akasaka, T. Kawamoto, N. Watanabe, E. Toyota, Y. Neishi, R. Sukmawan, Y. Sadahira, and K. Yoshida,Circulation69, 903共2005兲.
3
B. E. Bouma, G. J. Tearney, H. Yabushita, M. Shishkov, C. R. Kauffman, D. DeJoseph Gauthier, B. D. MacNeill, S. L. Houser, H. T. Aretz, and E. F. Halpern, BMJ 89, 317共2003兲.
4
I. K. Jang, G. J. Tearney, B. MacNeill, M. Takano, F. Moselewski, N. Iftima, M. Shishkov, S. Houser, H. T. Aretz, and E. F. Halpern, Circula-tion111, 1551共2005兲.
5
E. Regar, K. A. H. van Leeuwen, P. W. Serruys, and T. G. van Leeuwen,
Optical Coherence Tomography in Cardiovascular Research 共Informa HealthCare, Abingdon, UK, 2007兲.
6
M. E. Brezinski, Optical Coherence Tomography: Principles and
Appli-cations共Academic Press, Burlington, 2006兲.
7
D. Huang, E. A. Swanson, C. P. Lin, J. S. Schuman, W. G. Stinson, W. Chang, M. R. Hee, T. Flotte, K. Gregory, C. A. Puliafito, and J. G. Fujimoto,Science254, 1178共1991兲.
8
A. F. Fercher, C. K. Hitzenberger, G. Kamp, and S. Y. El Zaiat, Opt. Commun.117, 43共1995兲.
9
G. Häusler and M. W. Lindner,J. Biomed. Opt.3, 21共1998兲.
10
S. R. Chinn, E. A. Swanson, and J. G. Fujimoto,Opt. Lett.22, 340共1997兲.
11
B. Golubovic, B. E. Bouma, G. J. Tearney, and J. G. Fujimoto,Opt. Lett.
22, 1704共1997兲.
12
F. Lexer, C. K. Hitzenberger, A. F. Fercher, and M. Kulhavy,Appl. Opt.
36, 6548共1997兲.
13
S. H. Yun, G. J. Tearney, J. F. de Boer, N. Iftimia, and B. E. Bouma,Opt. Express11, 2953共2003兲.
14
C. M. Eigenwillig, B. R. Biedermann, G. Palte, and R. Huber,Opt. Ex-press16, 8916共2008兲.
15
M. A. Choma, K. Hsu, and J. A. Izatt,J. Biomed. Opt.10, 044009共2005兲.
16
S. Vergnole, D. Levesque, and G. Lamouche, Opt. Express 18, 10446 共2010兲.
17
D. Lalli, “Cycle-to-cycle control of the angioplasty balloon fabrication process,” Ph.D. thesis, McGill University, 2006.
18
C.-E. Bisaillon, G. Lamouche, R. Maciejko, M. Dufour, and J.-P. Mon-chalin,Phys. Med. Biol.53, N237共2008兲.
19
C. de Boor, A Practical Guide to Splines共Springer, New York, 2001兲.