Publisher’s version / Version de l'éditeur:
Asphalt Paving Technologists, 76, pp. 275-302, 2007-12-01
READ THESE TERMS AND CONDITIONS CAREFULLY BEFORE USING THIS WEBSITE. https://nrc-publications.canada.ca/eng/copyright
Vous avez des questions? Nous pouvons vous aider. Pour communiquer directement avec un auteur, consultez la
première page de la revue dans laquelle son article a été publié afin de trouver ses coordonnées. Si vous n’arrivez pas à les repérer, communiquez avec nous à [email protected].
Questions? Contact the NRC Publications Archive team at
[email protected]. If you wish to email the authors directly, please see the first page of the publication for their contact information.
Archives des publications du CNRC
This publication could be one of several versions: author’s original, accepted manuscript or the publisher’s version. / La version de cette publication peut être l’une des suivantes : la version prépublication de l’auteur, la version acceptée du manuscrit ou la version de l’éditeur.
Access and use of this website and the material on it are subject to the Terms and Conditions set forth at
A New blister test to measure bond strength of asphaltic materials
Fini, E. H.; Al-Qadi, I. L.; Masson, J-F.
https://publications-cnrc.canada.ca/fra/droits
L’accès à ce site Web et l’utilisation de son contenu sont assujettis aux conditions présentées dans le site LISEZ CES CONDITIONS ATTENTIVEMENT AVANT D’UTILISER CE SITE WEB.
NRC Publications Record / Notice d'Archives des publications de CNRC:
https://nrc-publications.canada.ca/eng/view/object/?id=a6ad6995-2922-469b-8d52-8abb44c49c36 https://publications-cnrc.canada.ca/fra/voir/objet/?id=a6ad6995-2922-469b-8d52-8abb44c49c36
http://www.nrc-cnrc.gc.ca/irc
A N e w blist e r t e st t o m e a sure bond st re ngt h of a spha lt ic m a t e ria ls
N R C C - 4 0 3 2 2
F i n i , E . H . ; A l - Q a d i , I . L . ; M a s s o n , J - F .
D e c e m b e r 2 0 0 7
A version of this document is published in / Une version de ce document se trouve dans:
Asphalt Paving Technologists, 76, pp. 275-302, December 01, 2007
The material in this document is covered by the provisions of the Copyright Act, by Canadian laws, policies, regulations and international agreements. Such provisions serve to identify the information source and, in specific instances, to prohibit reproduction of materials without written permission. For more information visit http://laws.justice.gc.ca/en/showtdm/cs/C-42
Les renseignements dans ce document sont protégés par la Loi sur le droit d'auteur, par les lois, les politiques et les règlements du Canada et des accords internationaux. Ces dispositions permettent d'identifier la source de l'information et, dans certains cas, d'interdire la copie de documents sans permission écrite. Pour obtenir de plus amples renseignements : http://lois.justice.gc.ca/fr/showtdm/cs/C-42
E. H. Fini\1. L. AI-Qadi2,J-F. Masson3
Abstract
Approximately 60% of the U.S. annual national transportation budget is spent on pavement maintenance. One of the most common pavement maintenance treatments is crack sealing. Sealing pavement cracks significantly extends pavement service life, provided that an appropriate sealant is selected and properly installed. However, adhesion loss often leads to premature sealant failures. The adhesion quality and field performance of
bituminous crack sealant cannot be predicted because the current test method (ASTM D6690) is empirical and only provides a qualitative measure of bond strength. Hence, there is a great need for test methods based on bituminous sealant rheology, which can better predict field performance. This paper presents the
development of a pressure-loaded blister test and apparatus to measure the adhesion of asphaltic materials,andbituminous crack sealant in particular. The blister test provides two fundamental parameters of the tested material, the interfacial fracture energy, which is related to the adhesion strength, and the modulus. In this test, a fluid is injected at a constant rate at the interface between the substrate (aggregate or a standard material) and the adhesive (crack sealant) to create a blister. The fluid pressure and blister height are measured as a function of time. Using these two
IGraduate Research Assistant
2Founder Professor of Engineering, Department of Civil and Environmental Engineering; Director, Illinois Center for Transportation, University of Illinois at Urbana-Champaign, Urbana, IL, respectively.
) Senior Research Officer, Institute for Research in Construction, National Research Council of Canada, Ottawa
Fini, AI-Qadi, Masson
quantities and utilizing the classical plate and fracture mechanics principle, the interfacial fracture energy is calculated.
Key Words: Pressurized blister test, interfacial fracture, debonding, rheology, sealants.
Introduction
Adhesion failure is similar to fracture (I). The concept of fracture in materials may be divided into two general
classifications: (i) cohesive fracture, or the separation of a material from itself, and (ii) adhesive fracture, or the separation of a material from a dissimilar material at the bond line between the two materials. Tensile tests have been used to measure adhesion. Masson and Lacasse (2) and Zanzotto (3) independently measured the bond strength of bituminous sealants to hot-mix asphalt (HMA) by bringing sealant-HMA assemblies to tensile failure. In both studies, the bond strength was taken as the energy spent to bring the assemblies to failure. They measured energies of200 to 500
11m2at -37°C and 500 to 100011m2at -30°C, respectively. Although these results showed the energy required to break the assemblies is greater at -30°C than at -37°C, they do not indicate that the adhesion was greater. They only indicate that bituminous sealants extend more at higher temperatures and that more energy is spent in straining the sealant. In addition, a direct comparison of these results is of dubious value because different sample
geometries and set-ups were used.
Traditional adhesive joint strength tests (e.g., butt tensile, lap shear) are commonly used, but because ofthe dependence on sample geometry, unknown stress distributions, and the existence of tensile and shear loads at the interface, current use is most often restricted to studies of a single adhesive-substrate system with a single specimen size and geometry (4). Traditional joint tests are rarely used to characterize asphaltic materials.
Adhesive interactions at the interface and material characteristics both contribute to the bond strength measured by mechanical tests. By means of contact angle measurements, the adhesion component may be calculated from the surface free energy of both the adhesive and the aggregate (5, 6). It may be
argued that knowledge ofthe surface energy of bituminous sealants and substrate materials, aggregates, and asphalt or Portland cement could lead to the selection of compatible sealant-substrate combinations, and, hence, a better bituminous sealant performance. However, the variation in aggregate chemistry (7, 8), even from a single quarry, and sealant composition (9) can only lead to poor reproducibility. Moreover, the total energy required to break the bond of a soft viscoelastic material from the substrate is several orders of magnitude higher than the interfacial energy (10). Thus, for bituminous crack sealants, the calculation of the surface energy is not the best means of assessing bond strength and potential performance.
The objective of this paper is to provide details of the development of a new pressure-loaded blister test to measure the adhesion of asphaltic materials to aggregate. The test, during which pressure and blister height are measured over time, accounts for both the deformation of the material and its adhesion. Based upon the principles of fracture mechanics, the results allow for the calculation of the sealant modulus and bond strength in terms of interfacial fracture energy.
Background
Fracture mechanics has already been accepted in failure analysis of many materials, including HMA (10). Interfacial fracture energy depends upon the thermodynamic work of adhesion, fracture mechanics, and rheology (II). In 1921, Griffith proposed an energy criterion for failure, which is primarily a statement of the principle of energy balance (12). A crack will propagate if the energy available is greater than the energy required to extend the crack by a unit surface area. Griffith showed that this energyGois the sum of the surface energies of each of the newly developed surfaces (2
r
0). However, in reality,the energy required for unit crack propagation is much larger than 2
r
o. This is because the crack in most materials is rough andtortuous. In addition, micro-cracking, frictional slip, and plasticity expend energy in a sizable zone around the fracture tip (9).
Fini, AI-Qadi, Masson
Interfacial fracture energy, believed to be a fundamental material property, is defined as the energy required to separate a unit area of the interface (13). It is the sum of energy dissipated through a reversible component (thermodynamic work of adhesion) and a rate-dependent deformation component (viscous and plastic deformation). It is independent of geometry, and could represent the inherent property of an individual interface (4). However, interfacial fracture energy may also depend on surface preparation(13). Therefore, surface preparation needs to remain constant if interfacial fracture energy is used to predict adhesive strength for various geometries.
In summary, interfacial fracture energy can be a strong potential parameter in measuring bond strength. Needlesstosay, a mechanical test able to measure this energy will provide
researchers with an effective tool to evaluate bond strength, and, correspondingly, the field performance of bituminous materials, including crack sealants. However, fracture energy results from the conventional pull-off test (ASTM04541), the direct tension test (ASTM06723), and the bond test (ASTM 03405) are not consistent and may not allow comparison of laboratory results. After a comprehensive literature review, the peel test and the blister test were selected as two potential tests.
The peel test is a common method of measuring bond strength (ASTM01876, 03330). However, it has many drawbacks. Extracting Go from the results is difficult(14), particularly because much energy is dissipated or stored when the test specimen is deformed and little energy remains for fracture (14, 15). The tensile load being applied at 900
or1800 to the
surface leads to much difficulty in data reduction(16). Direct mechanical clamping remains inappropriate for thin, viscoelastic and adhesive-like asphaltic material, and the apparent interfacial fracture energy depends on the peel rate(17).
The blister test can measure interfacial fracture energy, which is a fundamental property of the interface. For elastic material, interfacial fracture energy is constant and directly related to adhesion strength. For viscoelastic material, interfacial fracture energy is expected to be time-dependent, although still geometry-independent, like the relaxation modulus(13). The current blister test was developed by Williams (I) and later modified by Burton et
Dannenberg (19). In the current method, a torus-shaped disk is covered with a layer of adhesive. When a liquid or gas with pressure p is injected into the center of the disk, the adhesive lifts off the disk (substrate). A blister forms, whose radius stays fixed, until a critical pressure,Pmis reached. At this critical value, the circumference ofthe blister increases in size and the pressure drops, which indicates adhesive failure.
Williams and Kelley (20) used a Winkler elastic foundation to analyze the blister test results and calculate the energy stored in the adhesive layer. Malyshev and Salganik (21) used a point-loaded blister test and observed that the pressure to debond the film remained constant, while the height of the blister increased proportionally to the square of the orifice radius. Later, Jones (22) used uniform pressure as the driving force in the pressurized blister test to improve the test reliability. Using this approach, he found the development of a smaller dome for the same total load. Williams conducted some experiments using a pressurized blister test and observed that a bigger orifice resulted in lower failure pressure (I). Gent and Lewandowski (17) observed that interfacial fracture energies from blister tests were consistently lower than those from peel tests. They attributed the relatively higher energy dissipated in the peel test to the fact that the adhesive was bent sharply away from the substrate at 90 degrees.
The blister test has been the subject of numerous studies. Gent and Lewandowski examined the case of very thin films that behave like membranes and showed that the adhesion could be expressed in terms of the pressure and the maximum height of the dome (17). Their solution was later expanded to account for the tensile residual stress built up in the adhesive during sample preparation (23). The modified elastic model for thin, flexible films was experimentally verified (24). Also, it was shown that for a larger orifice, the blister can blowout more before debonding occurs (25). Jensen and Thouless (26) analyzed the blister test for tensile and compressive residual stresses for both a small linear displacement limit (pure bending) and a large nonlinear
membrane-type limit (pure stretching). Later, Cotterell and Chen (27) studied the transition from bending to stretching of blister geometry by means of a IIencky series. They produced a polynomial expression for the interfacial fracture energy and discussed the mode-mixity of interfacial fracture in the blister test.
Fini, AI-Qadi, Masson
They explained that thinner adhesive film results in higher interfacial fracture energy and that the behavior of a blister is likely to be nearer to that of a plate than a membrane.
The mixity of stress modes at a failing interface is also important. Sheplak and Dugundji (28) analyzed the transition from bending (shear stress or mode II) to stretching (normal stress or mode I) of a blister test and showed that tensile residual stresses delayed the transition from mode II to mode I. Debonding begins primarily under mode I; as the debonding proceeds, mode II develops. Mode II stresses considerably increase fracture energy (29).
During the period of the Strategic Highway Research Program (SHRP), unsuccessful attempts were made to develop a blister test to measure binder adhesion to aggregates (30). The peak pressure was selected as a measure of adhesion. This approach, however, is too simplistic. The use of very thin films led to cohesive failure ofthe asphalt films and arguable freezing conditions resulted in adhesive failure. Because the test is geometrically independent, the film thickness does not affect adhesion strength. Hence, cohesive failure in the film can be prevented by increasing the film thickness. In addition, peak pressure alone cannot serve as a measure of adhesion strength. To obtain a unique measure of adhesion, the evolution of the blister profile and the blister pressure should have been recorded. This simplistic approach investigated by SHRP led the researchers to conclude that results did not reflect experience in the field and could not differentiate between various aggregates (30). Itwill be presented later in this paper how fracture mechanics is
implemented to extract the adhesion strength from the blister test on asphaltic materials.
In the blister test, the adhesive is either considered a thick plate or a thin membrane (27), whose deformation under pressure is used to calculate the adhesion strength, or interfacial fracture energy (17, 25, 26, 31). Adhesion strength is a function of the pressure, the blister height, and a constant for plate- or membrane-like behavior. Pressure and blister height vary over time and it is most common to use the maximum pressure and blister height, which occur just before debonding, to calculate adhesion strength. This can lead to an overestimation of the adhesion strength,
however, because the debonding rate and the pressure drop, upon delamination, can be nonlinear.
Apparatus and Experimental Method
Figure la depicts a schematic of the instrument and sample. In this test, a fluid is injected at a constant rate at the interface between the substrate (a standard material or aggregate) and the adhesive (crack sealant) to create a blister. Pressure,p,and blister height, d, are recorded as a function of time. The volume flow rate of alcohol is controlled at 0.1 Lib. The induced pressure inside the blister was measured with a Viatran pressure transducer. The transducer resolution is 0.25% of full range and its maximum capacity is 3.5 MPa. The height of the evolving blister is recorded by an LVDT (linear variable displacement transducer) of ±12 mm.
To minimize the effect of compliance, the torus-shaped standard substrates were prepared from 606 I-aluminum. The inner and outer diameters were respectively 50 mm and 125 rom and the substrate thickness was 6.25 mm. The substrates were
mechanically polished to a 63 Ilm in finish, washed first with water, and then with acetone, and finally air driedtoattain uniform surface roughness and cleaning conditions for all the substrates. The orifice in the substrate was sealed with a close-fitted aluminum plug flush with the aluminum substrate surface. The plug was sprayed with a silicon release agent before pressing onto the substrate. The aggregate used for comparison was quartzite. To prepare the aggregate sample, the center hole was first cut through the chunk of stone; while confining the stone in its place, the core bit was changed to cut the outer perimeter. The core was then cut in slices to achieve the torus disks (Figure Ib).
Hot-poured crack sealant was used as the bituminous adhesive material. Itwas heated to its suggested application temperature, stirred thoroughly, and then poured onto the substrate. A press machine was used to press the sealant into a 2-mm-thick flat disk. With the press plate in place, the specimen was trimmed to the required diameter (Figure Ib). After I hour of curing, the press plate was then removed, and the sample was placed in a cooling bath for another one-half hour prior to testing.
the cooling medium) was injected through the center hole ofthe specimen at 35 mm3/s rate.
The coefficient of thermal expansion of three sealants was measured in triplicate between -40oe and ooe with a
thermomechanical analyzer (TMA) from TA Instruments, model 2940. The measured coefficient of thermal expansion for sealant at -34 °e varies from 20 to 300 1lrn/(m·°C).
Feasibility Test
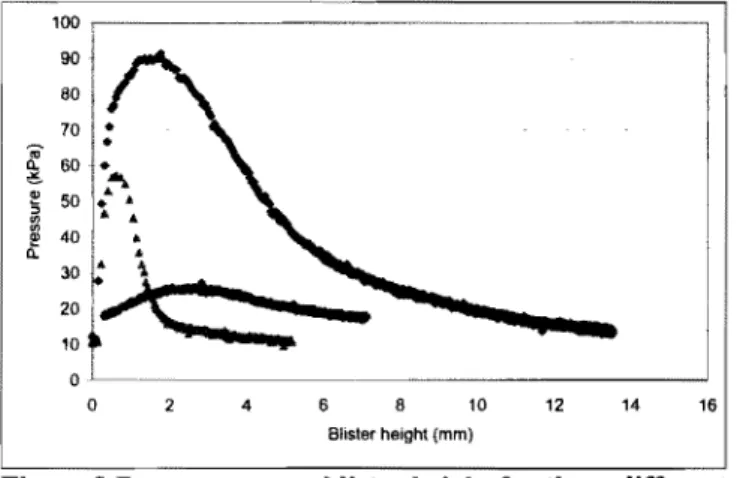
Figure 2 presents typical blister test data for three sealants possessing different characteristics. As the specimen is
pressurized, the pressure and height of the blister increases until pressure reaches its maximum level. At this point, the pressure begins to decrease while the height keeps increasing until the specimen fails in adhesion, after which point the pressure drops and the blister height diminishes.
100 I
r
,
90 60 70'"
セ 60•
I
:-..
セセ 50•
•
"• •
" 40 セ•
<I.•
3 0 ' i.:0
:
II
0 2 4 6 8 10 12 14 16 Blister height (mm)Figure 2 Pressure versus blister height for three different sealants.
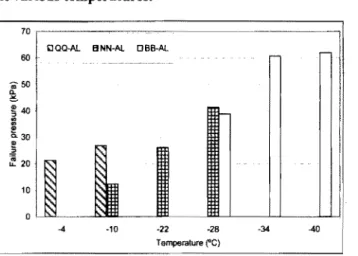
Figures 3a and 3b depict the maximum pressure attained for sealants QQ, NN, and BB at temperatures from -4°e to -40oe on quartzite and aluminum substrates. They show that the new
Fini, AI-Qadi, Masson
blister test can not only differentiate between various
adhesive/adherend systems, it can also capture the variation due to test temperature and substrate.
70
iJQQ-agg liNN-egg DBB-egg
60 .--.. SO セ .--! 40 セ ! Q.30 ! .2
セ
セ 20 10Nセ
セi
0 -400 -10.00 -22.00 -28.00 -34.00 Temperature (OC)Figure 3a Failure pressure for three sealant·aggregate systems at various temperatures.
70
iJQQ·AL BNN-AL DBB-AL
co-60 . . 50 セ !40 セ :!? Q.30 ! .2 セ 20 10
I
0 -4 -10 -22 -28 -34 -40 Temperature ("C)Figure 3b Failure pressure for three sealant·aluminum systems at various temperatures.
Substrate Selection
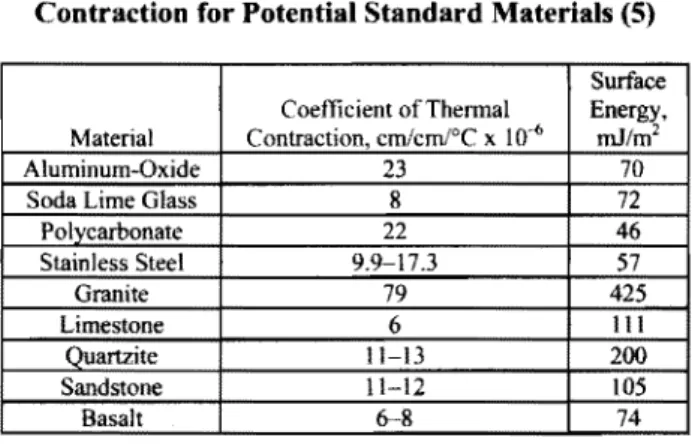
The current specifications for hot-poured bituminous sealants, ASTM D6690, require the use of concrete block as the substrate. Consequently, it does not account for the variation of aggregate composition in the field. Aggregate composition plays a key role in sealant-aggregate adhesion (2, II, 32). Due to wide variation between aggregates, even within the same quarry, using local aggregate as the substrate is impractical and would lead to poor reproducibility. In an effort to find an appropriate substitute for aggregate, four substrates were examined: stainless steel, glass, polycarbonate, and aluminum. The surface energies of these materials and five typical aggregates are presented in Table I. Figure 4 illustrates the importance of surface energies as visible by the contact angle of a sealant with various aggregates. High-energy surfaces (e.g., granite) lead to low contact angles and good adhesion, whereas low energy surfaces (e.g., basalt) lead to high angles and lower adhesion (II, 32).
Table 1 Surface Energy and Coefficient of Thermal Contraction for Potential Standard Materials (5)
Surface Coefficient of Them1al Energy, Material Contraction, cm/cml°C xャHイセ mJ/m2
Aluminum-Oxide 23 70
Soda Lime Glass 8 72
Polvcarbonate 22 46 Stainless Steel 9.9-17.3 57 Granite 79 425 L' 6 111 Ouartzite 11-13 200 Sandstone 11-12 105 Basalt 6-8 74
Upon cooling of the asphaltic material on the substrate, stresses develop at the interface due to differences in coefficients of thermal expansions. To mimic true conditions and minimize interfacial residual stresses, model substrates must behave like
Fini, AI-Qadi, Masson
aggregates. Hence, the compatibility of the sealant and substrate also must be considered.
Another factor to consider is bituminous sealant diffusion into aggregate, or adsorption. Aggregate bituminous-adsorption can vary significantly (33). Due to the relatively high viscosity of bituminous sealants at pouring temperature, the diffusion is expected to be relatively low; but it stilI needs to be explored. A low adsorption rate reduces the bond.
Surface roughness can affect the density of air bubbles, defects at the interface, and hence, the wettability of the substrate. Itcan also affect the interlock between the bituminous sealant and substrate (11). Relating the viscosity and surface roughness to adhesion strength will be the subject of another publication. Other parameters that may affect interface bonding are resistance to solvents, pouring temperature, and low service temperature.
Given the aforementioned constraints, aluminum was selected as a potential standard substrate. For consistence and to maintain low surface roughness, each aluminum plate was polished to 63 1-1111 Due to its rapid oxidation, aluminum develops a surface layer of aluminum oxide. So, on the surface, there are aluminum oxide groups, AI-OH; these groups are similar in chemistry to the silicon oxide groups, Si-OH. Both groups are found in aluminum silicate minerals (aggregates). Hence, aluminum substrate can represent aggregates like granites, quartzite, and sandstone, which have an OH group on their surface.
Optimum Cooling Time
To minimize the hardening effect of the specimen due to cold temperatures, the shortest time to thermal equilibrium was sought. The required time for the specimen including substrate (aluminum plate) and adhesive (sealant) to reach thermal
equilibrium was calculated using thermodynamic principles. From these principles, it was found that the specimen reached thermal equilibrium within 13 min (Table 2). To ensure complete cooling, the sample was selected to be conditioned for 20 min
in
the cooling bath to prevent the development of residual stresses.,=1206-6054mJ/m2 Gramte ,=425.22mJ/m2 Limestone 11 14 mJ/m2 Basalt ,=73 6mJ/m2
Figure 4 Schematic of surface tension values for adhesive (hot-poured crack sealant) and adhereds (aggregates) [7,8].
Table 2 Minimum Required Cooling Time for Aluminum and Sealant
Heat Mid- Thermal
Specific Density,
transfer plane Bi' Cooling
Substrate conductivity heat p
of distance time
material
alcohol (Biot (min)
(Wlm'.oK) (m) (Jlm.s.oK) {Jlkg.oK} kglm' Number)
Aluminum 300 0.006 237.00 900 2770 0.008 9 Sealant 300 0.005 0.17 600 1000 8.294 13
*BlOt number IS a dImenSIonless number whIch relates the heat transfer resistance inside and at the surtace of the body.
Residual Stress in the Sealant
Residual stress builds up at the sealant-substrate interface when sealant is poured hot and then cooled to the test temperature. The residual strain from this stress can be calculated from Equation
I (34):
Fini, AI-Qadi, Masson
where as and af are the coefficients ofthennal expansions of the substrate and adhesive (sealant), respectively, and T1and T2are the blister test temperature and the sealant temperature when it contacts the substrate, respectively.
Itis noteworthy that is not the sealant pouring temperature. Temperature measurements indicated that T2was
50°C below the sealant pouring temperature, in agreement with other data presented elsewhere (35). For instance, when pouring temperature was 185°C, T2was 135°C. With a test temperature T1
of -34°C, a sealant with af of235 x 10-6 m/mI"C (measured by TMA) and an aluminum substrate with as of 23 x 10-6 m/m/°C, the residual strain was calculated to be 0.036. Allen showed that neglecting the residual strain led to overestimating the interfacial fracture energy by 32% (36).
However, in the case of bituminous crack sealant, which is a viscoelastic material, it appeared that if the specimen placed in the cooling bath for a sufficient period of time before running the test, residual stresses would vanish. To estimate the time required to release the residual stress, a relaxation modulus master curve was generated using creep compliance data extracted from bending beam rheometer tests (37). Itwas found that the residual stress dropped rapidly in the first 20 min (Figure 5). To limit the physical hardening and at the same time give the sealant enough time to release the residual stress, 20 min was selected for the cooling period. After conditioning, the specimen was placed in the instrument, and the pressure, height ofthe dome, and displacement of the piston were measured.
Analysis Approach and Discussion
Adhesive fracture mechanics is used to determine the interfacial fracture energy of an interface system by means of the blister test (13, 16,27). Exact and approximate solutions to the problem of bond strength from results of the pressurized blister test have been developed (l, 17, 36, 37). The general fonn for all debonding is expressed by Equation 2 (20), which is based on the balance between the potential energy provided by the externally
applied pressure and the elastic strain energy stored in the blistering viscoelastic material (13, 16):
(2)
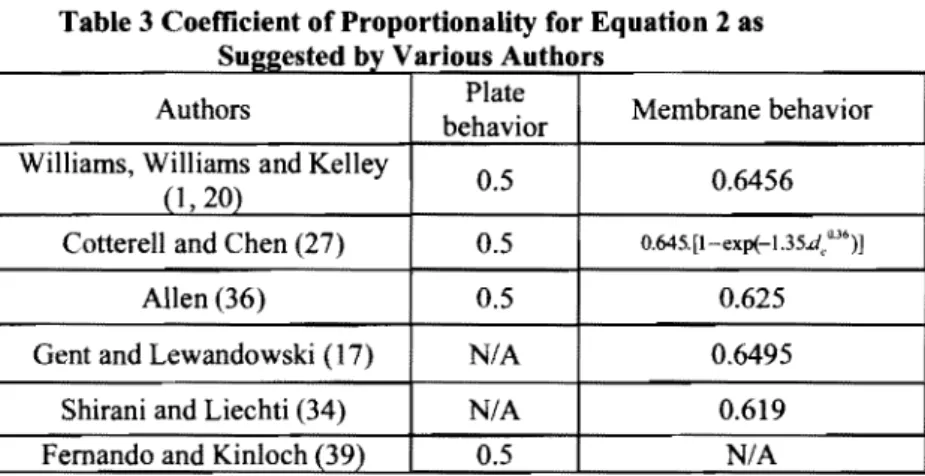
where Ga is the bond strength,rpis a coefficient of proportionality (constant which can be defined based on geometry and material behavior),pis the pressure and d is the blister height withpand d being measured in the blister test (Figure 2). rpcan vary from 0.5 to about 0.65, with much controversy over the best value to use (27). If the behavior is plate-like, a value of 0.5 is generally accepted (I, 20, 27, 36, 39). A perspective ofrp values reported by several authors is presented in Table 3.
•• ••••
セ
·
...
---....
Qッッ 1000 100 Time(s) 10 ol セセ ---.J 1 t IFigure 5 Variation of residual stress over time for sealant NN at-34°C.
As mentioned earlier, the blister test shows either plate or membrane behavior depending on orifice size, film thickness, and adhesion strength. If the ratio of the orifice radius to the adhesive thickness is below 10, for adhesion strength 100 J/m2,the blister shows a plate-like behavior (13,34).
Fini, AI-Qadi, Masson
Table 3 Coefficient of Proportionality for Equation 2 as Su22es etdb V ')y 8nousA iliu on
Authors Plate Membrane behavior behavior
Williams, Williams and Kelley
0.5 0.6456
0,20)
Cotterell and Chen(27) 0.5 0.645. [1-exp(-1.35.d"o.,,)]
Allen(36) 0.5 0.625
Gent and Lewandowski(17) N/A 0.6495 Shirani and Liechti(34) N/A 0.619 Fernando and Kinloch(39) 0.5 N/A
Another approach to defining blister behavior is through examining the relationship between pressure and blister height before the peak pressure has been reached. The data before the peak is related to the adhesive behavior before any debonding begins. This part of the data can be used to study the properties of the adhesive layer independently of the data after the peak, which is related to the interface (] 9). Data before the peak shows that the blister's behavior can be analyzed as a membrane if pressure is a cubic function of the blister height(36). However, if there is a linear relationship between pressure and blister height, which is the case in this study, the blister shows plate behavior(39). After the behavior of the blister is defined, the coefficient of proportionality
rp
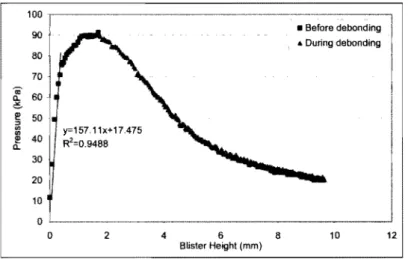
can be found from Table 3.As can be seen in Figure 6, data before the peak pressure fits well to a linear function (R2=95%). This implies that in this range of deformation, plate behavior is dominant(36, 39). Therefore, valueQJ 0.5 (Table 3) was selected and plugged in Equation2 to calculate the interfacial fracture energy. Bond strength in this method appeared to be insensitive to material behavior and extent of deformation(40), which offers considerable practical advantages in simplifying the experiment.
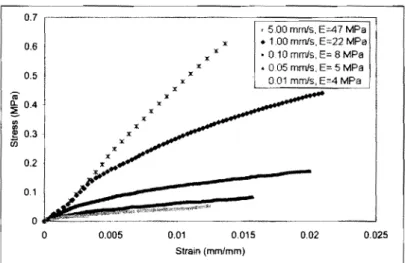
Equation2 overlooks membrane forces developed in the sealant. To account for these forces, although they are negligible, the sealant elastic modulus needs to be determined (14). A uniaxial test may be used; however, as for any rate-dependent
materials, the modulus changes with loading rate, as shown in Figure 7a. 100 90 80 70 m 60 (l. セ セ 50 :> U> U> 40 セ (l. 30 20 10 0 0 y=157.11x+17.475 R'=0.9488 2 4 6 8 Blister Height (mm) • Befclre clebcmdilng
•
10 12Figure 6 Pressure versus blister height, before and during delamination, for sealant bonded to aluminum.
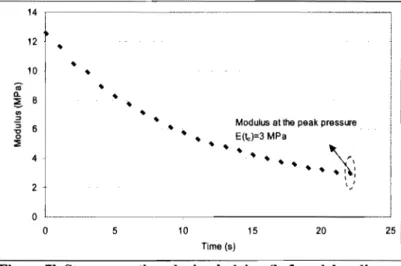
Determining the elastic modulus fTOm the blister test is another aspect which makes this test attractive (41). Because the boundary condition is constant until the crack initiates at the peak pressure, the correspondence principle for viscoelastic material can be used to calculate the elastic modulus. In other words, to address the viscoelastic effect, the elastic modulus can be calculated at each time-step of the test until reaching the peak pressure. The calculated elastic modulus at the peak pressure (onset ofthe crack [Figure 7b]) can be used to calculate the interfacial fracture energy using Equation 4 (36). Because of debonding process stability, bond strength can be determined independently ofthe geometry of the bond (36): where E(t) p,).77(!!.)4(!!...)3
+
5.3,
(!!')4(!!"')r1 ah
(1 u") ah
Go O.Ol2E(t c)h(dc )4+
RNVWeHエセIィS
dc4 2a
(I-v)a
(3) (4)Fini, AI-Qadi, Masson
Go
=Interfacial fracture energy,(11m2)P
= Pressure of the liquid inside the blister, (Pa)d
Height of the blister, (mm)Pe
=Critical pressure of the liquid inside the blister, (Pa)de
Critical height of the blister, (mm)a
= Orifice diameter, (mm)E(tJ
= Relaxation modulus of the sealant at peak point, (Pa)V=Poisson's ratio
t
=
t
e = Critical time (corresponding to peak pressure), (s)h
= Thickness of the adhesive layer, (mm).0.025 0.02
-"
..
..
x x..
x "-x"
.-x x x x x 0.7r---.·---·---r=======:::;_]
,5.00 mmls.eセW MPa • 1.00 mmls. E:22 MPa • 010 mmls. E: 8 MPa • 005 mmls. 5 MPa 001 mrT'Js, E:4 MPa 0.5 0.6 0.2 セ l* 0.11 MGセ _ ow;;;:::::..-.."..
c?'. .セL
. .LLGBBセNセ]
..
セMZZ]
__
o 0.005 0.01 0.015 Strain (mmlmm)m
セ 04..
.,
セ 0.3 enFigure 7a Stress versus strain from uniaxial test at different loading rates.
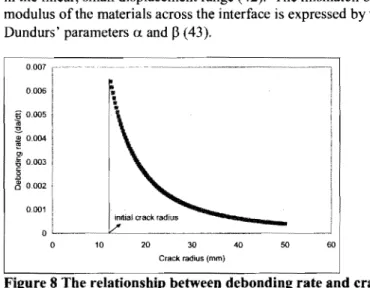
Itshould be noted that although the blister test is conducted at a constant fluid injection rate, the debonding rate may not be constant because of the specimen's geometry and the axisymmetric debonding process (Figure 8). After the crack front is completed, interfacial fracture energy varies very little and becomes
independent of the delamination length and initial crack length (13).
Modulus atthepeak pressure
E(Ic)=3 MPa セセ .. ..
\
r セ セ , . . . I I \ I 14 12 10..
0-8 '!.'"
:> :; 6 ." 0 :::! 4 2 0 0 5 セ セ 10 セ セ 15 20 25 Time(8)Figure 7b Stress over time during bulging (before debonding starts).
During the debonding phase, the crack radius a increases, while the thickness, h of the sealant is relatively constant.
Therefore, the aspect ratio!: increases. As would be expected, the
h
interfacial fracture energy Ga is nearly the same during the
debonding period because it is independent of geometry. Itshould be noted that increasing the crack radius during debonding leads to a higher aspect ratio !:.
h
Mode-Mixity in the Blister Test
Adhesion strength is independent ofthe elastic properties of the substrate (Equations 2 and 4). However, the tensile modulus of the substrate has a significant etTect on the fracture process even
Fini, AI-Qadi, Masson
in the linear, small displacement range (42). The mismatch of the modulus of the materials across the interface is expressed by the Dundurs' parametersa andセ (43).
60 50 40 30 Crack radius (mm) 20 10 o '-- ..., N⦅セ ___.J o 0007 0.001 セ 0.005 セ セ 0.004 '" :60.003
g
,30002 0.006Figure 8 The relationship between debonding rate and crack radius during delamination (14).
fJ
E' -E'$ a "" -E"-'+-E-:''':-s . 1-2v, . 1-2v E HMMMセIMe s(·---) ャMセL I-v 2(£'+E',) (5)(6)
whereeGGGGGセ
I-v· (7)E'and vare plain strain Young's modulus and Poisson's ratio of the adhesive, respectively, and Es' and v, are those of the substrate. Usually a is the dominant factor, so the analysis can be simplified to the case whereセ "" 0 (26).
Interfacial fracture energy is heavily dependent upon the stress field at the interface. Normal (mode I) and shear (mode II) stresses characterize this field. Ittakes significantly more energy to debond (grow a crack) under mode II than under mode I. Consequently, debonding is mainly due to modeI. However, at
the interface of two materials, where crack growth is often constrained, both modes I and II stresses contribute to debonding. These mixed-mode conditions are quantified by a mode-mixity phase angle セjL which is 0° for pure mode I and 90° for pure mode II. Mode-mixity can be expressed as follows (26):
KII Asinw+cosw
tanljl= - =
-Kf Acosw-sinw (8)
whereK, and Kif are the modes I and II of the stress intensity factors, w is a function of a andセL and').., is defined as follows:
(9)
In Equation 9, Nand M are, respectively, the membrane force and bending moment at the edge of the blister (26,42).
Jensen (42) used the results of Sue and Hutchinson (44) and plotted w = (a,Phersus a for three different values of
fJ
(Figure 9). He derived an equation that considered the effect of mode-mixity on interfacial fracture energy. Using Equation 2, one can apply the correction for mode-mixity as follows:
(10)
For small deformations
(Idl :::;
h), the linear solution to Equation 9results in N = 0 andA O. Therefore, Equations 8 and 10 can be simplified to the following (42):
K
Jr エ。ョャェャ]MMMMNAᆪN]M」ッエキセャェi]⦅HMMキI (11) Kf 2 Ga =O.5pd(coiIf/r
l =O.5Pd(sin2wr
l (12)Dundurs' parameters were calculated by Equations 5 and 6 using the values of elastic modulus and Poisson's ratio for bituminous sealant (adhesive) and aluminum (substrate). Ratios a
and
P
were found to be 0.9 and 0.2, respectively;thuspセ
a . As 4Fini, AI-Qadi, Masson
a
shown in Figure 10, for
P
=
4'
w=
(a,p) was estimated to be 57.5 ata 0.9. Using Equation 12, the corrected value for the interfacial fracture energy, at an early stage of debonding, was found to be 112.43J/m2• 1.0 p=o 05o
-05 45 ..._ _--" ... ... 1 . --0.1 506:
60 セa
65 70Figure 9 Variation ofw (a,p) versus a for various values of
P
(after 42).The presence of mode II increases the interfacial fracture energy from 80.31 J/m2to 112.43J/m2• Given the significant
difference in elastic modulus of the aluminum and the sealant, a セ 0.9 is a reasonable assumption for all sealant-aluminum combinations. Evans et al. plotted some bi-material interfaces in the (a,p) space (29). They showed that most interfaces have
a
p
= 0 for(v=
Vs 0.5) orP
=
for(v=
Vs 0.3). Considering 4that the Poisson's ratio, v, for most bituminous sealants ranged
a
from 0.3 to 0.5, the values ofw ata セ 0.9 from curveP
=4
andp
= 0 were found to be 57 and 65, respectively. Thesecorresponded to the correction factors of 1.2 and 1.4. Considering that mode II stresses increase interfacial fracture energy, even without correcting for mode-mixity effects, the interfacial fracture energy,Ga ,can serve as a measure of bond strength for bituminous
sealants. However, neglecting the effect of mode-mix.ity can result in the interfacial fracture energy being underestimated. This will Icad to a higher conservative threshold.
Summary
The blister test is a promising method for measuring the adhesion strength of binder and hot-poured bituminous crack sealant to aggregate provided the energy dissipated through plastic defonnation is excluded, and the same surface treatment is applied.
The blister test is geometrically independent, unlike the direct tensile test. The interfacial fracture energy measured from the blister test will always be greater than the energy obtained from the surface energy approach. This is because the second provides the energy required for reversible separation of the two materials at the interface only.
Because one of the major causes of bituminous crack sealant failure in the field is debonding ofthe sealant from the cracks' walls, calibrating the interfacial fracture energy extracted from the blister test, as a measure of adhesion strength, can serve to define an acceptable threshold for bituminous material bond strength.
Conclusions
A blister test was developed in an effort to quantify the bond strength of asphaltic materials to aggregates. As an example, hot-poured bituminous crack sealants for roadway maintenance were used. The blister test could become a standard for measuring bond strength to help predict field perfonnance.
The blister test provides two fundamental parameters, the tensile modulus and the interfacial fracture energy. The latter is expressed by two experimental parameters, the pressure load and the blister height, so that data analysis is easy. The results are independent of the material geometry and the extent of
defonnation. The test can be carried out at low temperatures, and a feasibility analysis showed that various systems of
Fini, AI-Qadi, Masson
temperature. Hence, a new setup was developed towards a standard test. Aggregate was replaced with aluminum to ensure using a standard substrate material for testing. Aluminum was selected because of its compatibility with sealant, low diffusion, controllable roughness, high resistance to both very high and very low temperatures, and availability. It also has a similar thermal coefficient to the aggregates and a relatively high surface energy.
In addition to developing a lower limit threshold of adhesion for bituminous materials based on interfacial fracture energy, the blister test can be used to examine how various factors such as curing, presence of water, aging, adhesion promoter, and physical hardening affect the adhesion strength of bituminous materials to aggregate, particularly for hot-poured bituminous crack sealant. It has to be noted that the plastic energy, which some sealants may dissipate, need to be removed from the calculated interfacial fracture energy. This can be done through numerical modeling.
Acknowledgments
This research is sponsored by the Federal Highway Administration's pooled-fund study TPF5 (045) and the U.S.-Canadian Crack Sealant Consortium. The contribution of the participating states, industry, and provinces is acknowledged. The helpful suggestions offered by M. Allen of the Georgia Institute of Technology, K. M. Liechti of the University of Texas at Austin, L. Penn ofthe University of Kentucky, T. Scarpas of Delft University of Technology, and W. Buttlar of the University of Illinois at Urbana-Champaign are greatly appreciated. The authors also acknowledge the contributions ofS. Bundalo-Perc, S-H. Yang, M. Wagoner, and D. Kibbey. The contents of this paper reflect the view of the authors, who are responsible for the facts and the accuracy of the data presented herein. The contents do not necessarily reflect the official views or policies of the Federal Highway Administration or the consortium members. This paper does not constitute a standard, specification, or regulation.
References
I. M.L.Williams, 'The Continuum Interpretation for Fracture and Adhesion,"Journal ofApplied Po{vmer Science,Vol. 13, pp. 20-40 ( 1969).
2. J-F. Masson and M. A. Lacasse, "Effect of the Hot-Aired Lance on Crack Sealant Adhesion,"Journal ofTransportation Engineering,Vol.
125 (1999).
3. L. Zanzotto,Laboratory Testing ofCrack Sealing Materialsfor Flexible Pavement.Transportation Association of Canada, Ottawa, ON ( 1996).
4. K. R. Jiang and L. S. Penn, "Use of the Blister Test to Study the Adhesion of Brittle Materials: Test Modification and Validation,"
Journal ofAdhesion,Vol. 32, pp. 203-216 (1990).
5. D. X. Cheng, D. N. Little, R.L.Lytton, and J. C. Holste, "Surface Free Energy Measurement of Aggregates and Its Application to Adhesion and Moisture Damage of Asphalt Aggregate Systems," International Center for Aggregates Research, 9th Annual Symposium, Austin, TX (2001).
6. A. Bhasin, E. Masad, D. Little, and R. Lytton, "Limits on Adhesive Bond Energy for Improved Resistance of Hot Mix AsphalttoMoisture Damage," 85th Transportation Research Board Annual Meeting, Washington, D.C. (Jan. 2006).
7. A. W. Hefer, Adhesion in Bitumin-Aggregate System and Quantification of the Effects of Water on the Adhesive Bond, PhD dissertation, Texas A&M University (2004)
8. C. J. Zollinger, Application of Surface Energy Measurements to Evaluate Moisture Susceptibility of Asphalt and Aggregates, MSc dissertation, Texas A&M University (2005)
9. L.S. Penn and E. Defex, "Relation between Work of Adhesion and Work of Fracture for Simple Interfaces," Journal ofMaterials Science,
Vol. 37, pp. 505-513 (2002).
10. F. M. Bayomy, M. A. Mull-Aglan, A. A. Abdo, and M.J.Santi, "Evaluation of Hot-Mix Asphalt (HMA) Fracture Resistance Using the Critical Strain Energy Release Rate," TRB Paper Number 06-2745, 85th Transportation Research Board Annual Meeting, Washington, D.C. (Jan. 2006).
11. J-F. Masson and M. A. Lacasse, "A Review of Adhesion Mechanisms at the Crack Sealant!Asphalt Concrete Interface,"Proceedings ofthe 3rd International Symposium on Durability ofBuilding and Construction Sealants,Fort Lauderdale, FL (2000).
12. A. A. Griffith. "The Phenomena of Rupture and Flow in Solids,"
Philosophical Transactions ofthe Royal Society ofLondon,Vol. 221, pp. 163-198 (1921).
13. S. 1. Bennett, K.L.Devries, and M.L.Williams, "Adhesion Fracture Mechanics,"International Journal ofFracture,Vol. 10, No. I, pp. 33-43 (1974).
Fini, AI-Qadi, Masson
14. Y.Z. Chu and C. J. Durning, "Application of the Blister Test to the Study of Polymer-Polymer Adhesion," Journal ofApplied Polymer Science, Vol. 45, pp. 1151-1164 (1992).
15. K. S. Kim and J. Kim, "Elasto-Plastic Analysis of the Peel Test for Thin Film Adhesion," Journal ofEngineering Materials and Technology. Transactions ofthe AS.ME. Vol. 110, No.3, pp. 266-273 (1988).
16. K. T. Wan and W. M Yiu. "Fracture Mechanics ofa New Blister Test with Stable Crack Growth. ,. Acta Metallurgica et Materialia, Vol. 43, No.II.pp. 4109-41 15 (1995).
17. A. N. Gent and L. H. Lewandowski. "BlowoffPressures for Adhering Layers," Journal ofApplied POIJ'll1er Science, Vol. 33, pp. 1567-1577 (1987).
18. 1. D. Burton,W.B. Jones, and M.L.Williams, "Theoretical and Experimental Treatment of Fracture in an Adhesive Interlayer," Transactions ofthe Society ofRheology, Vol. 5, No. I,pp. 39-50 (1971).
19. H. Dannenberg, "Measurement of Adhesion by a Blister Method," Journal ofApplied Polymer Science, Vol. 5, No. 14, pp. 125-134 (1961).
20. M. L.Williams and F. N. Kelley, The Interaction Between Polymeric Structure. D'iormation and Fracture, In Polymer Networks: Structural and Mechanical Properties, A. J. Chompff(Ed} Plenum Press, New York,1'.'Y,pp.193-218(1971).
21. B. M. Malyshev and R. L Salganik, "The Strength of Adhesive 10ints Using the Theory ofCraeks,"Internalional Journal ofFracture Mechanics,Vol.l,pp.114-125(1965).
22. W. B. Jones, A Simple Test for Certain Case ofAdhesion, UTEC DO 69-088, College of Engineering, University of Utah, Salt Lake City (1969).
23. M. G. Allen and S. D. Senturia, "Analysis of Critical Debonding Pressures of Stressed Thin Films in the Blister Test, ,. Journal of Adhesion, Vol. 25, pp. 303-315 (1988).
24 P. Lin and S. D. Senturia, "The in Situ Measurement of Biaxial Modulus and Residual Stress of Multi-Layer Polymeric Thin Films," Materials Research Society Symposium Proceedings, Vol. 188, pp. 41-46 (1990).
25. M. G. Allen, M. Mehregany, T. R. T. Howe, and S. D. Senturia, "Microfabricaled Structures for the in Situ Measurement of Residual Stress, Young's Modulus, and Ultimate Strain of Thin Films," Applied Physics Letters, Vol. 51, No.4, pp. 241-243 (July 27, 1987).
26. H. M. Jensen and M. D. Thouless, "Effects of Residual Stresses in the Blister Test. "International Journal ofSolids and Structures, Vol. 30, pp. 779-795 (1993).
27. B. Cotterell and Z. Chen, "The Blister Test-Transition From Plate to Membrane Behavior tor an Elastic Material," International Journal of Fracture, Vol. 86, pp. 191-198 (1997).
28. M. Sheplak and J. Dugundji, "Large Deflections of Clamped Circular Plates under Initial Tension and Transitions to Membrane Behavior. ., ASME Journal ofApplied Mechanics, Vol. 65, pp. 107-115 (1998). 29. A. G. Evans, M. Rilhle,B. J. Dalgleish, and P. G. Charalambide. The
Fracture Energy ofBimateriaiinterfaces, University of California-Santa Barbara Materials Department Report (1989).
30. D. A. Anderson, Binder Characterization and Evaluation. Vol. 3: Physical Characterization. SHRP-A-369, Strategic Highway Research Program, Washington, D.C. (1994).
31. R. R. Despain, K.L.DeVries, R. D. Luntz, and M.L.William, "A Strength Comparison of Barnacle and Commercial Dental Cements," 49thInternational Association for Dental Research General Meeting, UTEC DO 70-195 (Dec. 1970).
32. E. Fini,1.L.AI-Qadi, and S.H.Dessouky, "Adhesion of Hot-Poured Crack Sealant to Aggregate," TRB Paper Number 06-2888, 85th Transportation Research Board Annual Meeting, Washington, D.C. (Jan. 2006).
33. C. W. Curtis, Investigation of Asphalt-Aggregate Interaction in Asphalt Pavements, American Chemical Society (Fuel section), Vol. 37, pp. 1292-1297 (1992).
34. A. Shirani and K.L.Liechti, "A Calibrated Fracture Process Zone Model for Thin Film Blistering," International Journal ofFracture, Vol. 93, pp. 281-314 (1998).
35. P. Collins, J. F. Masson, and I.L.AI-Qadi, "Cooling Rates in Hot-Poured Bituminous Sealants," Journal of the Transportation Research Record, No. 1958, Transportation Research Board of the National Academies, Washington. DC. 2006, pp. 71-73.
36. M. G. Allen, "Measurement of Polyimide Interlayer Adhesion Using Micro-Fabricated Structures. " Journal ofPo(vmeric Materials. Science and Engineering. Proceedings of the ACS Division of Polymeric Materials. Science and Engineering, Vol. 59, pp. 352-356 (1988). 37. I.L.AI-Qadi. A. Loulizi, S. Aref, J-F. Masson, and K. M. McGhee,
"Modification of Bending Beam Rheometer Specimen for Low-Temperature Evaluation of Bituminous Crack Sealants," Journal of the Transportation Researchr・」ッイセ No. 1933, Transportation Research Board of the National Academies, Washington, DC, 2005, pp. 97-106. 38. K. Hbaieb and Y. W. Zhang, "A Parametric Study ofa Pressurized
Blister Test for an Elastic-Plastic Film-Rigid Substrate System," Materials Science and Engineering, A Vol. 390, pp. 385-392 (2005). 39. M. Fernando and A. J. Kinloch, "Use of the Inverted Blister Test to
Study the Adhesion of Photopolymers," International Journal of Adhesion and Adhesives, Vol. 10, No.2, pp. 69-76 (1990). 40. J. G. William, "Energy Release Rate forthe Peeling of Flexible
Membrane and the Analysis of Blister Tests," International Journal of Fracture, Vol. 87, pp. 265-288 (1997).
41. J. W. Beams, "Mechanical Properties of Thin Films of Gold and Silver," Structure and Properties ofThin Films. C. A. Neugebauer, J.
Fini, AI-Qadi, Masson
B. Newkirk, D. A. Vermilyea, Eds. Wiley, New York, pp. 183-192 (1959).
42. H. M. Jensen, "The Blister Test for Interface Toughness
Measurement," Engineering Fracture Mechanics, Vol. 40, no. 3,1991, pp.475-486.
43. J. Dundurs, "Mathematical Theory of Dislocations," American Society a/Mechanical Engineers, New York, 1969, pp. 70-115.
44. Z. Sue and J. W. Hutchinson, "Interface Crack between Two Elastic Layers," International Journal ofFracture, Vol. 43, 1990, pp. 1-18.
![Figure 4 Schematic of surface tension values for adhesive (hot- (hot-poured crack sealant) and adhereds (aggregates) [7,8].](https://thumb-eu.123doks.com/thumbv2/123doknet/14169800.474423/17.608.132.461.76.333/figure-schematic-surface-tension-adhesive-sealant-adhereds-aggregates.webp)

![[PDF] Introduction à la conception objet et à c++ | Cours informatique](data:image/gif;base64,R0lGODlhAQABAIAAAP///wAAACH5BAEAAAAALAAAAAABAAEAAAICRAEAOw==)