HAL Id: hal-01097829
https://hal-univ-rennes1.archives-ouvertes.fr/hal-01097829
Submitted on 16 Oct 2020
HAL is a multi-disciplinary open access
archive for the deposit and dissemination of
sci-entific research documents, whether they are
pub-lished or not. The documents may come from
teaching and research institutions in France or
abroad, or from public or private research centers.
L’archive ouverte pluridisciplinaire HAL, est
destinée au dépôt et à la diffusion de documents
scientifiques de niveau recherche, publiés ou non,
émanant des établissements d’enseignement et de
recherche français ou étrangers, des laboratoires
publics ou privés.
Distributed under a Creative Commons Attribution - NoDerivatives| 4.0 International
Mimicking floodplain reconnection and disconnection
using 15N mesocosm incubations
N. Welti, E. Bondar-Kunze, M. Mair, Patricia Bonin, W. Wanek, Gilles Pinay,
T. Hein
To cite this version:
N. Welti, E. Bondar-Kunze, M. Mair, Patricia Bonin, W. Wanek, et al.. Mimicking floodplain
recon-nection and disconrecon-nection using 15N mesocosm incubations. Biogeosciences, European Geosciences
Union, 2012, 9 (11), pp.4263-4278. �10.5194/bg-9-4263-2012�. �hal-01097829�
www.biogeosciences.net/9/4263/2012/ doi:10.5194/bg-9-4263-2012
© Author(s) 2012. CC Attribution 3.0 License.
Biogeosciences
Mimicking floodplain reconnection and disconnection using
15
N
mesocosm incubations
N. Welti1,2,*, E. Bondar-Kunze1,2, M. Mair1,2, P. Bonin4, W. Wanek3, G. Pinay5, and T. Hein1,2
1University of Natural Resources and Life Science, Institute of Hydrobiology and Aquatic Ecosystem Management, Vienna, Austria
2WasserCluster Lunz Biologische Station GmbH, Lunz am See, Austria
3University of Vienna, Department of Terrestrial Ecosystem Research, Vienna, Austria
4Aix-Marseille Universit´e, Mediterranean Institute of Oceanography (MIO), Marseille 9, France 5ECOBIO-OSUR-CNRS, Avenue du General Leclerc, Rennes, France
*currently at: National Centre for Groundwater Research and Training, University of Queensland, Brisbane, Australia
Correspondence to: N. Welti (n.welti@uq.edu.au)
Received: 13 March 2012 – Published in Biogeosciences Discuss.: 2 April 2012
Revised: 23 September 2012 – Accepted: 3 October 2012 – Published: 5 November 2012
Abstract. Floodplain restoration changes the nitrate deliv-ery pattern and dissolved organic matter pool in backwa-ters, though the effects these changes have are not yet well known. We performed two mesocosm experiments on flood-plain sediments to quantify the nitrate metabolism in two types of floodplains. Rates of denitrification, dissimilatory nitrate reduction to ammonium (DNRA) and anammox were measured using15N-NO3tracer additions in mesocosms of undisturbed floodplain sediments originating from (1) re-stored and (2) disconnected sites in the Alluvial Zone Na-tional Park on the Danube River downstream of Vienna, Aus-tria. DNRA rates were an order of magnitude lower than denitrification and neither rate was affected by changes in nitrate delivery pattern or organic matter quality. Anam-mox was not detected at any of the sites. Denitrification was out-competed by assimilation, which was estimated to use up to 70 % of the available nitrate. Overall, denitrifi-cation was higher in the restored sites, with mean rates of 5.7 ± 2.8 mmol N m−2h−1compared to the disconnected site (0.6 ± 0.5 mmol N m−2h−1). In addition, ratios of N2O : N2 were lower in the restored site indicating a more com-plete denitrification. Nitrate addition had neither an effect on denitrification, nor on the N2O : N2ratio. However, DOM (dissolved organic matter) quality significantly changed the N2O : N2ratio in both sites. Addition of riverine-derived or-ganic matter lowered the N2O : N2ratio in the disconnected site, whereas addition of floodplain-derived organic matter
increased the N2O : N2ratio in the restored site. These results demonstrate that increasing floodplains hydrological connec-tion to the main river channel increases nitrogen retenconnec-tion and decreases nitrous oxide emissions.
1 Introduction
Floodplains are biogeochemical hot spots for carbon and ni-trogen cycling and storage (McClain et al., 2003). Depend-ing on the local morphology and hydrology (i.e. vegeta-tion, mean water depth, redox conditions, sediment type, and discharge pattern), floodplains can act either as carbon and nitrogen sinks via microbial respiration and denitrification or as sources via organic matter production or nutrient ex-port (Pinay et al., 2007). Flood pulses control organic car-bon transformations and processes in floodplains and can trigger an increase of bacterial enzyme activity (Burns and Ryder, 2001; Wantzen et al., 2008). Surface water-derived carbon and benthic organic carbon are adequate sources of energy for denitrification when floodplains are receiving high nitrate inputs during floods (Arango et al., 2007; Pfen-ning and McMahon, 1996). Yet, several results suggest that none of these factors alone control denitrification (Dodla et al., 2008; Sutton-Grier et al., 2009; Wall et al., 2005).
Denitrification, a particular form of microbial respira-tion, is a process controlled by O2, nitrate (NO−3), and C
4264 N. Welti et al.: Mimicking floodplain reconnection and disconnection availability (Knowles, 1982) which reduces nitrate (NO−3)to
nitrite (NO−2), nitric oxide (NO), nitrous oxide (N2O), and ultimately to dinitrogen (N2)(Zumft, 1997). Incomplete den-itrification results in the production of N2O, a greenhouse gas with 300 times the warming potential of CO2and a precursor molecule for ozone-depleting NO radicals in the stratosphere (Bates et al., 2008; Dickinson and Cicerone, 1986). With rates ranging from 0 to 345 µmol N m−2h−1, river systems are estimated to contribute approx. 1 Tg N yr−1to the global N2O emissions, with up to 80 % of denitrification occur-ring in soils and freshwater systems (Galloway et al., 2008; Seitzinger, 1988).
Denitrification efficiency has been shown to decline with rising nitrate concentrations, particularly in larger streams (Bernot and Dodds, 2005; Mulholland et al., 2008). In the Upper Mississippi, denitrification in the floodplains was ni-trate limited throughout the growing season, but the back-waters were capable of reacting quickly to a pulse of nitrate (Richardson et al., 2004). Increasing nitrate loads have also been shown to increase the N2O emissions in both field and laboratory experiments (Barnard et al., 2005; Verhoeven et al., 2006).
Dissimilatory nitrate reduction to ammonium (DNRA) and anammox, two other anoxic nitrate removal processes, are also of interest in floodplains (Burgin and Hamil-ton, 2007). DNRA has the same environmental requirements as denitrification (anoxia, high nitrate and carbon substrate availability), but rather than a removal pathway, bioreactive nitrogen is conserved and nitrate transformed into a more bio-available form (ammonium). Although DNRA has been reported as a significant pathway in marine and terrestrial systems accounting for 15–75 % of nitrate removal (An and Gardner, 2002; Morley and Baggs, 2010), it may be a mi-nor route of nitrate removal in wetland systems (Matheson et al., 2002; Scott et al., 2008). While there are few studies that explicitly measured DNRA rates in floodplains, DNRA bacteria have been shown to survive in frequently flooded areas (Sgouridis et al., 2011). With restoration, the ratio of denitrification: DNRA may change along with the changing morphology and substrate availability, thus altering the nitro-gen balance (Fazzolari et al., 1998). Anammox, the anaerobic oxidation of ammonium coupled to nitrite reduction with N2 as the end product, is present throughout the marine system, but its presence in floodplains is not well documented (Jet-ten, 2001). Few studies have measured this pathway of nitrate removal in freshwater systems, let alone in riverine flood-plains (Zhu et al., 2010). However, autotrophic NO3 assim-ilation can be a dominating pathway in freshwater ecosys-tems and perhaps even out-compete denitrification, DNRA and anammox for substrates (Hall et al., 2009; James, 2010). When water-column nitrate was the main nitrate source, Christensen et al. (1990) reported that denitrification was in-versely proportional to the thickness of the oxic surface layer, as nitrate has to diffuse through this layer, and proportional
to the nitrate concentration in the overlying water. By sup-plying the necessary substrate for bacterial growth, through which increased oxygen consumption decreases the thick-ness of the oxic zone, carbon supply directly stimulates deni-trification activity (Chalamet, 1986; Seitzinger, 1988). More-over, Kana et al. (1998) indicated that in situ denitrifying bac-teria respond rapidly to increases in nitrate concentration in the overlying water. Gross primary production, rather than community respiration, has been shown to control NO−3 up-take in streams (Hall and Tank, 2003). More primary pro-ducers (autotrophs) on the sediment surface would change the size of the oxic layer, which would not only drop the rate of denitrification but also disrupt the conversion of N2O to N2because N2O reductase is sensitive to changes in oxygen concentrations. In experiments conducted with soil-extracted bacteria, an oxic phase following anoxia decreased denitrifi-cation rates and resulted in more N2O production (Morley et al., 2008).
Historically in Europe, river floodplains have been decou-pled from their rivers, altering the natural nutrient spiraling. As a result, nutrients are transported downstream without be-ing incorporated into floodplain biogeochemical processes (Hein et al., 2004; Tockner et al., 1999). Recent floodplain restoration efforts involve reconnecting the floodplain to the river, reestablishing the flow regime and altering the nutri-ent load in the floodplain (Buijse et al., 2002). Restoration of large floodplains via surface water reconnection provides an opportunity to observe the effects of changing nitrogen and carbon pools on denitrification, DNRA and anammox activ-ity. Indeed, it is necessary to understand how these restora-tion efforts affect floodplain nitrogen removal and N2O emis-sions in riverine landscapes (Welti et al., 2012a).
We hypothesized that restoring the hydrological exchange between a river and its floodplain would enhance denitrifica-tion rates and decrease the N2O : N2ratio by increasing ni-trate and easily mineralizable organic carbon availability. We used mesocosm experiments of undisturbed sediment under controlled conditions to separate the effects of the riverine nitrate input and changes in DOM composition on the rate of anammox, DNRA, denitrification and the proportion of N2O produced. These experiments were done on two types of sediments: (1) disconnected and (2) reconnected (restored) floodplains of the Danube River, downstream Vienna, Aus-tria.
We tested this hypothesis by measuring the response of the denitrifying community of both disconnected and re-stored sites to pulsed or constant (over a five-day period) in-puts of15N-labeled nitrate. We also hypothesized that adding Danube River water would increase the denitrification rate in the disconnected site due to a more heterogeneous carbon pool (derived from a larger catchment area) present in the Danube River. The resulting N2O : N2ratio would decrease due to an increase of carbon substrate available.
2 Methods
2.1 Study site description
Two sites were chosen within the boundaries of the Allu-vial Zone National Park, located downstream of the city of Vienna, Austria. In this area, the Danube River is a 9th-order river with a drainage basin of 104 000 km2. The flow regime has an alpine character with variable and stochas-tic patterns (regulated low discharge = 915 m3s−1, mean dis-charge = 1930 m3s−1, annual flood discharge = 5300 m3s−1, 30 yr max, flood discharge = 9340 m3s−1).
The two chosen sites represent (1) a typical disconnected, backwater pool, located in the Lower Lobau floodplain, and (2) a reconnected channel site (restored) located in the re-stored floodplain Orth. Based on the difference in hydro-logical exchange condition, both floodplains developed dif-ferently, which has led to differences in sediment structure (Welti et al., 2012a). The restored site is connected via sur-face water exchange to the Danube main channel more often and for longer periods than the disconnected site (Table 1). The difference in hydrological conditions of the two sites also affects not only their sediment properties, but also wa-ter chemistry, with the restored site receiving frequent inputs of NO−3 from the Danube (Table 1). These sites were chosen because they represent two distinct floodplain morphologies (channel vs. pool) and were predicted by a model to react dif-ferently with increasing hydrological connection in terms of sediment respiration (Tritthart et al., 2011) and potential den-itrification (Welti et al., 2012b). In these previous studies, the mean sediment respiration and potential denitrification mea-sured at the selected sites over two years were very similar to the mean of the entire floodplain for the same time pe-riod (disconnected site DEA mean 55 ± 53.2 mg N m−2h−1 (N = 55), Lobau mean of 48.7 ± 52.8 mg N-N2O m−2h−1 (N = 204); restored site mean 2.1±0.9 (N = 72), Orth mean of 6.2±7.8 mg N-N2O m−2h−1(N = 120)) (Welti et al., 2012a). Therefore, despite both systems being heterogeneous, the chosen study sites can be considered representative for the majority of the landscape in their respective floodplain.
The Lower Lobau floodplain, downstream of Vienna, cov-ers approximately 23 km2. Except for groundwater-surface water exchange and a controlled small water intake, the pri-mary water exchange is through an artificial small breach in the flood levee located at the downstream end at river km 1908. This artificial opening in the flood protection dam allows limited connection to the main river at discharges above 1500 m3s−1(≈ 235 days yr−1). Three major retention structures with culverts prevent the side arms to fall com-pletely dry during low flow periods, resulting in shallow lake-like conditions throughout the floodplain. The selected dis-connected sampling site is typical of this floodplain as it is a shallow pool, dominated by groundwater flow and rarely connected to the Danube River via surface water.
High macrophyte coverage and stands of Phragmites sp. are present at this site.
The floodplain Orth is directly downstream of the Lower Lobau, covering approximately 5.5 km2 (Fig. 1), and fea-turing very diverse flow characteristics. Generally charac-terized as a through-flow system above a river discharge of 2230 m3s−1, some sites are only connected during higher discharges. Most of the historical retention structures present in the Orth floodplain have been removed in recent years, increasing the side-arm discharge significantly as well as the connection duration (Tritthart et al., 2009). The three openings (at river km 1906.5 and two at river km 1905) and one outlet (river km 1902) connect parts of this side-arm system to the main river at discharges of 4400 m3s−1 (≈ 7 days yr−1), 1500 m3s−1 (≈ 235 days yr−1), and less than 900 m3s−1(≈ 365 days yr−1), respectively. The selected re-stored sampling site is a flow-through channel site, bounded on one side by a gravel bend and the other by fine silt and sand. Macrophytes and other floating vegetation are not present at this site.
2.2 Mesocosm study preparation
Plexiglas mesocosms were used for core incubations. These mesocosms were 50 cm tall with a diameter of 24 cm and to-tal volume of 22.6 l. The bottom of the mesocosm was sealed tightly with a plate bolted to the mesocosm (Fig. 2).
Three sets of triplicate sediment cores (depth = 10 cm) and the overlying water (15–17 l) (n = 9) were taken from each site. All cores were sampled in non-vegetated areas. In the field, the mesocosms were emptied except for the last 2 l of water in order to maintain sediment saturation and anoxic conditions during transport. Black plastic sheeting was wrapped around the bottom of mesocosms in order to prevent light penetration into the sediment layer. Upon re-turning to the lab, the mesocosms were re-filled with in situ water, which had been collected and filtered on site (10 µm) to remove large phytoplankton assemblages, macrophytes, and coarse sediments. Triplicate cores were connected to a 40 l reservoir providing the experimental treatments. Water was pumped via a peristaltic pump from the reservoir to the individual cores at a rate of 5 l h−1, creating a residence time of approximately 2 h in each mesocosm. Water was recycled through the reservoirs for the entirety of experiment. The res-idence time was selected to maintain slow, but well-mixed conditions so that dissolved oxygen concentrations did not decrease over the five days. Mixing tests prior to the start of the experiments showed complete and non-turbulent mix-ing within the mesocosms. All mesocosms were completely closed to the atmosphere, but the reservoirs were open. Be-tween the mesocosm triplets and the reservoir, a filter (10 µm) prevented large phytoplankton assemblages from occurring and removed coarse suspended sediments. In order to pre-vent 29/30 N2 accumulation in the mesocosm cores, water in the reservoirs was bubbled with air before returning to the
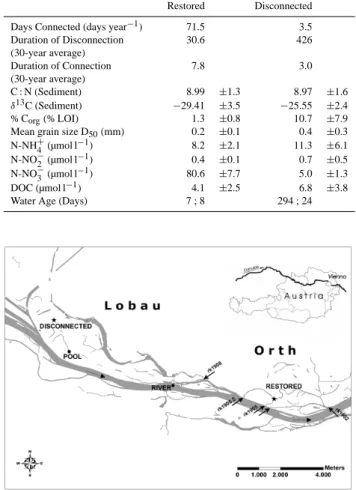
4266 N. Welti et al.: Mimicking floodplain reconnection and disconnection Table 1. Site description of hydrology, mean (±SD) sediment
car-bon pools, and in situ water chemistry prior to mesocosm incuba-tions. The two water ages refer to the two separate sampling days.
Restored Disconnected Days Connected (days year−1) 71.5 3.5
Duration of Disconnection (30-year average) 30.6 426 Duration of Connection (30-year average) 7.8 3.0 C : N (Sediment) 8.99 ±1.3 8.97 ±1.6 δ13C (Sediment) −29.41 ±3.5 −25.55 ±2.4 % Corg(% LOI) 1.3 ±0.8 10.7 ±7.9
Mean grain size D50(mm) 0.2 ±0.1 0.4 ±0.3
N-NH+4 (µmol l−1) 8.2 ±2.1 11.3 ±6.1
N-NO−2 (µmol l−1) 0.4 ±0.1 0.7 ±0.5 N-NO−3 (µmol l−1) 80.6 ±7.7 5.0 ±1.3
DOC (µmol l−1) 4.1 ±2.5 6.8 ±3.8 Water Age (Days) 7 ; 8 294 ; 24
38 Figure 1. Sampling sites are marked with stars; water exchange sites for Experiment 2 are marked with circles. Dashed arrows show the flow direction; solid arrows mark the openings to the Danube River.
Fig. 1. Sampling sites are marked with stars; water exchange sites
for Experiment 2 are marked with circles. Dashed arrows show the flow direction; solid arrows mark the openings to the Danube River.
mesocosms. All corers were kept at constant in situ water temperature at the time of sampling (range 19–22◦C) for the
entirety of the incubation with 12 h dark/light cycles.
2.3 Tracer addition experiments
In order to mimic the chemistry of a flood, two incubation se-tups were used – one to follow the effect of nitrate input (Ex-periment 1), the other to follow the effect of changing DOM composition (Experiment 2). Mesocosms were stabilized for 48 h until N-NO3 and N-NH4 reached constant concentra-tions. Following the 48 h stabilization period, labeled nitrate (K15NO3)was added to each of the treatments to quantify nitrate transformations throughout the experiments.
The purpose of Experiment 1 was to simulate the nitrate input of either flooding or long-term surface water reconnec-tion. Following the stabilization phase, the mesocosm either received (1) a spike addition (PEAK) of 15N-NO3 (target
39
Figure 2. Schematic of one mesocosm chamber setup. Each reservoir was connected to three
mesocosm chambers.
Fig. 2. Schematic of one mesocosm chamber setup. Each reservoir
was connected to three mesocosm chambers.
concentration: 130 µmol ± 10 %) or (2) a constant addition of15N-NO3to maintain a concentration of 75 µmol ± 10 % (PLATEAU). The control treatment (CONTROL N) received no increase in absolute nitrate concentration, but labeled15 N-NO3was added to increase15N to at least 20 AT%.
In Experiment 2, in situ water was replaced with water from (1) an open backwater pool in the Lobau (POOL) or (2) the Danube main channel (RIVER) in order to assess the role of the available organic matter source on denitrification rate and the N2O : N2ratio. For control treatment (CONTROL C), no water was exchanged and water originating from the sam-pling site was used. Once the chambers were re-filled,15 N-NO3was added to a concentration of 130 µmol ± 10 % to all treatments and kept constant for the five-day incubation in order to prevent N limitation for denitrification.
2.4 N measurements
Water-column sampling occurred through a tube extending into the water column, ending 1 cm above the sediment sur-face, separated from the atmosphere with a three-way stop-cock. Water samples for nutrients, dissolved gases, and iso-tope analysis were collected using the protocols established in the NICE handbook (Dalsgaard et al., 2000). Water sam-ples were taken at times 0, 2, 4, 8, 10, 24, 36, 48, 72, 96, and 108 h with a 60 ml syringe. Water samples (50 ml) for N-NH4, N-NO3, and N-NO2were filtered through a Whatman
GF/F filter (pore size 0.7 µm) and analyzed using a continu-ous flow analyzer (CFA, Systea Analytical Technologies).
Before the incubations, 50-g sediment subsamples were taken from the field site and again upon completion of the in-cubation from the incubated sediments. Nitrogen concentra-tions in the sediment were analyzed for N-NH+4 (KCl extrac-tion), N-NO−3, and N-NO−2 (H2O extraction) using standard colorimetric methods for a continuous flow analyzer (APHA, 1998; CFA, Systea Analytical Technologies). Organic matter content of the sediment fractions was determined as weight loss by ignition (LOI %) of dry sediment at 450◦C for 4 h.
Dry weight of the sediment samples was determined by oven-drying sediments at 70◦C to constant mass.
2.5 N species isotope composition
To measure the isotopic composition of N2 and N2O, wa-ter samples (50 ml) were collected by 60-ml plastic syringes equipped with a 10-cm-long Nalgene® tube at sampling times 0, 2, 4, 8, 10, 24, 36, 48, 72, 96, and 108 h. The sy-ringe was flushed with sample water prior to the transfer of the actual sample, and no bubbles were present during sam-pling. The water was transferred to a gas tight vial (12 ml Ex-etainer, Labco, High Wycombe, UK) which was filled with-out air bubbles and preserved with 250 µl ZnCl2(50 % m/v). N2 and N2O were extracted from the water in the Exe-tainers by introducing a helium headspace to remove 6 ml of water which was simultaneously replaced with an equiva-lent volume of He. Vials were shaken vigorously for 5 min so that more than 98 % of the N2and N2O equilibrium concen-tration was attained (Weiss, 1970). All vials were frozen and shipped to LMGEM (CNRS Marseilles, France) for analysis. Corrected against air, samples were measured for28N2,29N2, 30N
2,44N2O,45N2O,46N2O, Ar, and O2, with a mass spec-trometer (Quadruple mass specspec-trometer Anagaz 100, MKS, England) in the headspace.
Signals at different m/z values were collected every 0.5 s intervals and were stored by a desktop computer for later analysis. N2 was measured at m/z = 28, 29 and 30 corre-sponding to28N2,29N2and30N2, respectively, and O2 and Ar were measured at m/z = 32 and m/z = 40, respectively. Ar was used as an internal standard. Data were corrected for water-gas partitioning. The raw value collected at m/z = 30 was corrected according to Minjeaud et al. (2008) in or-der to take into account interference due to NOx ion for-mation from N2 and O+ inside the MS. Prior to the start of the mesocosm incubations, the individual N2O concen-trations were estimated from each core from the total N2O and CO2 concentrations measured at m/z 44, 45, 46, and corrected for CO2interference by separate analysis of CO2 concentrations by GC analyses (CO2 as CH4 concentra-tions using AGILENT 6890N, Santa Clara, USA, connected to an automatic sample-injection system DANI HSS 86.50, Headspace-sampler, Cologno Monzese, Italy). Upon com-pletion of the incubation, additional samples were measured
and used to certify that the correction remained within one standard deviation after five days. The initial correction value was used to avoid any adaption effects occurring during the incubation.
The isotopic composition of N-NO−3, N-NO−2 and N-NH+4 in the overlying water column and in the sediments was de-termined according to Lachouani et al. (2010) and measured on a 96-slot autosampler with a double-hole needle (GC-PAL, CTC Analytics, Zwingen, Switzerland) connected via a GasBench II headspace analyzer (Thermo Fisher, Bremen, Germany) to an IRMS (Delta V Advantage, SILVER lab, University of Vienna). Organic N and C concentration and isotope abundances from sediment samples were measured with an elemental analyzer (EA 1110, CE Instruments, Mi-lan, Italy) connected to an isotope ratio mass spectrometry IRMS (DELTAplus, Finnigan MAT, Bremen, Germany) in Vienna (SILVER Lab, University of Vienna).
2.6 Denitrification, anammox, and dissimilatory nitrate reduction to ammonium (DNRA)
At each time step, denitrification and anammox rates were calculated using the comprehensive method as outlined by Spott and Stange (2007). This approach allows for a precise calculation of the contribution of denitrification and anam-mox to an N2 mixture, while taking into consideration the contamination by atmospheric N2. The following calcula-tions Eq. (1)–(3) were used to determine the portion of atmo-sphere (A), denitrification (B), and anammox (C) contribut-ing to the N2mixture.
A =2b(α30−cd) + (c + d)(b 2−α 30) − (b2−cd)(α20+2α30) (a − b)[2(ab|cd)(a|b)(c|d)] (1) B =(cd − α30) + (c + d)(α30−α 2) + (α2−cd)(α 29+2α30) (a − b)[2(ab + cd) − (a + b)(c + d)] (2) C =2ab − α29(a + b) +2α30(1 − b − a) 2(ab + cd) − (a + b)(c + d) (3)
where α28, α29, and α30are the mole fractions of masses 28, 29, and 30 within the N2mixture and a, b, c, d are the15N atom fraction of N2(a), NO−3(b), NO−2(c), and NH+4(d).
The rate of dissimilatory nitrate reduction to ammonia (DNRA) was determined in the sediment after completion of the five-day incubation. Rates were calculated using Gilbert et al. (1997) Eq. (4):
DNRA = (AT%NH+4)([NH+4])
(AT % enrichment NO−3)(incubation duration) (4) where AT % NH+4 is the mole fraction of 15N-NH+4 deter-mined at the end of incubation. All rates were calculated per square meter for the upper 10 cm of the sediment layer.
The sum of masses 28, 29, and 30 (m28, m29, and m30)and the corrected sum of masses 44, 45, and 46 (m44, m45, and
m46)were used to calculate ratios of N2concentration pro-duced as an end product versus the concentration of N2O that
4268 N. Welti et al.: Mimicking floodplain reconnection and disconnection produced Eq. (5). The closer the ratio is to zero, the larger the
percentage of N2is produced relative to N2O. N2O
N2
=m44+m45+m46 m28+m29+m30
(5)
The percentage of used nitrogen was estimated for denitri-fication and DNRA, bacterioplankton production (BP), and biomass assimilation for each treatment. A C : N ratio of 5 : 1 was used to estimate the N-requirement for BP (Gruber and Galloway, 2008, references therein). All unaccounted nitro-gen loss was attributed to biomass assimilation.
2.7 Bacterioplankton and benthic bacterial production Bacterioplankton production (BP) was measured at times 0 h, 72 h, and 108 h according to Kirchman et al. (1986), while benthic bacterial production (BBP) was measured at time 0 and 108 h with a modified method of the Leu incorporation technique according to Wieltsching et al. (1999) and Fis-cher and Pusch (1999). Three replicate sub-samples taken from the sediment and two blanks (0.2 g) were weighted into 1.7 ml screw-cap microcentrifuge tubes. The samples were then incubated at in situ temperatures for 1 h. The incuba-tion was terminated by the addiincuba-tion of formaldehyde (final concentration = 3.2 %).
The fixed samples were vortexed, sonicated (10 min, 60 % power) in a sonication bath (Elma T 710 DH) and vortexed again. After this step, trichloroacetic acid (TCA) was added to a final concentration of 5 %. In order to dissolve the non-protein fraction of the cells, the samples were then incu-bated at 95◦C for 30 min. After cooling on ice, the remain-ing precipitate was filtered onto 0.2-mm-pore-size membrane filters (polycarbonate filters (Nuclepore)). Filters were thor-oughly rinsed with deionized water to eliminate unincorpo-rated leucine. Filters were then put into 7-ml scintillation vials and completely dissolved in 5 ml scintillation cocktail (Ultima Gold; Canberra Packard). Radioactivity was mea-sured in a Beckman 6500 scintillation counter. Controls were fixed with formaldehyde (final concentration, 3.2 %) imme-diately at the start of the incubation and generally contributed less than 10 % of the total leucine incorporation.
2.8 Dissolved organic matter (DOM) and dissolved
organic carbon (DOC) measurements
Dissolved organic matter (DOM) composition and dissolved organic carbon concentration (DOC) were measured from the water column at each time step for all mesocosms during the carbon exchange experiment. Fluorescence excitation– emission matrices (EEMs) – three-dimensional contour plots which display fluorescence intensities as a function of a range of both excitation and emission wavelengths – were used to characterize DOM (dissolved organic matter) com-position (Baker and Spencer, 2004).
The water samples were filtered through a prepared What-man GF/F filter (2.5 h at 490◦C; diameter 0.7 µm) and stored
in purged glass tubes (24 h in 10 % HCl, 4 h combusted at 490◦C) at 4◦C and analyzed within 24 h. DOC was
mea-sured using a TOC analyzer (Sievers 900).
The fluorescence measurements were undertaken using a Hitachi Fluorescence Spectrophotometer F-7000, and all samples were scanned in the following wavelength regions: excitation 200–400 nm at 5 nm steps and emission 280– 500 nm at 2 nm steps. Blank water scans were run before and after every sample run using Milli-Q water to measure the Raman signal at excitation 350 nm (emitted at 397 nm), and all results are standardized to a mean Raman peak of 150 intensity units.
For characterization of DOM, we used three fluorescence peaks (B, T and C) according to Coble (1996), fluorescence index (FI), beta to alpha (β : α) ratio, and the humification in-dex (HIX) . Peaks B and T were recorded at excitation wave-lengths of 225–275 nm and emission at wavewave-lengths of 300– 325 nm and 340–385 nm, respectively, and have been re-lated to protein-like substances (peak B = Tyrosine-like, peak T = Tryptophan-like) (Baker, 2001). Peak C is a fluorophore at 300–370 nm excitation and 400–500 nm emission and is attributed to humic-like substances. Ratios between the flu-orescence peaks (C, T, and B) and DOC were calculated to allow the partitioning of humic and protein-like DOM. The ratios T : DOC and B : DOC were summed to create a total protein-like pool of DOM in the overlying water column.
FI was calculated from excitation 370 nm as the ratio of in-tensities at 450 nm and 500 nm (McKnight et al., 2001). FI is inversely related to the lignin content of DOM, where values around 1.3 suggest a dominant terrestrial DOM and values around 1.8 suggest a dominant microbial DOM source. The
β: α ratio was calculated at excitation 310 nm from the emis-sion intensity at 380 nm divided by the emisemis-sion intensity maximum observed between 420 and 435 nm (Wilson and Xenopoulos, 2009). The β : α indicates the relative contri-bution of microbially derived autochthonous DOM (Huguet et al., 2009). Finally, HIX was calculated from excitation 255 nm as the ratio of the peak area under each curve at emis-sions 434–480 nm and 300–346 nm (Zsolnay et al., 1999). HIX values around 1–2 are associated with non-humified plant material, and values > 10 are commonly reported for fulvic acid extracts (Ohno, 2002).
2.9 Statistics
Mann-Whitney U tests were used to test differences between the sites and treatments. General linear models were used to assess the change of N species over time for the indi-vidual treatments. One-way independent ANOVA was used to test the change of N-species over time between the sites and treatments. Stepwise multiple linear regression models between water chemistry (N-NO−3, N-NO−2, N-NH+4), and carbon quality (Peaks C, T, and B and DOC concentration) were used to elucidate their overall influence on the den-itrification rate and ratio of N2O : N2. To compensate for
the experimental setup, which allows mixing of water be-tween the three cores and may reduce variation bebe-tween the triplicates, significance for all tests was set at p < 0.01 for comparisons within the treatments and p < 0.05 between the sites. All tests were performed using the SPSS software pack-age.
3 Results
3.1 Measured denitrification rates
Denitrification rates varied between sites but not among treatments or over time. In the restored site N2 fluxes were higher and had a larger range of rates with an aver-age of 5.7 mmol N2m−2h−1, whereas in the disconnected sites fluxes were significantly lower with an average of 0.6 mmol N2m−2h−1(U = 2520, p < 0.05).
More incomplete denitrification was measured at the dis-connected site than at the restored site with higher average calculated N2O : N2ratios in the control treatments (CON-TROL N and CON(CON-TROL C) (isolated mean 0.07 ± 0.02; re-stored mean 0.02 ± 0.01) (U = 5610 p < 0.001).
Since denitrification rates and N2O : N2 ratios did not change significantly over time at either site during any treat-ment (linear regression; R2<0.5, p > 0.05), all subsequent analyses use five-day averages. As well, no significant differ-ences were observed between the control replicates at either site for denitrification or the N2O : N2 ratio (disconnected;
p =0.98 and p = 1.0; restored p = 0.86 and p = 0.88, re-spectively).
We measured higher denitrification rates in the restored site compared to the disconnected site (U = 2520, p < 0.001) in treatments that did not receive nitrogen additions (Fig. 3). In addition, in these same treatments higher N2O : N2ratios (e.g. greater incomplete denitrification) were measured at the disconnected site than at the restored site (U = 5610, p < 0.001) (Fig. 4).
No anammox was detected during the five-day incubation at either site. DNRA rates were calculated after five days and were higher and more variable at the backwater site than in the restored site (U = 31.0, p <0.001) (Table 2).
3.2 Measured BP and BBP
BP and BBP were higher in the disconnected site (2.45 ± 1.26 µg C l−1h−1; 2063 ± 1040 µg C kg−1h−1, respectively) than in the restored site (1.94 ± 1.2 µg C l−1h−1; 1294 ± 331 µg C kg−1h−1, respectively) (U = 873, p < 0.05; U = 370, p < 0.001, respectively). 3.3 Experiment 1: effect of NO− 3 addition on denitrification rates 3.4 Disconnected site
The mean in situ N-NO−3 and N-NH+4 concentrations in the overlying water column measured prior to the incubation were 3.84 µM N-NO3and 16.4 µM N-NH4. The15N-NO3 ad-ditions increased the N-NO3 concentration and15N enrich-ment (AT %) in all core treatenrich-ments (34.7 µM, 88 AT % CON-TROL N; 106 µM, 95 AT % PLATEAU; 189 µM, 96 AT % PEAK). Within two hours, once mixing within the cores and the reservoir was complete, the PLATEAU and PEAK treat-ments reached the target concentrations of 75 µM N-NO3 and 130 µM N-NO3, respectively. The control treatment de-creased from the inde-creased addition to 25 µM N-NO−3 af-ter two hours. No significant difference was observed be-tween the treatments for the change in N-NH+4 (p = 0.25) and N-NO2 (p = 0.08) concentration over the incubation period. Denitrification rates and the N2O : N2 ratio were not significantly different between the three N treatments (CONTROL N, PEAK and PLATEAU) (F = 4.6, p = 0.06) (Fig. 3, 4). DNRA rates were an order of magnitude lower than denitrification rates (Table 2) and were also not signifi-cantly different between N treatments.
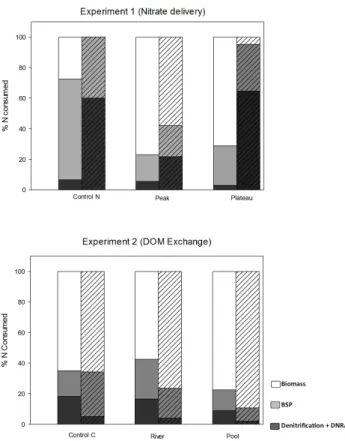
DOC increased significantly over the five days for all treat-ments (r2=0.80, p < 0.01) during the experiment and was not correlated with denitrification. In addition, NO−3 concen-tration was not correlated to denitrification rates in any treat-ment. But, changing the nitrate delivery regime (i.e. PEAK vs. PLATEAU) resulted in a significant (one-way indepen-dent ANOVA) decrease in the percentage of N consumed by BP between the treatments from 66 % (CONTROL N) to 17 % (PEAK) and 26 % (PLATEAU) (F = 35.5, p < 0.01) and increase in biomass assimilation from 27 % (CON-TROL N) to 77 % (PEAK) and 71 % (PLATEAU) (F = 35.6,
p <0.01) (Fig. 5). However, the estimated percentage of N uptake via denitrification did not change significantly and re-mained low (< 10 %) (F = 1.8, p = 0.2).
3.5 Restored site
The mean in situ N-NO−3 and N-NH+4 concentrations in the overlying water column were 74 µM N-NO−3 and 24.7 µM N-NH+4. Because the in situ concentration of N-NO−3 was higher than the goal concentration for the plateau treatment, water from another adjacent restored site was used. This site was pre-selected because of its similar DOM characteristics and average hydrology. The in situ N-NO−3 concentration at this site was 4.20 µM N-NO−3 at the sampling time. Tracer additions increased the N-NO3 concentrations in all meso-cosm treatments (140.1 µM N-NO−3, 51 AT % CONTROL N; 111.0 µM N-NO−3, 90 AT % PLATEAU; 171.9 µM N-NO−31, 60 AT % PEAK). Within two hours, once mixing within the mesocosms and the reservoir was complete, the PLATEAU
4270 N. Welti et al.: Mimicking floodplain reconnection and disconnection Table 2. Mean DNRA rates (n = 3) measured and standard
devia-tion in the sediment after five-day incubadevia-tion.
Site Treatment DNRA
(µmol N m−2h−1) Disconnected CONTROL N 1.7 ±0.1 PEAK 1.5 ±0.3 PLATEAU 1.5 ±0.7 Restored CONTROL N 2.7 ±3.1 PEAK 2.8 ±3.5 PLATEAU 0.9 ±0.6 Disconnected CONTROL C 15.1 ±12.3 POOL 15.7 ±12.9 RIVER 22.7 ±19.8 Restored CONTROL C 0.1 ±0.1 POOL 0.0 ±0.0 RIVER 0.3 ±0.3
and PEAK treatments reached the target concentrations of 75 µM N-NO−3 and 130 µM N-NO−3, respectively. The control treatment decreased from the initial increase to 123 µM N-NO−3 after 2 h. A significant difference was ob-served between the treatments for the change in N-NH+4 con-centration over time (p = 0.03) but not for N-NO2 concen-tration (p = 0.08) over the incubation period.
Denitrification rates ranged from 0.6– 8.6 mmol N m−2h−1 (mean = 1.1 ± 1.9 mmol N m−2h−1)
(Fig. 3). Denitrification rates and the N2O : N2 ratios were not significantly different between the nitrogen treatments (p = 0.32, p = 0.91, respectively) (Fig. 4). DNRA rates were low in all treatments (Table 2).
Changing the nitrate delivery regime significantly de-creased (one-way independent ANOVA) the estimated nitro-gen use by BP from 40 % (CONTROL N) to 20 % (PEAK) and 30 % (PLATEAU) (F = 9.4, p < 0.01) (Fig. 5). Al-though assimilation was estimated to be < 1 % in the con-trol treatment, due to the high standard deviation in the treat-ments, the increase of biomass assimilation was not signif-icant (F = 2.3, p = 0.2). No signifsignif-icant changes were esti-mated for denitrification (F = 1.5, p = 0.3).
3.6 Experiment 2: effect of carbon quality on denitrification rate and on N2O : N2ratio
3.7 Disconnected site
Prior to the water exchange, the in situ concentrations of NO3 and NH4 were 6.0 µM N-NO−3 and 5.8 µM N-NH
+
4, respectively. Tracer additions increased the N-NO−3 con-centrations in all treatments to 225.4 µM, 95 AT % (CON-TROL C), 183.7 µM, 95 AT % (POOL) and 189.9 µM, 45 AT % (RIVER). Within two hours, all treatments reached the target concentrations of 130 µM (140.7 µM CON-TROL C; 131.2 µM POOL; 149 µM RIVER). Once the tar-get concentration was reached, N-NO−3 was kept constant by an addition of N-NO−3 after each sampling time. No
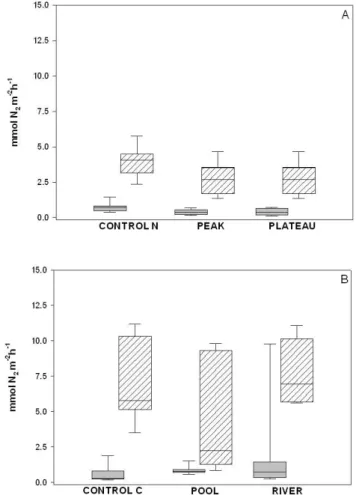
sig-40 Figure 3. Denitrification rates as measured over 5 days in (A) Experiment 1: NO3 and (B)
Experiment 2: DOM changes. Grey boxes are measurements from the disconnected site, hatched boxes from the restored site. Whiskers extend to the 95th and 5th percentiles. N=33
Fig. 3. Denitrification rates as measured over five days in (A)
Ex-periment 1: NO−3 and (B) Experiment 2: DOM changes. Grey boxes are measurements from the disconnected site, hatched boxes from the restored site. Whiskers extend to the 95th and 5th percentiles.
N =33.
nificant difference was observed between the treatments for the change in N-NH+4 concentration over time (p = 0.07) but was observed for N-NO2concentration (p < 0.01).
In situ DOC varied from 2.6 mg l−1in the Danube River and 13.2 mg l−1in the open pool site (13.2 mg l−1). In situ DOC concentrations in the disconnected site were in between these two extremes with an average of 6.9 mg l−1(Table 3). In two of the three treatments, the DOC increased signifi-cantly over the five-day incubation (CONTROL r2=0.35
p =0.01; RIVER r2=0.82 p < 0.01; POOL r2=0.01 p = 0.97). Although the DOC was lowest in the Danube River water, the ratios of T : DOC and B : DOC were highest at this site (Table 3) (one-way ANOVA p < 0.01 and p < 0.01) in-dicating a high content of protein-like DOC.
Denitrification rates ranged from 0.02– 10.7 mmol N m−2h−1, and were not significantly different between treatments (F = 2.9, p = 0.06) (Fig. 3). The N2O : N2 ratios were different (Fig. 4) between the CON-TROL C and the two treatments (p < 0.001) with a further
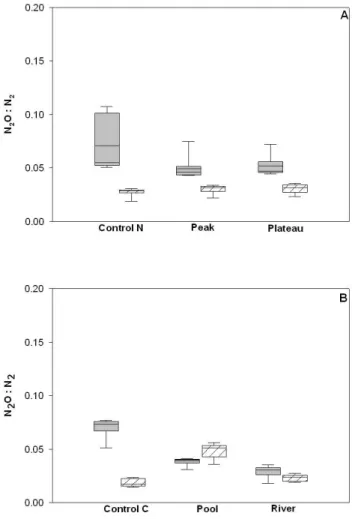
41 Figure 4. Calculated N2O:N2 ratios over the 5 day incubation from (A) Experiment 1: NO3- and
(B) Experiment 2: DOM changes. Grey boxes are measurements from the disconnected site, hatched boxes from the restored site. Whiskers extend to the 95th and 5th percentiles. N=33
Fig. 4. Calculated N2O : N2 ratios over the five-day incubation
from (A) Experiment 1: NO−3 and (B) Experiment 2: DOM changes. Grey boxes are measurements from the disconnected site, hatched boxes from the restored site. Whiskers extend to the 95th and 5th percentiles. N = 33.
decrease between RIVER and POOL (one-way ANOVA
p <0.001).
No significant differences in DNRA rates were observed between any of the treatments (p = 0.13) and ranged from 15–22 µmol N m−2h−1(Table 2). The percentage of N used did not change significantly between treatments, with denitri-fication accounting for < 20 %, BP < 20 % and assimilation
>50 % in all treatments (one-way independent ANOVA) (F = 0.6, p = 0.6; F = 4.3, p = 0.07; F = 1.2, p = 0.4, re-spectively).
3.8 Restored site
Prior to the water exchange, the in situ concentrations in the restored site were 89.3 µM N-NO−3 and 1.9 µM N-NH+4. Tracer additions increased the N-NO−3 concentration in all treatments to 159.5 µM, 49 AT % (CONTROL C), 188 µM, 96 AT % (POOL) and 152 µM, 60 AT % (RIVER). Within two hours, two treatments reached the target concentrations
of 130 µM (137 µM POOL; 135 µM RIVER). The control treatment reached the target concentration (144 µM) within 4 h. No significant difference was observed between the treat-ments for the change in N-NH+4 (p = 0.25) and N-NO2 (p = 0.45) concentration over the incubation period.
At the restored site DOM was higher in overall protein-like carbon relative to the dissolved organic carbon pool (T+B: DOC) than the disconnected site in the water column (U = 521, p < 0.001) (Table 3). Yet, the DOC at the dis-connected site was significantly higher (U = 957, p < 0.01) than at the restored site. Using the calculated ratios for FI, HIX, and β : α to distinguish the DOM characteristics in the water column, small but significant differences were only ob-served for HIX and β : α between the sites (U = 36, p < 0.01; U = 0.5 p < 0.01, respectively) with the disconnected site having higher humic content in the DOM pool than the restored site (Table 3).
The in situ DOC was very similar to the Danube River. The water from the Danube River was highest in protein-like DOM. DOC increased slightly over the five-day incubation in the POOL treatment (Control r2=0.14 p = 0.23; RIVER
r2=0.03 p = 0.59; POOL r2=0.38 p < 0.01). No signif-icant differences in the measured denitrification rates were observed between the two control treatments (CONTROL N and CONTROL C) for either site (p = 1.0). No significant differences in DNRA were observed between the POOL and RIVER treatments (F = 1.29, p = 0.329).
A significant increase of the N2O : N2ratio was observed between the CONTROL C and POOL treatments (p < 0.01), but not between the CONTROL C and RIVER treatments. DNRA rates remained low in all treatments (Table 2). No change was measured in the estimated percentage N uptake for denitrification (< 10 %), BP (9–30 %) and assimilation (66–90 %) (One-way independent ANOVA) (F = 1.1, p = 0.4; F = 2.9, p = 0.1; F = 3.1, p = 0.1, respectively).
3.9 Factors influencing N2O : N2ratio
All water chemistry and DOM quality data were combined by sites and treatments in Experiment 2 to investigate their effect on denitrification rates and N2O : N2ratios in the sites. A stepwise regression was used for the N2O : N2ratio (R2=
0.67). In the final regression model three variables entered significantly. N-NO−2 concentration in the water column was positive/negative, whereas the proportion of humic-like car-bon relative to the total DOC pool (C : DOC) was positively related to the N2O : N2ratio and the total protein-like carbon pool relative to the total DOC pool (T : DOC + B : DOC) was negatively related (Table 4).
3.10 Mass balance
Based on our mass balance estimate, biomass assimilation by algae and bacteria was estimated to be the main biological mechanism of N retention in the disconnected site (Fig. 5).
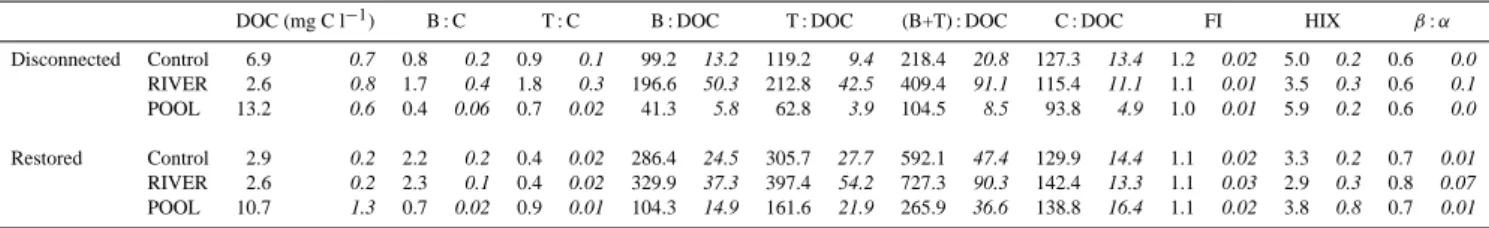
4272 N. Welti et al.: Mimicking floodplain reconnection and disconnection Table 3. Dissolved organic matter quality and dissolved organic carbon (DOC) over five days and standard deviation in italics (N = 33).
Peaks B and T occur at excitation wavelengths of 225–275 nm and emission at wavelengths of 300–325 nm and 340–385 nm, respectively, and have been related to protein-like substances (peak B = Tyrosine-like, peak T = Tryptophan-like). Peak C is a fluorophore at 300–370 nm excitation and 400–500 nm emission and is attributed to humic-like fluorescence. Fluorescence index (FI) β : α ratio and the humification index (HIX) were calculated using the fluorescence peaks as described in the methods.
DOC (mg C l−1) B : C T : C B : DOC T : DOC (B+T) : DOC C : DOC FI HIX β: α Disconnected Control 6.9 0.7 0.8 0.2 0.9 0.1 99.2 13.2 119.2 9.4 218.4 20.8 127.3 13.4 1.2 0.02 5.0 0.2 0.6 0.0 RIVER 2.6 0.8 1.7 0.4 1.8 0.3 196.6 50.3 212.8 42.5 409.4 91.1 115.4 11.1 1.1 0.01 3.5 0.3 0.6 0.1 POOL 13.2 0.6 0.4 0.06 0.7 0.02 41.3 5.8 62.8 3.9 104.5 8.5 93.8 4.9 1.0 0.01 5.9 0.2 0.6 0.0 Restored Control 2.9 0.2 2.2 0.2 0.4 0.02 286.4 24.5 305.7 27.7 592.1 47.4 129.9 14.4 1.1 0.02 3.3 0.2 0.7 0.01 RIVER 2.6 0.2 2.3 0.1 0.4 0.02 329.9 37.3 397.4 54.2 727.3 90.3 142.4 13.3 1.1 0.03 2.9 0.3 0.8 0.07 POOL 10.7 1.3 0.7 0.02 0.9 0.01 104.3 14.9 161.6 21.9 265.9 36.6 138.8 16.4 1.1 0.02 3.8 0.8 0.7 0.01
The portioning of N retention was not affected by the experi-mental treatments (NO3or DOM quality). However, the low replicates (n = 3) and high standard deviation did not allow us to calculate significance (Mann-Whitney U ) (Fig. 5).
4 Discussion
We found high denitrification rates at both restored and dis-connected sites within the floodplain of the Danube River thus indicating the importance of microbial nitrate removal. Our rates are on the high side of global estimates for rivers (up to 0.7 mmol N m−2h−1)(Pina-Ochoa and Alvarez-Cobelas, 2006) and those for headwater streams (0.01– 0.1 mmol N m−2h−1Mulholland et al., 2008).
4.1 Importance of connected floodplains
Higher denitrification rates were measured in the restored site compared to the disconnected site. A similar trend in higher denitrification rates has also been documented for wetlands connected to the Po River (Racchetti et al., 2010). Higher denitrification rates (94 mg N m−2h−1, ca. 279 µmol m−2h−1) were estimated by James (2010) for a backwater system of the Mississippi River, which receives similar N-NO−3 inputs from the river, accounting for 57 % of nitrate removal. This highlights the buffer capacity of floodplains and the potential for nitrate removal therein, which can be up to 100 % of a river’s nitrate load (Fennessy and Cronk, 1997). Accordingly, nitrate concentrations in the floodplain lakes of the Wisconsin River declined below de-tection level after being disconnected for 6 days from the river channel (Forshay and Stanley, 2005). Flooding tends to increase NO−3 concentrations and has a similar effect on denitrification rates even in disconnected channels (Hein et al., 1999).
The importance of floodplain connection is even more significant when we estimate denitrification rates on an an-nual basis. Indeed, using our measured denitrification rates and the restored Orth floodplain average yearly discharge of approx. 2000 m3h−1, we calculate that the restored flood-plain would reduce 130 µmol l−1N-NO−3 within 24 h,
com-Table 4. Predictor variables and coefficients (β) influencing the
cal-culated five-day N2O : N2ratio.
β Constant N-NO−2 µmol 0.44∗ C : DOC 0.62∗ T : DOC + B : DOC −0.83∗ ∗p <0.001 Dependent variable: N2O : N2 R2=0.67
pared to the estimated 6 days that it would take in the Lobau floodplain. Previous models have estimated that denitrifica-tion rates are highly variable in these floodplains (Welti et al., 2012a, b). As such, sites within the Lobau floodplain that receive more frequent inputs from the Danube River can have denitrification rates similar to those measured in the Orth floodplain. While measuring only two sites within these dy-namic and variable floodplains is a limitation of this study, we have nevertheless demonstrated that floodplain reconnec-tion can have a significant impact on sediment biogeochemi-cal processes. Restoration, however, does not just solely im-pact the biogeochemical processes, but rather changes sev-eral properties of floodplain waterbodies (Welti et al., 2012a). Higher, but variable, denitrification rates were consis-tently measured at the restored site compared to the dis-connected site, demonstrating higher denitrification capacity when floodplains are linked to the river (Fig. 3). As well, restored site undergoes a more complete denitrification as N2O : N2 ratios are lower compared to disconnected sites. This increased incomplete denitrification in the disconnected sites could be due to differences in the microbial community structure (Philippot, 2002).
We found a delayed increase of 15N-NH+4 in the wa-ter column, following the 15N-NO3 addition, which sug-gests biomass assimilation of NO−3 and subsequent ammo-nia release. The communities in the water column may out-compete denitrification for both nitrogen and organic car-bon via nitrification (Dodds et al., 2000; Sloth et al., 1995),
42
Figure 5. Estimated percentage of total N pool used by denitrification and DNRA (dark gray), bacterial secondary production (middle gray) and biomass assimilation (light gray) using the 5 days averages. Solid bars are estimates from the disconnected site, hashed bars from the restored site. N=3
Fig. 5. Estimated percentage of total N pool used by
denitrifica-tion and DNRA (dark gray), bacterial secondary producdenitrifica-tion (middle gray) and biomass assimilation (light gray) using the five-day aver-ages. Solid bars are estimates from the disconnected site, hashed bars from the restored site. N = 3.
resulting in a decoupling between the water column and the anoxic sediment layer. Despite being short term, biomass as-similation can provide a rapid sink for nitrate (Gribsholt et al., 2009; Hefting et al., 2005). Biological assimilation and BP and BBP seem to be of more importance than denitri-fication, accounting for the majority of DIN uptake in both systems (Fig. 5).
Due to the addition of nitrate in the mesocosm treat-ments, it was not possible to calculate nitrification rates for these sediments. However, as the concentration of ammonia present in the water columns was considerably less than that of nitrate (Disconnected site approx. 40:1, restored site ap-prox. 100:1), water column nitrification may not be an impor-tant source of nitrate or N2O in these ecosystems. In future studies, the coupled use of 15N-NH4 and15N-NO3 would provide useful insight on this pathway.
In many constructed wetlands, up to 36 % of nitrate loss can be accounted for via anammox (Scott et al., 2008), sug-gesting that this pathway could complement the nitrate re-moval process. However, we did not find anammox to be an important pathway in this floodplain system. Another path-way, DNRA, was detected to occur in our sites but was es-pecially low in these floodplains. DNRA tends to increase in
sites with high carbon and vegetation (Matheson et al., 2002; Fazzolari et al., 1998). In our study, the disconnected site was higher in overall C and terrestrially rooted vegetation than the restored site, which might explain the observed differences between the DNRA rates in our two study sites (in the dis-connected site, DNRA was 3 % of denitrification while it was 0.1 % in the restored one). Despite these differences, DNRA does not appear to be a quantitatively important pathway, as these rates were an order of magnitude lower than denitrifi-cation in both sites.
4.2 NO−3 as a regulator of denitrification
Denitrification rates and denitrifier efficiency (as shown by N2O : N2)in stream sediments vary with nitrate concentra-tion and discharge (Alexander et al., 2009). We predicted that, due to the high supply of carbon and anoxic condi-tions in the disconnected sediments, the disconnected site would be nitrate-limited, as has been demonstrated in dif-ferent riverine sediments (Forshay and Stanley, 2005; Hill et al., 2000; Silvennoinen et al., 2008), streams (Smith et al., 2006), constructed wetlands (Scott et al., 2008) and estu-aries (Teixeira et al., 2010). Therefore, by increasing the ni-trate concentration in the water column of the disconnected site, which is high in organic carbon, we expected to mea-sure a corresponding increase in denitrification. However, the addition of nitrate did not increase denitrification rates im-plying that denitrification at both sites was not nitrate lim-ited (Table 2). After five days of constantly elevated NO−3 concentrations, no adaptation effects were observed in the denitrification rate for either site or any treatment. While the percentage of N used by denitrification did not change with the treatments, the estimated amounts for assimilation and BP did, suggesting that these processes can react quickly with changes in nitrate concentration (Fig. 5). The oppo-site trends observed (increasing assimilation, decreasing BP) in the disconnected site suggest that algal assimilation can out-compete the heterotrophs for the available nitrogen. Our mass balance approach may over-estimate assimilation into biomass by attributing lost N to this pool, but it neverthe-less indicates that a large portion of N can be used up by autotrophs and heterotrophs.
Although we did not measure bacterial density or micro-bial community structure in this study, previous studies have shown that the bacterial community is conditioned to re-spond quickly and efficiently to flooding events (S´anchez-P´erez, 2003). Nitrogen saturation can occur when bacte-rial communities are overloaded with constantly elevated nitrate concentrations. However, in pulsed systems with short-term increases (ex-floodplains), the bacterial commu-nities may not experience this overloading and can be stim-ulated by such pulses (Bernot and Dodds, 2005; Burns and Ryder, 2001). In this study, the restored floodplain typically receives frequent pulsing from the river which could be a rea-son for the described differences in denitrification rates.
4274 N. Welti et al.: Mimicking floodplain reconnection and disconnection 4.3 Effects of DOM composition on denitrification
Dynamic floodplains are affected by the complete exchange of their water mass with that of the river water. This changes the available organic carbon substrate pool, originating in the riverine water column, to the bacterial community, located in the sediment of the floodplain. By changing the overlying water column in the mesocosms, we altered the available or-ganic carbon pool quantity and quality. Our hypothesis that increasing the DOC and NO3would stimulate denitrification was not supported (Fig. 3).
However, we found that the additional DOM changed the ratio of N2O : N2 between the sites and treatments. Gener-ally, the ratio of N2O : N2 was lower in the restored site (Fig. 3), implying that denitrification was more efficient. N2O production has been related to high organic sediment content and eutrophic environments (Kenny et al., 2004; Sloth et al., 1995; Teixeira et al., 2010), which are the condi-tions found at both sites. However, when riverine water was added to the disconnected site (i.e. mimicking a reconnection event), the N2O : N2ratio decreased, increasing the fraction of denitrification resulting in N2. The reverse was true when water from a backwater site was added to the restored site (i.e. mimicking a long-lasting disconnection event), increas-ing N2O over N2production.
It was not the purpose of this study to investigate the different available substrates in each of the source waters, but rather the effect of the mixture of substrates on deni-trification. In soils with changing oxygen conditions, it has been demonstrated that the carbon source becomes impor-tant for N2O production (Morley and Baggs, 2010). Using the three DOM indices, we observed minor, but significant, differences in the carbon pools of the Danube River and the floodplains (mostly a dominant terrestrial DOM source and non-humified plant material). The HIX and FI of both sites were in the range associated with humic material and suggest DOM of primarily allochthonous origin. Neverthe-less, the β : α ratio was higher in the restored site, indicat-ing a higher contribution of recently derived autochthonous microbial DOM. As well, as shown by the T+B : DOC ra-tios, the compositions of the DOM pools between the source waters were significantly different: the Danube River had lower DOC compared to waters originating from the back-waters, but this carbon pool was more protein-dominated and therefore more bio-available (labile) to the sediment microbe community (Table 3). This difference could be the reason for the different responses in the N2O : N2ratio we observed. In the disconnected system, where the oxic layer may be chang-ing diurnally due to a higher number of autotrophs, the same co-regulation between oxygen and carbon source may be oc-curring (Christensen et al., 1990; Laursen, 2004).
The composition of the DOM pool is indeed an impor-tant predictor variable in the regression model produced for the ratio of N2O : N2. The negative relationship between the relative proportion of protein-like carbon and the N2O : N2
suggests that protein-like DOC reduces the N2O : N2 ratio, resulting in more N2production. The appearance of NO−2 in the multiple regressions can be interpreted as a proxy for ni-trogen cycling. Nitrate was kept in constant abundance in the experiment, but NO−2 increased throughout the incubation period, a result of NO−3 reduction. DOM originating from the Danube River has been shown to be a mixture of terres-trially and microbially derived sources, depending on the dis-charge and season (Besemer et al., 2009; Peduzzi et al., 2008; Preiner et al., 2008). Previous studies have suggested that OC is primarily derived from terrestrial sources (dominated by protein-like signatures) during average flow conditions (Hein et al., 2004). However during high discharge, more humic carbon may be transported into the floodplains.
4.4 Importance of restoration
In this study, the restored site experienced an increase in den-itrification rates compared to the disconnected site, suggest-ing that increassuggest-ing the continuous and long-lastsuggest-ing surface water connection periods will increase the overall denitri-fication rate as well as its efficiency (Kjellin et al., 2007; Klocker et al., 2009; Racchetti et al., 2010). Yet, as shown in Experiment 1, increasing nitrate concentration does not lead to higher denitrification rates in short time. Rather, changing water sources led to changes in the N2O : N2ratio. Therefore, prolonged connection to the river may increase the denitrifi-cation efficiency; however, surface water connections solely during floods will not increase the overall, long-term den-itrification efficiency as these sites do not respond quickly to an increase of NO3. Previous work modeled the response of the N2O : N2ratio in the similar floodplains at the flood-plain scale, which predicted similar responses of potential denitrification enzyme activity (DEA) to flooding (Welti et al., 2012b).
In the case of the studied restored floodplain, opening the embankments and allowing the Danube water to pulse into the floodplain changed the flow pattern and physical charac-teristics of the site. The restored site was in a channel dom-inated by a gravel bed, whereas the disconnected site was a shallow pool higher in organic material and fine sediments. In the restored floodplain (Orth), the depth of sediment as well as the sediment organic substrates decreased with the level of connection to the Danube (Reckendorfer, 2006). Compared to the disconnected floodplain (Lobau), which covers more surface area with finer and more organic-rich sediments, the absolute area available for denitrification was lower. Reconnection of the Lobau floodplain would increase the rate of denitrification and lower overall N2O production, resulting in a net gain of ecosystem services. Along with the changes in denitrification, increasing the surface water con-nection could prime the benthic and pelagic algal commu-nities, thus increasing the nutrient retention capacity of the floodplain (Ahearn et al., 2006; Scott et al., 2009).
In this study, we demonstrated that while denitrification rates were not directly influenced by NO−3 or DOC in the overlying water, the end product of denitrification was con-trolled by changes of carbon quality in the overlying wa-ter column. By increasing the frequency of flooding into the backwaters, N2O production could be mitigated and the NO−3 removal capacity of the floodplain could be increased. Cre-ating regular surface water connection to the Danube River would reduce N2O emissions by 50 % in the disconnected site. Hydrologic pulsing has been shown to decrease green-house gas emissions, organic matter accumulation and in-crease nutrient retention (Mitsch et al., 2008). In terms of ecosystem management and restoration, it is apparent that frequent, longer-lasting pulsing creates ideal conditions for efficient denitrification, resulting in lower N2O production.
Acknowledgements. This project was funded by the Austrian
Science Fund (FWF) project CANFLOOD (P19907-B17) and the Austrian Committee Danube Research of the International Association of Danube Research. We would like to acknowl-edge C. Hinterleitner for sediment and water nutrient analysis, S. Preiner and M. Felkl for their help in the field, P. Lachouni and B. Hood-Nowotny for their help with the isotope analyses, E. Lautsch for statistical guidance, and the two anonymous reviewers, G. Weigelhofer, O. Madakacherry, and M. Xenopou-los for their helpful comments on earlier versions of the manuscript. Edited by: J. Middelburg
References
Ahearn, D. S., Viers, J. H., Mount, J. F., and Dahlgren, R. A.: Prim-ing the productivity pump: flood pulse driven trends in suspended algal biomass distribution across a restored floodplain, Freshwa-ter Biol., 51, 1417–1433, 2006.
Alexander, R., B¨ohlke, J., Boyer, E., David, M., Harvey, J., Mul-holland, P., Seitzinger, S., Tobias, C., Tonitto, C., and Wollheim, W.: Dynamic modeling of nitrogen losses in river networks un-ravels the coupled effects of hydrological and biogeochemical processes, Biogeochemistry, 93, 91–116, 2009.
An, S. and Gardner, W. S.: Dissimilatory nitrate reduction to ammo-nium (DNRA) as a nitrogen link, versus denitrification as a sink in a shallow estuary (Laguna Madre/Baffin Bay, Texas), Marine Ecol-Prog. Ser., 237, 41–50, 2002.
APHA: Standard Methods for the Examination of Water and Wastewater, 20th Edn., American Public Health Association, Washington DC, USA, 1998.
Arango, C. P., Tank, J. L., Schaller, J. L., Royer, T. V., Bernot, M. J., and David, M. B.: Benthic organic carbon influences denitrifica-tion in streams with high nitrate concentradenitrifica-tion, Freshwater Biol., 52, 1210–1222, 2007.
Baker, A.: Fluorescene Excitation-Emission Matrix Characteriza-tion of some sewage-impacted rivers, Environ. Sci. Technol., 35, 948–953, 2001.
Baker, A. and Spencer, R. G.: Characterization of dissolved organic matter from source to sea using fluorescence and absorbance spectroscopy, Sci. Total Environ., 333, 217–232, 2004.
Barnard, R., Leadley, P. W., and Hungate, B. A.: Global change, nitrification, and denitrification: A review, Global Biogeochem. Cy., 19, GB1007, doi:10.1029/2004gb002282, 2005.
Bates, B. C., Kundzewicz, Z. W., Wu, S., and Palutikof, J. P. (Eds.): Climate Change and Water, Technical Paper of the Intergovern-mental Panel on Climate Change, IPCC Secretariat, Geneva, 210 pp., 2008.
Bernot, M. J. and Dodds, W. K.: Nitrogen Retention, Removal, and Saturation in Lotic Ecosystems, Ecosystems, 8, 442–453, 2005. Besemer, K., Luef, B., Preiner, S., Eichberger, B., Agis, M.,
and Peduzzi, P.: Sources and composition of organic matter for bacterial growth in a large European river floodplain sys-tem (Danube, Austria), Organic Geochemistry, 40, 321–331, doi:10.1016/j.orggeochem.2008.12.005, 2009.
Buijse, A. D., Coops, H., Staras, M., Jans, L. H., Van Geest, G. J., Grift, R. E., Ibelings, B. W., Oosterberg, W., and Roozen, F. C. J. M.: Restoration strategies for river floodplains along large lowland rivers in Europe, Freshwater Biol., 47, 889–907, 2002. Burgin, A. J. and Hamilton, S. K.: Have we overemphasized the
role of denitrification in aquatic ecosystems? A review of nitrate removal pathways, Front. Ecol. Environ., 5, 89–96, 2007. Burns, A. and Ryder, D. S.: Response of bacterial extracellular
en-zymes to inundation of floodplain sediments, Freshwater Biol., 46, 1299–1307, 2001.
Chalamet, A.: Effects of environmental factors on denitrification, in: Denitrification in the Nitrogen Cycle: NATO Conference Series, edited by: Golterman, H., 1: Ecology, Plenum Press, New Your, 7–9, 1986.
Christensen, P. B., Nielsen, L. P., Sorense, J., and Revsbech, N. P.: Denitrification in nitrate-rich streams: Diurnal and seasonal vari-ation related to benthic oxygen metabolism, Limnol. Oceanogr., 35, 640–651, 1990.
Coble, P.: Characterization of marine and terrestrial DOM in sea-water using excitation-emission matrix spectroscopy, Marine Chemistry, 51, 325–346, 1996.
Dalsgaard, T., Nielsen, L. P., Brotas, V., Viaroli, P., Underwood, G., Nedwell, D. B., Sundb¨ack, K., Rysgaard, S., Miles, A., Bar-toli, M., Dong, L. F., Thornton, D., Ottosen, L., Castaldelli, G., and Risgaard-Petersen, N.: Protocol Handbook for NICE-Nitrogen Cycling in Estuaries: a project under the EU research programme: Marine Science and Technology (MAST III), Na-tional Environmental Research Insititue, Silkeborg, Denmark, 62 pp., 2000.
Dickinson, R. E. and Cicerone, R. J.: Future global warming from atmospheric trace gases, Nature, 319, 109–115, 1986.
Dodds, W. K., Evans-White, M. A., Gerlanc, N. M., Gray, L., Gud-der, D. A., Kemp, M. J., L´opez, A. L., Stagliano, D., Strauss, E. A., Tank, J. L., Whiles, M. R., and Wollheim, W. M.: Quantifi-cation of the Nitrogen Cycle in a Prairie Stream, Ecosystems, 3, 574–589, 2000.
Dodla, S. K., Wang, J. J., DeLaune, R. D., and Cook, R. L.: Den-itrification potential and its relation to organic carbon quality in three coastal wetland soils, Sci. Total Environ., 407, 471–480, doi:10.1016/j.scitotenv.2008.08.022, 2008.
Fazzolari, ´E., Nicolardot, B., and Germon, J. C.: Simultaneous ef-fects of increasing levels of glucose and oxygen partial pressures on denitrification and dissimilatory nitrate reduction to ammo-nium in repacked soil cores, Eur. J. Soil Biol., 34, 47–52, 1998.