HAL Id: hal-03235955
https://hal.archives-ouvertes.fr/hal-03235955
Submitted on 26 May 2021
HAL is a multi-disciplinary open access
archive for the deposit and dissemination of
sci-entific research documents, whether they are
pub-lished or not. The documents may come from
teaching and research institutions in France or
abroad, or from public or private research centers.
L’archive ouverte pluridisciplinaire HAL, est
destinée au dépôt et à la diffusion de documents
scientifiques de niveau recherche, publiés ou non,
émanant des établissements d’enseignement et de
recherche français ou étrangers, des laboratoires
publics ou privés.
Acoustic characteristics predicting the annoyance of
interior train background noise
Guillaume Lemaitre, Fabrice Aubin, Christophe Lambourg
To cite this version:
Guillaume Lemaitre, Fabrice Aubin, Christophe Lambourg. Acoustic characteristics predicting the
annoyance of interior train background noise. Forum Acusticum, Dec 2020, Lyon, France.
pp.2385-2389, �10.48465/fa.2020.1030�. �hal-03235955�
ACOUSTIC CHARACTERISTICS PREDICTING THE
ANNOYANCE OF INTERIOR TRAIN BACKGROUND NOISE
Guillaume Lemaitre
1Fabrice Aubin
2Christophe Lambourg
31 SNCF Innovation & Recherche 1-3 avenue François Mitterrand - 93210 La-Plaine-Saint-Denis 2 SNCF Voyageurs – Centre d’Ingénierie du Matériel – 4 Allée des Gémeaux – 72100 Le Mans
3 Arteac-Lab 8 Allée Léon Gambetta – 13205 Marseille cedex guillaume.lemaitre@sncf.fr
ABSTRACT
One of the main advantages of railway transportation is that it allows passengers to engage in a variety of activities such as reading, working, watching movies, resting... It is therefore utterly important for train operators to offer quiet environments enabling these activities. Previous studies have shown that the main sources of annoyance for passengers are other passengers’ noises (conversations, etc.), squeaks and rattles, and train background noise. However, current specifications of rolling stock account only partially for passenger perception and miss important annoying acoustic characteristics of background noise. The goal of this work was therefore to investigate more subtle effects of background noise on passengers’ perceived annoyance, and provide a global annoyance indicator based on a combination of psychoacoustic descriptors. The study was based on a database of binaural recordings of background noises of train operating at different speeds. During a listening test, participants listened to a selection of these recordings through near-field transaural reproduction. Participants compared different recordings and reported perceived annoyance on a continuous scale. Multilinear regression finally created a global annoyance indicator based on a combination of standardized indicators. Overall, the results show that loudness and emergent tonalities are the main factors driving passengers’ annoyance.
1. INTRODUCTION
Railway operators and rolling stock manufacturers began to address the acoustic comfort felt by passengers about twenty years ago, with two goals: i) understand which acoustic components of passenger train interior noise drive passengers’ annoyance; ii) Develop indicators enabling engineers to characterize these components from standardized measurements. Overall most of the studies found in the scientific literature have highlighted that perceived annoyance is mainly driven by perceived loudness. The results of these studies have also shown that loudness models [7, 8] are usually better predictors of perceived annoyance than A-weighted levels used in specifications (see below).
In addition to loudness, studies have also highlighted more subtle components of background noise: for example, spectral balance has been found to be another
factor affecting passengers’ annoyance. Spectral imbalance may be due to an excess of low frequencies from the rolling noise, aerodynamic phenomena (at higher speeds), or sleeper passing frequencies (at lower speeds [3]). Two types of indicators have been proposed to characterize such spectral imbalance: i) the definition of an optimal spectrum, similar to the noise criterion used to characterize office background noises [4, 5]; ii) psychoacoustic indicators such as sharpness [6–10]. Emergent tonal components constitute another factor driving passengers’ annoyance, although fewer studies have focused on these aspects. Audible tonal components (caused for example by electric converters or heat ventilation and air conditioning) also annoy passengers, but their effects are more subtle. For example one needs to considerably reduce them (by 20 dB) to significantly decrease annoyance [11].
The studies mentioned above have considered the train interior background noise, caused by the train itself (i.e. wheel-rail, aerodynamic, equipment noise sources). In most cases, they have used a psychoacoustic framework consisting in playing back background noises to participants required to rate the sound annoyance [12, 13]. However, in addition to the train’s intrinsic background noise, early work showed that passengers are mostly annoyed by what prevent them from performing their activities [14, 15]. Chief among the sources of perturbations are other passengers’ noises (i.e. conversations), intermittent sources (compartment doors, footsteps), squeaks and rattles.
Other passengers’ conversations (face-to-face and phone conversations) are therefore an important source of annoyance [16]. Several studies have shown that the train’s intrinsic background noise may in fact be useful to mask these conversations [17, 18]. The optimal level (sufficiently loud to mask conversations without being too annoying) seems to lay around 60-65 dB(A) [19] or even less [20]. Background noises above 71 dB(A) prevent passengers themselves from having an intelligible conversations [21]. Note that these thresholds are lower than the levels recommended by the International Union of Railways (UIC): 65 dB(A) in the middle of the car at 300 km/h, 75 dB(A) in the vestibule, and 80 dB(A) in the inter-car linkage [22]. This illustrates an important problem caused by current specifications of interior noise: in some cases, background noise in the vestibule is too loud for phone conversations; therefore, passengers carry these conversations sitting at their seats, thus disturbing other passengers.
The study presented here focused on the effect of intrinsic background noise characteristics on passengers’ perceived annoyance measured on various types of conventional and high-speed trains. It sought to establish a model predicting passengers’ annoyance from standardized psychoacoustical indicators [10]. Participants in a listening test rated the perceived annoyance of a set of binaural recordings of high-speed train interior noises. Multilinear regression then created a model relating annoyance judgments to psychoacoustical indicators [12].
2. RECORDINGS AND SELECTION A series of binaural recordings were made during commercial operations of a variety of trains (22 journeys, 12 different types of rolling stock). Recordings were made at different speeds (from 0 to 320 km/h), and different positions in the train (passenger cars, vestibules, inter-car linkages, bars). The recordings used an intra-auricular binaural headset (Feichter Electronics M2), as well as an omnidirectional microphone (B&K 4951), both worn by a human operator. The binaural and monaural channels were recorded with 44.1 Hz sampling rate and 24 bits resolution, and calibrated before each journey. The instantaneous speed of the train (measured with a GPS) was also recorded and synchronized with the audio recordings through a Siemens Scadas XS portable recorder.
The recordings were edited to remove conversations, squeaks and rattles, infrastructure noises, and any unwanted events, as well as isolate sequences of stabilized constant speed. This resulted in an initial selection of 244 10- to 20-s long sequences
This initial selection was further refined so as to homogeneously sample across common psychoacoustical descriptors found to drive passengers’ annoyance. To ensure the homogeneity of the sampling, some sequences were modified by amplifying or attenuating some components. This resulted in a total of 78 sequences.
3. METHODS AND MATERIALS 3.1 Sounds
The listening test used the set of 78 sounds previously described. This set was divided in three series of 26 sounds, corresponding to three loudness ranges: quiet, medium, and loud. For each series, pilot listening tests with the experimenters selected two anchors deemed to correspond to the least and most annoying sounds of the series.
3.2 Participants
Thirty-five French (18 female, 17 male) participants took part in the listening test and were paid for their participation. They were aged from 18 to 64 years old (mean 37.7 y.o.). These age and gender selection criteria were determined so as to correspond to the demographics of railway passengers in France.
3.3 Apparatus
The listening test was performed using Ansys VRXperience sound jury listening test1. Participants were
seated in a sound-attenuated listening room.
Binaural recordings were played back through an audio system consisting of two loudspeakers positioned closed to the participant’ ears and a subwoofer positioned behind the participant. The recordings were also equalized to compensate for the frequency response and gain of the microphones and the loudspeakers. Such as “near-field transaural system” allows a more precise equalization of the recording/playback chain (by reducing crosstalk between loudspeakers and the influence of the room), thus ensuring a faithful reproduction of the train sequences [25]. It also enables a more comfortable listening situation than wearing headphones.
3.4 Procedure
The design of the experiment took inspiration from the MUSHRA procedure (MUltiple Stimuli with Hidden Reference and Anchor) developed by the International Telecom Union for the assessment of audio codecs (ITU-R BS.1534-3 [23]), similarly to previous studies [24]. The test consisted in a series of graphical interfaces with 11 sliders corresponding to 11 sounds (see Figure 1). Participants listened to each sound by pressing a button at the top of each slider. Participants rated each sound with the different sliders on a continuous scale ranging from ‘‘the least unpleasant’’ to ‘‘the most unpleasant’’. Participants could play each sound as many times as they wished, switch between sounds, or stop the playback whenever they felt like. They could also reorder the sounds on the interface from the least to the most annoying, thus facilitating comparisons between similar sounds.
The test was divided in three series of 26 sounds, corresponding to the three loudness ranges (quiet, medium, loud). This ensured that loudness did not vary too much between the sounds, and that too large loudness differences would not mask more subtle acoustic factors. Unbeknown to subjects, two anchor sounds were repeated in each interface of each series. These sounds had been selected in a pilot study as the least (positive reference) and the most unpleasant sounds (negative reference) of each series.
Such a procedure has several advantages. First, participants usually find comparisons easier than absolute judgments. Second, each sound is systematically compared to the worst and the best sounds, which provides participants with stable references for the comparisons. Third, it constrains the subjects to use the full scale (from 0 to 100) and no normalization of the results is thus needed.
The order of the series, and of the sounds in each series was randomized for each participant.
Prior and after the series, the six anchors were judged in a separated test. These tests allowed us to assess the participants’ variability across the experiment and to
1https://www.ansys.com/products/systems/ansys-vrxperience/sound,
calibrate the participants’ ratings between the three series see below.
Figure 1. Interface used in the listening test.
4. ANALYSIS 4.1 Individual differences
Examining the differences between the ratings of the anchor sounds at the beginning and the end of the test did not show any significant differences.
We examined the similarities of the participants’ ratings with a hierarchical tree representation of the correlations. There was no clear clustering of different groups of subjects. In particular, the analysis did no show differences between younger and older participants.
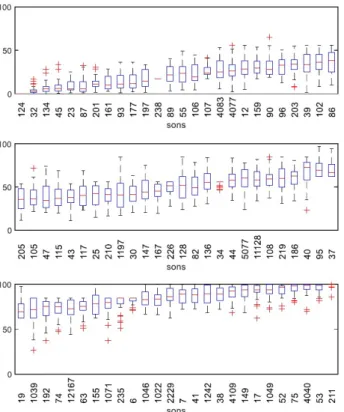
Figure 2. Boxplot of the ratings for the 78 sounds, after the scaling procedure. The upper panel corresponds to the series of quieter sounds, the middle panel to the
series of medium-loudness sounds, and the upper panel to the louder sounds.
4.2 Scaling the ratings between the series of sounds The test procedure ensured that the participants’ ratings ranged from the minimum (0) to the maximum (100) of the slider for each series of 26 sounds (each loudness range). It was therefore necessary to scale the results of the three series before comparing the ratings in the three series.
The scaling method consisted in transforming the raw ratings with a linear function (𝑠) = 𝑎 × 𝑠 + 𝑏 such that the transformed ratings for the anchors in each series corresponded to the anchor ratings in the initial and final tests (i.e. with only the anchors). The coefficients of the linear function were determined by fitting the function to the ratings averaged across participants.
The resulting scaled ratings are represented in Figure 2. 4.3 Principal component analysis
A set of 12 psychoacoustical standardized indicators [10] were first computed for the 78 sounds (based on the monaural recordings) with Ansys VRXperience sound analysis software1. The correlation matrix between these
indicators was submitted to a principal component analysis (PCA). This analysis showed that most of the variance could be explained by three principal components related to loudness, spectral balance, and the presence of tonal components1. These results are
consistent with the literature reviewed above, and suggest that that annoyance perceived by the participants may be predicted by such psychoacoustical dimensions.
4.4 Regression analysis
The scaled ratings of unpleasantness were submitted to multilinear regression analyses using different combinations of the 12 psychoacoustical indicators. The resulting models were compared by considering the adjusted coefficient of variation (i.e. R², percentage of variance explained by the model). The best model included one indicator of loudness and one indicator of tonality1 (R²=93%). Adding more indicators (e.g. spectral
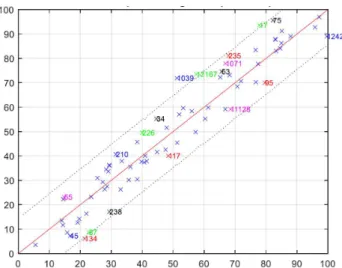
balance) did not significantly improve the model (Fischer tests). The influence of loudness was stronger than that of tonality. Figure 3 represents the regression model.
1The precise indicators, as well as of the coefficients of the equations
Figure 3. Regression model predicting the scaled ratings of unpleasantness. The x-axis represents the prediction of the model; the y-axis corresponds to the scaled ratings of unpleasantness. The dotted lines around the main regression line correspond to the 95% confidence interval.
Examining the data points that are not well predicted by the regression model showed that these sounds had strong low-frequency tonal components (probably caused by sleeper passing frequencies). This indicates that current models of tonality may not be suited to capture such phenomena.
5. DISCUSSION
The study reported here conducted a listening test with binaural recordings of passenger train interior background noises. It developed a model predicting the annoyance perceived by listeners from a combination standardized psychoacoustical indicators.
Overall, the results of this study confirmed and specified previous results reported in the literature. First, it confirmed that perceived loudness is the most important factor driving annoyance judgments. It should also be noted that, consistently with results repeatedly reported in the literature, loudness models are better correlated with participants’ ratings than A-weighted levels currently recommended by UIC.
Second, the results showed that the emergence of tonal components is important another factor driving participants’ annoyance. Tonal components may be caused by a variety of sources: air conditioning, electric converters, traction motors, etc. Tonal components are particularly annoying to passengers when they emerge from background noise (in particular when train is stopped or moving at very low speeds). However, the results showed that their influence is less important than loudness: the emergence of tonal components must be reduced a lot to improve passengers’ acoustic comfort, compared to a smaller reduction of loudness with the same effect on perceived annoyance.
Moreover, current standardized tonality indicators are not able to capture all tonal phenomena: for example, they are not well suited for harmonic series or low-frequency tonal components. Further work is therefore needed to develop more precise tonal indicators.
The results of the current studies allow train operators such as SNCF to better characterize the acoustic comfort of passenger trains. However, the current study also had some limitations: first, the listening test was conducted in a laboratory environment, with participants performing a non-ecological task (i.e. focusing on sounds and rating subtle differences between sound sequences), and sound sequences devoid of all sorts of phenomena (conversations, squeaks and rattles) known to annoy passengers. Second, models based on regression analyses are only able to rank order sounds: such models are only able to tell train operators that certain sound characteristics are more or less annoying than some others (i.e. relatively), but not whether they are acceptable by passengers in a certain context (i.e. absolutely). More work is therefore needed to determine thresholds of acoustic acceptability for passengers.
6. REFERENCES
[1] E. Zwicker, H. Fastl, U. Widmann, K. Kurakata, S. Kuwano, and S. Namba, “Program for calculating loudness according to DIN 45631 (ISO 532B),” Journal of the Acoustical Society of Japan (E), vol. 12, no. 1, pp. 39–42, 1991.
[2] “ISO 532-1:2017 Acoustics -- Methods for calculating loudness -- Part 1: Zwicker meth,” International Standard Association, 2017.
[3] T. X. Wu and D. J. Thompson, “On the rolling noise generation due to wheel/track parametric excitation,” Journal of Sound and Vibration, vol. 293, no. 3–5, pp. 566–574, 2006.
[4] A. E. J. Hardy, “Measurement and assessment of noise within passenger trains,” Journal of sound and vibration, vol. 231, no. 3, pp. 819–829, 2000. [5] W. Blazier, “Revised noise criteria for application in
the acoustical design and rating of HVAC systems,” Noise Control Engineering Journal, vol. 16, no. 2, pp. 64–73, 1981.
[6] E. Parizet, N. Hamzaoui, and J. Jacquemoud, “Noise assessment in a high-speed train,” Applied acoustics, vol. 63, no. 10, pp. 1109–1124, 2002.
[7] S. Choi, C. P. Park, B. Park, and J.-S. Paik, “Acoustic comfort indicator for the assessment of interior noise in Korean high-speed trains,” presented at the 9th World Congress on Railway Research, Lille, France, 2011.
[8] F. Meng and L. Yang, “Sound Quality Evaluation on Interior Noise in High-speed Trains,” presented at the The 40th Annual German Congress on Acoustics, Oldenburg, Germany, 2014.
[9] J. Y. Hong, Y. Cha, and J. Y. Jeon, “Noise in the passenger cars of high-speed trains,” The Journal of the Acoustical Society of America, vol. 138, no. 6, pp. 3513–3521, 2015.
[10] E. Zwicker and H. Fastl, Psychoacoustics: Facts and models, vol. 22. Springer Verlag, 1991.
[11] C. Patsouras, H. Fastl, U. Widmann, and G. Hölzl, “Psychoacoustic evaluation of tonal components in view of sound quality design for high-speed train interior noise,” Acoustical Science and Technology, vol. 23, no. 2, pp. 113–116, 2002.
[12] G. Lemaitre and P. Susini, “Timbre, Sound Quality, and Sound Design,” in Timbre. Acoustics, Perception, Cognition, Springer., 2019.
[13] P. Susini, G. Lemaitre, and S. McAdams, “Psychological measurement for sound description and evaluation,” Measurements with persons: Theory, methods, and implementation areas, vol. 227, 2012.
[14] M. Mzali, “Perception de l’ambiance sonore et évaluation du confort acoustique dans les trains,” Université de Paris 6, 2002.
[15] M. S. Khan, “Evaluation of acoustical comfort in passenger trains,” Acta Acustica united with Acustica, vol. 88, no. 2, pp. 270–277, 2002.
[16] M. S. Khan, “Effects of masking sound on train passenger aboard activities and on other interior annoying noises,” Acta Acustica united with Acustica, vol. 89, no. 4, pp. 711–717, 2003.
[17] J. Y. Hong and J. Y. Jeon, “Enhancement of acoustic environment with regard to speech privacy and annoyance in passenger cars of high-speed trains,” presented at the 11th International Congress on Noise as a Public Health Problem (ICBEN), Nara, Japan, 2014.
[18] C. Patsouras, H. Fastl, U. Widmann, and G. Hölzl, “Privacy versus sound quality in high speed trains,” presented at the The 29the International Congress and Exhibition on Noise Control Engineering (Internoise), Nice, France, 2000.
[19] J. Y. Jeon, J. Y. Hong, H. S. Jang, and J. H. Kim, “Speech privacy and annoyance considerations in the acoustic environment of passenger cars of high-speed trains,” The Journal of the Acoustical Society of America, vol. 138, no. 6, pp. 3976–3984, 2015. [20] S. Kuwano, S. Namba, and T. Okamoto,
“Psychological evaluation of sound environment in a compartment of a high-speed train,” Journal of Sound and Vibration, vol. 277, no. 3, pp. 491–500, 2004.
[21] L. Maffei, M. Masullo, N. Alexeeva, U. Palmieri, and V. P. Senese, “The speech intelligibility aboard metros in different running conditions,” Acta Acustica united with Acustica, vol. 98, no. 4, pp. 577–587, 2012.
[22] International Union of Railways (UIC), Ed., “Measures to ensure the technical compatibility of high-speed trains UIC 660(E).” 2002.
[23] International Telecom Union (ITU), Ed., “Recommendation ITU-R BS.1534-1. Method for the subjective assessment of intermediate quality level of audio systems.” 2014.
[24] G. Lemaitre, C. Vartanian, C. Lambourg, and P. Boussard, “A psychoacoustical study of wind buffeting noise,” Applied acoustics, vol. 95, pp. 1– 12, 2015.
[25] A. Vidal, “Diffusion de son 3D par synthèse de champs acoustiques binauraux,” Université Aix-Marseillle, Marseille, France, 2017.