HAL Id: hal-03007809
https://hal.archives-ouvertes.fr/hal-03007809
Submitted on 16 Nov 2020HAL is a multi-disciplinary open access archive for the deposit and dissemination of sci-entific research documents, whether they are pub-lished or not. The documents may come from teaching and research institutions in France or abroad, or from public or private research centers.
L’archive ouverte pluridisciplinaire HAL, est destinée au dépôt et à la diffusion de documents scientifiques de niveau recherche, publiés ou non, émanant des établissements d’enseignement et de recherche français ou étrangers, des laboratoires publics ou privés.
Drought mitigation by thinning: Benefits from the stem
to the stand along 15 years of experimental rainfall
exclusion in a holm oak coppice
J. Gavinet, J.-M. Ourcival, J. Gauzere, L. García de Jalón, J.-M. Limousin
To cite this version:
J. Gavinet, J.-M. Ourcival, J. Gauzere, L. García de Jalón, J.-M. Limousin. Drought miti-gation by thinning: Benefits from the stem to the stand along 15 years of experimental rain-fall exclusion in a holm oak coppice. Forest Ecology and Management, 2020, 473, pp.118266. �10.1016/j.foreco.2020.118266�. �hal-03007809�
Drought mitigation by thinning: benefits from the stem to the stand along 15 years of 1
experimental rainfall exclusion in a holm oak coppice 2
3
Authors: J. Gavinet1, J-M Ourcival1, J. Gauzere2, L. García de Jalón1, J-M Limousin1
4
1 Centre d’Ecologie Fonctionnelle et Evolutive (CEFE), Univ Montpellier, CNRS, EPHE, IRD, Univ 5
Paul Valéry Montpellier 3, 1919 route de Mende, F-34293 Montpellier, Cedex 5, France 6
2 Institute of Evolutionary Biology, School of Biological Sciences, University of Edinburgh, EH93FL, 7 UK. 8 9 Corresponding author : 10 Jean-Marc Limousin 11 Email : jean-marc.limousin@cefe.cnrs.fr 12 13 14 15
Keywords: Quercus ilex; drought resistance; tree mortality; stool density; climate change; 16
adaptive management; stem growth; resprouting; ecosystem manipulation 17
Abstract 19
In northern Mediterranean forests, increasing drought stress due to the on-going climate change is 20
combined with stand ageing due to the lack of management. Management by thinning may alleviate 21
drought stress by reducing competition, but its application is challenging in coppices of resprouting 22
species where its long-term consequences for tree demography and stand dynamics are difficult to 23
evaluate. In this study, we investigate the long-term (15 years) demographic responses of holm oak 24
(Quercus ilex L.) to a combination of thinning from below (-30% basal area) and experimental rainfall 25
exclusion (-27% precipitation). Stem growth, survival and resistance to an extreme drought event were 26
positively linked to both stem size and local competition release after thinning. Thinning improvement 27
of growth and survival were thus due to both a selection of the biggest, most vigorous, trees and to a 28
release of competition for water. Rainfall exclusion, on the other hand, led to a shift of the tree size-29
mortality relationship, which resulted in the death of bigger trees, in a faster loss of stool density and in 30
a slower evolution of the stand basal area compared to the control. Thinning was beneficial by cancelling 31
the rainfall exclusion effects on growth and mortality, and by doubling the stand basal area increment 32
compared to unthinned control. The initial loss of stools due to thinning was compensated by a lower 33
mortality, suggesting that thinning do not reduce further the amount of unique genotypes on the long-34
term. Positive thinning effects on stem growth decreased over time but remained significant 15 years 35
after thinning, while resprouting dynamics strongly decreased with time. These results indicate that 36
moderate thinning from below is a relevant strategy to increase stem vitality and stand production in old 37
coppices, particularly in a context of a chronic rise in drought stress and more frequent extreme drought 38
episodes. 39
1. Introduction 40
Forest ecosystems are currently facing fast changes, such as unprecedented climatic conditions and land-41
use changes, that already affect tree growth, mortality and reproduction (Allen et al., 2010; Doblas-42
Miranda et al., 2017; Linares et al., 2009; McDowell and Allen, 2015). Such changes are expected to 43
further accelerate in the future and strongly challenge current forest management practices (Keenan, 44
2015; Millar et al., 2007; Stephens et al., 2010). Decreasing stand density by thinning is traditionally 45
used to improve residual tree growth and dimensions, but it has gained a renewed interest as an adaptive 46
management practice aiming at improving forest resistance or resilience to drought (Bottero et al., 2016; 47
Navarro-Cerrillo et al., 2019; Vilà-Cabrera et al., 2018). By reducing stand leaf area, thinning is 48
expected to reduce rainfall interception and stand transpiration, thereby improving water availability for 49
the remaining trees (Bréda et al., 1995; del Campo et al., 2014; Giuggiola et al., 2015). Reduced 50
competition for water after thinning has been shown to increase mean tree growth and to reduce growth 51
vulnerability to extreme drought events (Aldea et al., 2017; Bottero et al., 2016), although with a high 52
variability depending on species, climate and thinning intensity (Sohn et al., 2016b). How thinning 53
regimes, i.e. their frequency, intensity and the characteristics of the trees harvested affect the forest 54
resistance to drought is still poorly known. Thinning effects on tree growth and mortality strongly 55
depend on individual characteristics such as tree size and local competitive environment (Bose et al., 56
2018), which also affect the drought responses (Bennett et al., 2015; Colangelo et al., 2017; Trouvé et 57
al., 2014). Furthermore, positive thinning effects may vanish after a few years (Bréda et al., 1995; 58
Cotillas et al., 2009; del Campo et al., 2019; Sánchez-Humanes and Espelta, 2011), and even reverse in 59
the long-term (D’Amato et al., 2013) because stand leaf area can quickly recover to its pre-thinning 60
values either by an increase in tree leaf area (Bréda et al., 1995; Giuggiola et al., 2013) or by the 61
development of understory vegetation following increased light availability (Gebhardt et al., 2014; 62
Simonin et al., 2007). Thinning is also accompanied by an increase in light, temperature and evaporative 63
demand in the canopy and understory (Gavinet et al., 2015; Lechuga et al., 2017), possibly resulting in 64
increased water losses by evapotranspiration that can reduce or offset thinning benefits for water 65
availability (del Campo et al., 2019; Gebhardt et al., 2014). Moreover, when thinning reduces population 66
sizes too strongly, genetic drift may lead to the loss of rare alleles and restrict local adaptation processes 67
(Lefèvre et al., 2014). Thinning is thus generally considered as a short-term adaptation option (Vilà-68
Cabrera et al., 2018), and thinning regimes are to be determined depending on species, stand type and 69
site conditions (Ameztegui et al., 2017; Skov et al. 2009; Sohn et al. 2016b). 70
Whether thinning is a suitable strategy to improve tree vitality and resistance to stress in resprouting 71
stands is not straightforward because an important resprouting dynamic can take place after thinning 72
and quickly offset the benefits of competition reduction (Cotillas et al., 2009; Ducrey, 1996; Ducrey and 73
Toth, 1992). The resprouting ability allows trees to persist under disturbances or drought (Bond and 74
Midgley, 2001; Clarke et al., 2010; Zeppel et al., 2015) and is widespread in broadleaved species such 75
as Mediterranean oaks. These oak forests represent the main late-successional stands around the 76
Mediterranean basin (Quézel & Médail 2003), and because of their strong resprouting ability, they have 77
been generally managed as coppices for the provision of fuel wood, charcoal or tannins. With rural 78
abandonment and the decreasing use of firewood and charcoal as energy sources, oak coppices have 79
been progressively abandoned since the middle of the XXth century and form now ageing stands with 80
frequent signs of dieback, lack of seed regeneration and low levels of productivity (Camarero et al., 81
2016; Gentilesca et al., 2017). Besides, in coppice stands, the long history of coppicing has led to 82
complex forest structures comprising both unique genets and multi-stemmed clumps (Valbuena-83
Carabaña et al., 2008), where individual stem growth and vigour are also influenced by stool 84
characteristics (Salomón et al., 2013). Whether management by thinning could improve productivity 85
and drought resistance of aged oak coppices in the long-term remains to be determined, especially in a 86
context of climate change pushing drought stress beyond its historical range. Thinning from below at a 87
moderate intensity, i.e. by removing the smallest suppressed stems and by keeping at least one stem on 88
multi-stemmed stools, may limit resprouting and maintain stand-level productivity (Cabon et al., 2018b; 89
Ducrey, 1996) as well as a large population size of unique genets. This type of thinning from below can 90
additionally decrease fire risk by limiting the vertical continuity of the vegetation cover and limit the 91
impact on understory temperature and evaporative demand. Thinning from below has potentially two 92
types of effects: the selected trees are the biggest, which are often more vigorous and more efficient in 93
resource acquisition and transformation (Binkley et al., 2004), while the removal of small trees can 94
release the competition for belowground resources (Cabon et al., 2018b; Giuggiola et al., 2018). 95
However, the relative importance of size-selection and competition release, the influence of stool-level 96
variables, and the impact of thinning on genetic diversity on the long-term remain to be described in a 97
context of increasing drought. 98
In this study, we investigate the effects of thinning on holm oak growth, mortality, resprouting and stool 99
diversity under ambient and increased drought severity, by using a 15-year experiment in a mature 100
coppice combining rainfall exclusion (-27% of incoming precipitations) and thinning from below (-30% 101
basal area). A previous study after 5 years of treatment showed that thinning improved tree growth and 102
survival but also increased tree resprouting, suggesting that thinning effect could be quickly offset by 103
resprouting (Rodríguez-Calcerrada et al., 2011). Ten years later, we aimed to i) analyse the long-term 104
evolution of thinning effects and resprouting dynamics, ii) understand the individual characteristics 105
driving tree demographic rates (growth, survival, resprouting) and their response to drought and iii) 106
explore the stand-level evolution of basal area, stem density and stool density – which relates to the 107
number of unique genotypes – under the different treatments. 108
2. Material & method 109
2.1. Experimental site
110
The experiment was conducted in southern France (35 km northwest of Montpellier), on a flat area in 111
the Puéchabon State Forest (43°44’29’’ N; 3°35’46’’ E, 270 m a.s.l.). This forest has been coppiced for 112
centuries with clear cuts approximately every 25 years, until the last clear cut in 1942. The evergreen 113
Quercus ilex L. forms a dense canopy with a height of c. 5.5 m, a mean basal area of 30 m2.ha-1 and a
114
density of c. 6000 stems. ha-1, representing c. 4000 genetically different individuals (stools).ha-1. The
115
evergreen species Buxus sempervirens, Phyllirea latifolia, Pistacia terebinthus and Juniperus 116
oxycedrus, compose a sparse understory layer with c. 20% cover and represent less than 3% of stand
117
basal area. The bedrock is a hard Jurassic limestone and the soil is extremely rocky with c. 75% of stones 118
and rocks in the top 0–50 cm and 90% below. The stone-free fraction of the soil within the 0–50 cm 119
layer is a homogeneous silty clay loam (38.8% clay, 35.2% silt and 26% sand). The area has a 120
Mediterranean-type climate with a mean annual temperature of 13.2°C (on-site meteorological station, 121
1984-2017), the coldest month being January (5.5°C) and the hottest month July (22.9°C). The mean 122
annual precipitation is 910 mm with a range of 550 - 1549 mm (1984-2017). Rainfall mainly occurs 123
during autumn and winter with about 80% between September and April. 124
2.2 Experimental design: rainfall exclusion and thinning experiments
125
In March 2003, a factorial combination of throughfall exclusion and thinning treatments was set up on 126
three 20 × 20 m replicated blocks located 200m apart one from the other. Each block comprises four 127
treatments applied on a 10 × 10 m plot: control, throughfall exclusion (further “dry”), thinned, and 128
thinned with throughfall exclusion (further “thinned dry”). For the throughfall exclusion treatment, half 129
of the block was equipped with parallel 14m long and 0.19m wide PVC gutters hung below the canopy 130
with a slope, between 1m and 2m in height, so as to cover 33% of the ground area under the tree canopy. 131
Taking into account rainfall interception and stemflow, the net input of precipitation was reduced by 132
27% compared with the control plots (Limousin et al., 2008). On the other half of the blocks, identical 133
gutters were installed upside down to homogenize albedo and understorey micro-climate without 134
reducing precipitation inputs. Thinning from below was applied once, in winter 2003, on half of the 135
plots by removing 30% of the initial plot basal area (27% of Q. ilex basal area, Table 1), thereby reducing 136
the stem density by 49 % and stool density by 36% (Table 1). Dead, diseased and suppressed stems were 137
felled and the understory cleared. One to four stems were cut on multi-stemmed stumps, in order to 138
leave the larger stems. Thinning resulted in an increase of the mean Q. ilex stem diameter by 25% (Table 139
1). Measures of pre-dawn water potential on a subsample of trees during the first 5 years of the 140
experiment confirmed that rainfall exclusion increased tree water stress while thinning decreased it 141
(Rodríguez-Calcerrada et al., 2011). 142
2.3 Demographic data
In each plot, stems with a diameter at breast height (DBH) larger than 2 cm were individually tagged, 144
mapped and their DBH was measured before and after treatment application in March 2003. 145
Neighboring trees located within a 3m band around the blocks were also measured to assess the 146
competitive environment of the trees inside the plots. Annual inventories of stem DBH were then 147
conducted every winter from 2004 to 2019 with a diameter tape. Annual stem basal area increments 148
were calculated for each year n from 2003 to 2018 as BAIn =
𝜋
4(𝐷𝐵𝐻𝑛+1
2 − 𝐷𝐵𝐻
𝑛2). Trees were 149
recorded as dead when only brown leaves remained on the tree without crown regreening during the 150
following years. Resprouts were inventoried twice, in 2008 and 2018. For each stump, the number of 151
resprouts, the diameter of all resprouts and the height of the dominant resprout were measured. We 152
considered the resprouts taller than 1.30m as established resprouts. None of them reached the threshold 153
of 2cm DBH to be considered as recruits. 154
2.4 Stool identification and clonal structure
155
The stool clonal structure of the coppice was visually assessed during the first inventory by grouping as 156
clones the stems that were visibly connected to the same stump and root system. This assessment was 157
facilitated by the shallow and rocky soil of the site where the stumps are generally clearly visible above 158
the ground. This visual census of genetically different individuals was then confirmed by genetic 159
analyses performed in 2018 on a subsample of 166 individuals selected in the denser unthinned plots. 160
Leaves were collected on one stem of every identified stump and frozen on dry ice. The DNA was 161
extracted using DNeasy 96 Plant kit (QIAGEN GmbH, Hilden, Germany) and genotyping was 162
performed using 70 validated SNPs markers (Bonal et al., 2019) developed from ddRAD-Seq data by 163
the Genome Transcriptome Facility of Bordeaux (PGTB) following the methods described in García et 164
al. (2018). To be considered clones, individuals had to be compared at more than 50 loci with exact 165
matching of their SNP markers. The results confirmed the relative reliability of the visual assessment as 166
only 25 individuals among the 166 sampled were unidentified clones (15% of undetected clones). The 167
mean distance between unidentified clones was 1.05 m and never exceeded 3 m (see a map of one block 168
in Fig. S1). These results show that stools extent was spatially restricted and that it could reliably be 169
described from visual inventories. We therefore decided to retain the visual stool identification as a 170
proxy for the number of genetically different individuals within the coppice. 171
2.5 Competition indexes
172
We calculated the stem-level competition index as the sum of the neighbors’ basal area in a 3m radius 173
around each stem (BAn). BAn is a distance-independent, size-symmetric competition index. Size 174
symmetric competition occurs when each tree exerts a competitive effect proportional to its size. This 175
is typically assumed to be the case when belowground resources such as water are the main limitation. 176
We also computed other widely used competition indexes: two size and distance-dependent competition 177
indexes, the Hegyi competition index (Hegyi, 1974) and the Weiner competition index (Weiner, 1984) 178
and the size asymmetric index Basal Area of Larger trees within a 3m radius (BAL). The models 179
including these indexes were however always less performant than with BAn (lower or similar R2, higher
180
AIC, with particularly no effect of BAL, data not shown). We thus retained BAn to characterize the 181
local competition intensity as this index is simpler and not related to tree size, allowing us to separate 182
mechanisms of competition and size-selection. We tested the effect of competition absolute values 183
(BAn) and competition release, expressed as the percentage of BAn removed by thinning or neighbor’s 184
mortality. 185
2.6 Data analysis
186
Annual stem basal area increment (BAI) were averaged over the 15 years of the experiment for each 187
tree. This mean growth variable was first analysed as a function of thinning, rainfall exclusion and their 188
interaction using a linear model. Then, we constructed a stem growth model as a function of individual 189
characteristics using stem size in interaction with indexes of competition intensity (BAn), competition 190
release (percentage difference of BAn before and after thinning, see above) and rainfall exclusion as 191
explanatory variables. Thinning was not included in these latter models because it was redundant with 192
competition indices and strongly inflated models VIF (Zuur et al., 2010). We selected the best model 193
based on the Akaike criterion (AIC). When AIC difference between two models was lower than 2, we 194
considered the models equivalent and selected the most parsimonious one. The variance explained by 195
each of the predictors was assessed using the R package relaimpo (Grömping, 2006). Finally, the 196
temporal evolution of treatment effects on tree growth was analysed by separating the dataset in three 197
5-years periods and analysing stem growth as a function of treatments, period and their interactions 198
using a linear mixed model with stem identity as a random factor in order to account for repeated 199
measures. In all models, stem growth was log-transformed to satisfy conditions of normality and 200
homoscedasticity. 201
Holm oak stem and stool mortality was analysed similarly as a function of i) treatments and ii) individual 202
characteristics. Mortality probability was modelled using a logistic regression with a logit link. Rainfall 203
exclusion effect on the diameter of dead trees in unthinned plots was tested with a t-test. 204
The year 2006 had the driest spring season over the course of the experiment, with only 52mm of 205
precipitations between April and June (average 2003 – 2018 = 211mm). Spring water limitation has 206
been shown to be the most important environmental factor for stem growth and stand productivity in 207
our site (Gavinet et al., 2019; Lempereur et al., 2015). We thus used data from the year 2006 to quantify 208
the impact of an extreme drought event on individual stem growth. We calculated the drought resistance 209
for each stem as the ratio of stem growth in 2006 to mean growth in the three preceding years (Lloret et 210
al., 2011). Drought resistance was analyzed as described for stem BAI and mortality as a function of 211
rainfall exclusion and thinning treatments, then as a function of individual characteristics. Drought 212
resistance was log-transformed to obtain normal residuals and 13 outliers were discarded, corresponding 213
to stems with either a negative BAI in 2006 (typically due to a measurement error) or a mean BAI during 214
the preceding years almost null, 8 of which died some years later. 215
Resprouts number, maximum height and total basal area per stool were analysed as a function of rainfall 216
exclusion, thinning treatments, inventory date (5 and 15 years after thinning) and their interaction, using 217
stool identity as a random factor to account for repeated measures. A negative binomial distribution was 218
used for the number of resprouts to account for overdispersion (function glmer.nb of the R package 219
lme4), and linear mixed models were used for log-transformed resprout height and basal area. When 220
interactions between factors were significant, we performed Tukey post-hoc tests. Then, we modelled 221
resprout basal area (the most integrative index of resprout dynamics) as a function of stool size and the 222
percentage of stool basal area that had been cut by thinning (stool competition release). 223
To examine treatment effects at the stand-level, we calculated for each year and plot the relative stand 224
basal area, stand basal area increment, stem density and stool density as the ratio of these variables to 225
their initial values (pre-thinning). We used a linear mixed model to test the evolution of stand 226
characteristics as a function of years since treatment application, thinning, rainfall exclusion and their 227
interactions with plot as a random factor to account for repeated measures. 228
3. Results 229
3.1 Stem growth and resistance to drought
230
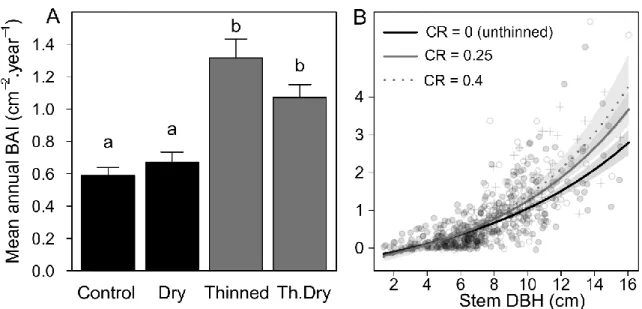
Mean stem growth over the 15-year period was strongly affected by thinning (P < 0.001, Figure 1A, 231
explained variance of 12.2%) but not by rainfall exclusion (P = 0.77). Stem growth was positively 232
related to stem DBH in interaction with stem-level competition release, so that biggest stems responded 233
more to competition release (Table 2; Figure 1B). Stem DBH explained 53% of stem growth variance, 234
competition release an additional 7% and the interaction between these factors 0.5%. Absolute 235
competition (BAn) had an additive negative effect and explained 1.9% of stem growth variance. 236
237
238
Figure 1 : Quercus ilex stem mean annual basal area increment (BAI) as a function of : A) treatments 239
(means ± standard error of 99 to 173 stems per treatment, different letters indicate differences 240
between treatments) and B) model projections and experimental data of stem BAI as a function 241
of stem DBH and competition release (CR), confidence intervals of the models are represented 242
in grey. CR=0 represent trees unthinned (represented by grey points), CR=0.25 is the median 243
(white points) and CR=0.4 the upper quartile (crosses) of CR values in the thinned treatments. 244
Point symbols are determined by the closest value of CR. Competition release is calculated as 245
the change of neighbors’ basal area in a 3m radius compared to its initial value before treatment 246
application in 2003. Full model R2 is 62%, stem DBH explains 53% of the variance and CR 7%
247
(see Table 2). 248
249
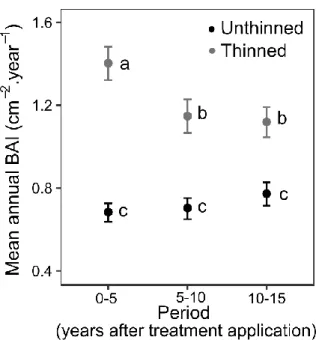
Thinning effect on stem growth decreased over time (Thinning x Period interaction, P < 0.001; Figure 250
2) but remained significant (P < 0.001, post-hoc Tukey tests) during all the periods. Rainfall exclusion 251
had no effect on stem growth in any of the periods (Rainfall exclusion main effect P = 0.43, interaction 252
with Period P = 0.32). 253
254
Figure 2: Temporal evolution of thinning effects on Quercus ilex stem growth (mean ± standard 255
error). Thinning effect decrease with time but is always significant (P < 0.001). Different letters 256
indicate significant differences between treatments and periods (Tukey post-hoc tests). 257
258
The extreme spring drought in 2006 induced a strong reduction of stem growth to about 50% of the 259
average of the preceding years in the unthinned plots (Figure 3A). Thinning strongly increased stem 260
resistance to drought (P < 0.001; Figure 3) as tree growth was maintained in thinned stands. In contrast, 261
stem growth resistance to drought was not affected by rainfall exclusion (P = 0.77) nor by the interaction 262
between rainfall exclusion and thinning (P = 0.25). Thinning explained 8.1% of the variance in stem 263
growth resistance to drought. Stem resistance to drought was positively related to stem DBH (explained 264
variance = 2.5%) and competition release (explained variance = 4.5%; Figure 3B; Table 2). 265
266
267
Figure 3 : Quercus ilex stem growth resistance to the extreme 2006 drought as a function of A) 268
treatments (means ± standard error of 85 to 123 trees per treatment) and B) model projections 269
of drought resistance as a function of stem DBH and competition release (CR) with confidence 270
intervals in grey and ticks representing data distribution. Full model R2 is 7%, stem DBH
271
explains 2.5% of the variance and CR 4.5% (see Table 2). 272
273
3.2 Stem and stool mortality
274
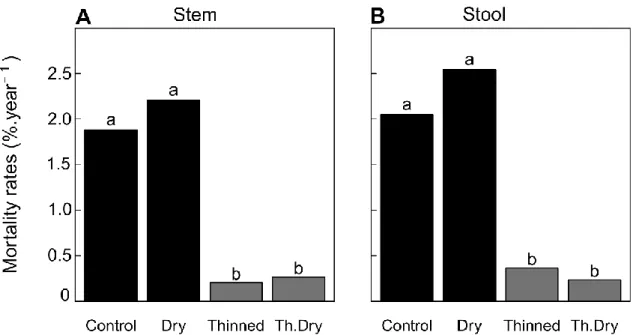
The average stem mortality rate was 2.2%.year-1 in control stands and was not significantly increased
275
by rainfall exclusion (P = 0.14). The mortality rate was, however, strongly decreased to only 0.2%.year
-276
1 in thinned stands (P < 0.001, explained variance of 18%): only 3 and 4 stem deaths were recorded in
277
thinned and thinned dry stands, respectively. Similarly, at the stool-level, the mortality rate was 278
2.1%.year-1 in the control stands and increased to 2.5%.year-1 in the dry treatment, although this
279
difference was not significant (P = 0.22). Thinning strongly reduced stool mortality (P < 0.001) to 280
0.03%.year-1, regardless of the rainfall exclusion treatment (Figure 4B).
282
Figure 4 : Quercus ilex stem (A) and stool (B) annual mortality rates as a function of treatment. 283
Different letters indicate differences between treatments (P< 0.05). 284
285
Stem mortality probability was influenced by stem DBH, competition release and rainfall exclusion 286
(Table 2, Figure 5). Stem mortality risk was higher for smaller stems: all trees under 3 cm of DBH died 287
during the 15 years of the experiment while the mortality probability was almost null for DBH higher 288
than 10 cm. Stem DBH explained 40% of the variance of the mortality risk, rainfall exclusion 4% and 289
competition release 4%. Taking into account stem diameter, the mortality risk was higher in the dry 290
treatment (P=0.003, Table 2) and decreased with competition release. The mean diameter of dead stems 291
was higher in the rainfall exclusion treatment in unthinned plots (t = -3.16, P = 0.002, Figure 5A). The 292
stool mortality risk was also higher for smaller stools, and rainfall exclusion shifted the mortality risk 293
toward bigger stools in the unthinned treatment (Rainfall exclusion x Stool BA, P = 0.01, Supp. Figure 294
S2). 295
296
Figure 5 : Quercus ilex stem mortality probability as a function of A) stem DBH and rainfall 297
exclusion treatment - the inset shows dead stems DBH as a function of rainfall exclusion 298
treatment in unthinned stands, asterisks denote the significance of a t-test (**, P < 0.01) - and 299
B) competition release, for a median DBH value (7.3 cm). Grey areas represent the confidence 300
intervals of the models. Ticks represent dead (top) and alive (bottom) trees according to their 301
DBH and rainfall exclusion treatment (black = Control, grey = Dry). Full model R2 = 48%
302
(variance explained by stem DBH 40%, Rainfall exclusion 4% and Competition release 4%). 303
304
3.3 Resprouting dynamics
305
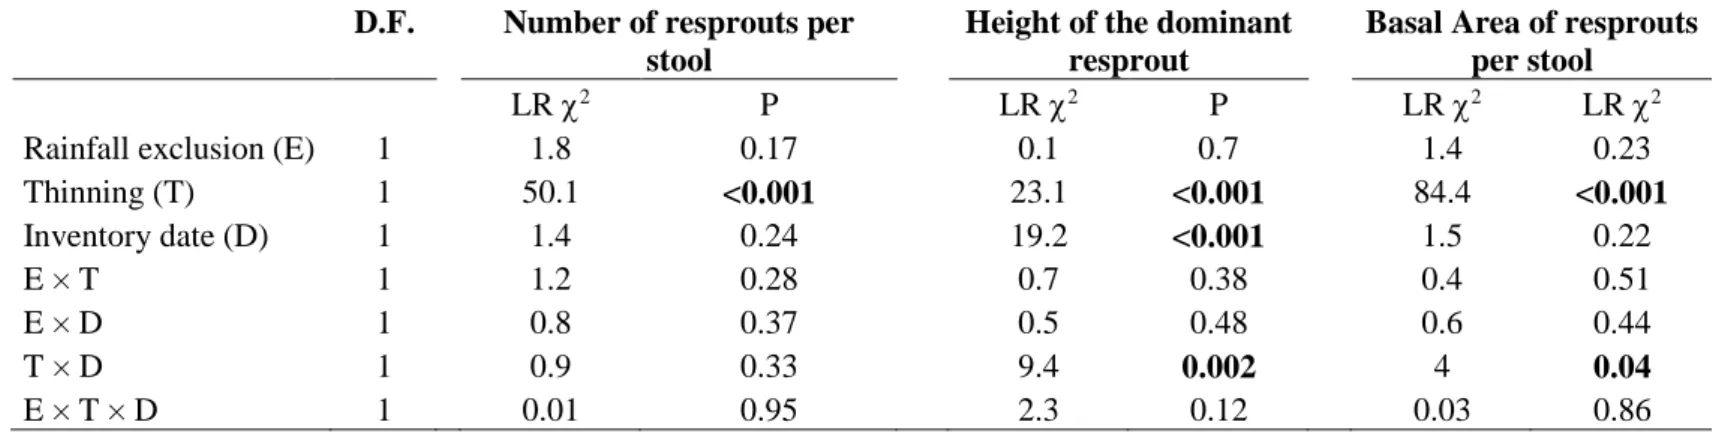
None of the resprouts characteristics was influenced by rainfall exclusion (Table S1). Resprouts number 306
was higher in thinned plots at the two inventory dates (Table S1, Figure 6A). Resprouts maximal height 307
was higher in thinned plots after 5 years but did not differ among treatments after 15 years (Table S1, 308
Fig 6B). The established resprouts (height > 1.30m) after 15 years represented 22% of the resprouts in 309
thinned plots and 13% in unthinned plots. Resprouts basal area was higher in thinned plots in both 310
inventory dates, but it strongly decreased between the two inventory dates in thinned stands resulting in 311
a lower difference between treatments after 15 years (Table S1, Figure 6C). Resprouts basal area 312
increased with stool size (P < 0.001) and with the proportion of stool basal area cut (P < 0.001), with a 313
positive interaction between these two factors (P < 0.001) so that stool size influenced less the 314
resprouting when it had not been thinned (data not shown). 315
316
Figure 6: Quercus ilex resprouts number per stool (A), height of the dominant resprout (B) and total 317
basal area of the resprouts (C) as a function of thinning treatment (black: unthinned, grey: 318
thinned) and period. Data are means ± standard error of 246 to 284 stools per thinning treatment 319
(pooled over the rainfall exclusion treatment which had no effect). Different letters indicate 320
differences between treatments and inventory date (P < 0.005, Tukey post-hoc tests) 321
322
3.4 Evolution of the stand basal area and density
323
Stand basal area increment was 0.16 ± 0.05 m2·ha-1·year-1 in the control plots and decreased to 0.06 ±
324
0.07 m2·ha-1·year-1in the dry plots, although the difference was not significant (P = 0.3). Stand basal
325
area increment was more than doubled in thinned stands, up to 0.41 ± 0.06 m2·ha-1·year-1 (difference
326
from the control : P<0.001), with no significant decrease under drier conditions (0.39 ± 0.06 m2·ha
-327
1·year-1, Table 3). Since the start of the experiment, a net annual loss of basal area (when mortality
exceeds the growth of the remaining stems) occurred in 3 years in the control plots and in 7 years in the 329
dry plots but never occurred in thinned plots. 330
The relative basal area (as the percentage of plot initial basal area) was strongly influenced by the 331
interaction between time, rainfall exclusion and thinning (P = 0.001, Table 3). In the unthinned 332
treatments, rainfall exclusion led to a slower progression of stand basal area (0.3 vs 0.8%.year-1; Figure
333
7A). After the initial reduction of basal area due to thinning, the increase in basal area was much faster 334
in thinned stand, reaching 1.4%.year-1 with no difference between the thinned and thinned dry plots. The
335
differences between thinned and unthinned plots thus progressively decreased over time: after 15 years 336
thinned stands had recovered about 95% of their initial basal area. 337
Stem and stool relative density were both influenced by the 3-way interaction between time, thinning 338
and rainfall exclusion (Table 3). Stem and stool densities decreased faster in the dry (slopes of -1.8 and 339
-2.1 %.year-1, respectively) than in the control treatment (slopes of -1.3 and -1.5%.year-1). In the thinned
340
treatments, after an initial reduction of stem and stool densities by about 50% and 36% due to thinning, 341
they remained stable in time (slope not different from 0) in both thinned and thinned dry plots. At the 342
end of the experiment, stem density was still higher in the unthinned plots (Figure 7B), but from 2010 343
(after 7 years of treatment) stool density was not significantly different between thinned and unthinned 344
plots (Figure 7C). 345
346
Figure 7: Evolution of Quercus ilex relative stand basal area (A), stem density (B) and stool density 347
(C) as a percentage of pre-thinning values in the different treatments. Data are means ± standard 348
error of 3 plots per treatment. 349
4. Discussion 350
4.1 Thinning and rainfall exclusion effects from the stem to the stand
351
Thinning strongly stimulated stem growth and increased the resistance to an extreme drought event, 352
thereby confirming the interest of this management practice to alleviate drought effects on stem growth 353
(Cabon et al., 2018b; Navarro-Cerrillo et al., 2019; Sohn et al., 2016b). Partial rainfall exclusion, in 354
contrast, had no effect on individual stem growth, probably because growth occurs mainly during spring 355
rainy periods when the difference in tree water stress between rainfall exclusion treatments is low 356
(Gavinet et al., 2019; Rodríguez-Calcerrada et al., 2011), and also because of a change in tree allocation 357
in favor of wood compared to leaves and fruits (Gavinet et al., 2019). The rainfall exclusion effect 358
appeared, however, as a shift of the size – mortality risk relationship toward the bigger individuals, 359
which led to more frequent losses of basal area and consequently a slower basal area increment at the 360
stand-level. In thinned stands, mortality was almost completely cancelled which, combined with the 361
faster growth, resulted in a stand basal area increment more than doubled compared to the control, 362
similarly to what was observed by Ogaya et al. (2019) in another Q. ilex stand. In our experiment, 363
thinning proved to have larger effects on stem growth and mortality than rainfall exclusion, in line with 364
recent studies at larger scales showing that competition is more important than climate in determining 365
forest demography (Fernández-de-Uña et al., 2015; Ruiz-Benito et al., 2013; Zhang et al., 2015). 366
The loss of stools from mortality appeared to happen faster than the loss of stems in the unthinned plots, 367
and this tendency was reinforced by the rainfall exclusion. The consequence of this phenomenon is a 368
progressive loss of unique genotypes within the coppice stand and an increasing level of clonality (ratio 369
of stems overs stools), especially under more stressful dry conditions. This result suggests that multi-370
stemmed stools survive better to the increased competition for water under rainfall exclusion (Fig. S2), 371
either because they grow in more favourable micro-habitats or because these individuals are better 372
genetically adapted to drought. Thinning, on the other hand, reduced the initial stool density in the plots 373
by 36%, but our experiment revealed that thinning maintained population sizes and did not induce 374
further loss of unique genotypes in the long-term. Interestingly, all treatments converged toward a 375
similar stool density by the end of our 15-year study. Drastic reductions in the number of unique 376
genotypes (by thinning and/or mortality) can lead to the loss of rare alleles (Danusevicius et al., 2016). 377
However, previous studies have shown that moderate thinning intensities have rather limited 378
consequences on genetic diversity in the long-term (Danusevicius et al., 2016; Koskela et al., 2013; 379
Valbuena-Carabaña et al., 2008). On the contrary, thinning has been shown to increase acorn production 380
in our experimental site (Gavinet et al., 2019), so it may result in positive effects on sexual regeneration 381
and seedling diversity (Lefevre et al., 2014). 382
4.2 Stem performances and thinning effects are linked to stem size and competition release
383
Stem size had a strong positive effect on stem growth, probability of survival and, to a lesser extent, 384
growth resistance to drought. The strong decrease in mortality risk with tree size has been often 385
evidenced in Mediterranean forests (Colangelo et al., 2017; Hülsmann et al., 2017; Ruiz-Benito et al., 386
2013) but contrasts with results from more humid forests (Bennett et al., 2015). This positive effect of 387
stem size on all stem performances may be linked to a better access of big trees to deep water (Kerhoulas 388
et al., 2013) and suggests that this holm oak stand, even 70 years after the last clear-cut, is still in a self-389
thinning dynamic where suppressed stems are more likely to die while dominant trees are still vigorous. 390
By selecting the biggest, most vigorous stems, thinning from below directly improved the mean stem 391
growth, survival and resistance to drought. Thinning thus anticipated the self-thinning: we can estimate 392
that about 60% of the stems and all the stools that have been cut would have died during the following 393
15 years (see Table 1; Figure 6b; Appendix. S2). This size-selection effect accounted for about half of 394
the thinning effect on stem growth. Conversely, the fact that rainfall exclusion limited the positive 395
influence of stem or stool size on the mortality risk could indicate a deeper depletion of water resources 396
in the dry treatment. 397
Thinning effects on stem growth were stronger for bigger stems, which were more able to respond to 398
competition release. A similar disproportionate effect of thinning on the bigger stems has previously 399
been found for Q. ilex (Cabon et al., 2018b; Mayor and Rodà, 1993), and for Q. faginea (Cañellas et al., 400
2004), while on boreal species Bose et al. (2018) found that tree size had no influence on the thinning 401
response and (Jones et al., 2009) that small trees responded more. In our experiment, thinning was made 402
from below by removing only the smallest stems so the increase in light availability was very limited 403
for the bigger, dominant trees. Competition release, that explained roughly half of the thinning effects 404
on stem growth and resistance to drought, is thus probably related to a release of competition for water. 405
Competition for water is indeed more symmetric than competition for light (Schwinning and Weiner, 406
1998), so that the suppression of small trees or even of understory shrubs can increase water availability 407
for big trees (Giuggiola et al., 2018). The stronger effect of competition release on bigger trees suggests 408
that they had a greater capacity to expand their root system to take up this additional water. Kerhoulas 409
et al. (2013) observed that bigger trees, but also trees growing in thinned stands, rely on deeper water 410
sources than small trees or trees in denser stands, suggesting that thinning indeed foster root expansion. 411
In addition, the higher relative importance of competition release compared to stem size for resistance 412
to an extreme drought event also points to the improvement of water availability as the main mechanism 413
for thinning effects during an extreme drought. This improvement of water availability may arise both 414
from a deeper rooting and from a decrease in stand-level transpiration (Gavinet et al., 2019), delaying 415
the depletion of water resources in thinned stands (Cabon et al., 2018b). 416
Remarkably, absolute values of local competition index had less influence on stem growth than 417
competition release. Given that the stand history is homogeneous, the low explanatory power of 418
neighbor basal area may reflect the fine-scale spatial heterogeneity of the soil rock fraction and water 419
holding capacity. Indeed, in this very rocky soil, a low value of neighbor basal area probably reflects 420
bad local conditions because the vegetation is expected to be in equilibrium with the local soil carrying 421
capacity (Cabon et al., 2018a; Eagleson, 1982). Absolute values of neighbor basal area after thinning 422
are thus a poor predictor of competition intensity, as these values already differed before thinning due 423
to soil heterogeneity. Interestingly, this may suggest that the same percentage of basal area removal 424
could be applied successfully across variable local soil conditions, although this remain to be assessed 425
in a more variable context. 426
4.3 Temporal evolution of treatment effects
427
Thinning effect on tree growth decreased with time as expected, but it remained positive 15 years after 428
thinning even though the stand almost recovered its initial basal area. This long lasting thinning effect 429
contrasts with studies in temperate forests where thinning effect can vanish in a few years (e.g. Bréda et 430
al., 1995). Slow growing species such as Q. ilex take longer to recover to their pre-thinning basal and 431
leaf area. In line with this idea, Bose et al. (2018) also observed that thinning effects lasted longer for 432
shade-tolerant species. In Mediterranean forests, thinning effects were observed to be maintained to a 433
similar level after 8 years in a Q. faginea stand (Cañellas et al., 2004) and to remain significant after 12 434
years in a Q. ilex stand (Mayor and Rodà, 1993) and after 20 years in Pinus halepensis stands (Manrique-435
Alba et al. 2020). In contrast, in a mixed stand including Q. ilex and Q. faginea, Cotillas et al. (2009) 436
found that growth stimulation after thinning vanished after only 2 years and attributed this to a fast and 437
intense resprouting in their low-density stand. Here, resprouting was rather intense in the first years after 438
thinning (Figure 5; Rodríguez-Calcerrada et al., 2011), particularly for big stools that had been 439
intensively cut as resprouting is known to be stimulated by previous stool size and thinning intensity 440
(e.g. Adamec et al., 2017). We then observed a decrease over time in resprouts number and summed 441
basal area in the thinned plots, meaning that resprout mortality was not compensated by resprout growth 442
probably because the thinning from below did not increase sufficiently light availability in the 443
understory. This contrasts with results by Retana et al. (1992) who observed that the decreasing number 444
of resprouts was compensated by their increasing size, so that the total biomass of resprouts remained 445
constant over time. Besides, no vegetative recruits were produced in the 15-year period following 446
thinning in our study. This confirms that our low-intensity thinning from below was effective at 447
controlling the resprouting dynamic in thinned stands, which probably participates in explaining the 448
long-lasting effects of thinning in our site. 449
As a consequence of this absence of recruitment and of the self-thinning mortality in unthinned stands, 450
stool densities are now similar in thinned and unthinned stands, and stand basal area is expected to 451
become similar in the coming years. In the future, both stands will thus converge to similar structures, 452
but generated either by management or by natural mortality. If drought sensitivity is partly genetically 453
determined, then natural mortality may select for the best adapted trees. On the contrary, thinning may 454
relax this selection and lead to maladaptive responses on the long-term, questioning the relevance of 455
such management for forest adaptation to climate change (Lefevre et al. 2014). Once competition release 456
has been offset by the growth of neighbors, frequent thinning may be needed to maintain positive effects 457
on drought responses (Sohn et al., 2016a). Here, the positive thinning effect on growth resistance to 458
drought has been highlighted only 3 years after thinning application and remains to be confirmed for 459
further extreme drought events. In our experiment, thinning removed the small trees that proved to be 460
more sensitive to drought in terms of growth and mortality, and has probably fostered root expansion, 461
which may also induce long-term positive effects on drought resistance. Whether this will be enough to 462
sustain an improved resistance to drought on the long-term, or whether natural mortality does a better 463
job in selecting for drought resistance, remain to be assessed in the future decades. 464
5 Conclusion and implications for management 465
This ageing oak coppice was still in a self-thinning phase 70 years after the last clear-cut, with a 466
progressively decreasing number of individuals and a low stem and stand-level growth. Long-term 467
increased drought by experimental rainfall exclusion led to the death of bigger trees than in the control 468
treatment, which slowed the stand basal area increment. Thinning from below can cancel the drought 469
effects by stimulating stem growth and avoiding mortality, even under chronic or extreme drought. The 470
basal area increment at the stand level was twice faster in the thinned stand, while the loss of unique 471
genotypes was not larger in the long-term than the one induced by natural mortality. Size-selection of 472
the most vigorous stems and competition release for belowground resources both participate to explain 473
thinning effects. Positive thinning effects diminished over time but remain significant after 15 years. By 474
applying a moderate thinning intensity (-30%), keeping the dominant tree layer and keeping at least one 475
stem on multi-stemmed stool, resprouting dynamic was rather limited, which may have participated to 476
the long-lasting thinning effects and is important for fire prevention. A test of this thinning regime in 477
other stands with differing climatic and edaphic conditions is required to confirm its benefits under a 478
wide range of situations. Thinning has also been shown to improve stand-level above-ground 479
productivity and fruit production while reducing water consumption (Gavinet et al., 2019), thus 480
confirming that it can be an efficient way to improve stand and tree vitality and to adapt the 481
Mediterranean coppices to climate change. Thinning oak coppices will also result in forests with bigger 482
trees, which may be used for other products than traditional fuel wood. 483
484
Acknowledgements 485
The Puéchabon experimental site belongs to the OSU OREME (UMS 3282) and the SOERE F-ORE-T, 486
supported annually by Allenvi and the French national research infrastructure ANAEE-France (ANR-487
11-INBS-0001). This research was supported by the “Fond Stratégique Forêt Bois” (FSFB) funded by 488
the French ministry of Agriculture and Food through the INNOV’ILEX project (MAA 2017). The 489
authors are indebted to Serge Rambal and Richard Joffre who designed and initiated the long-term 490
rainfall exclusion experiment in Puéchabon, and to Alain Rocheteau, David Degueldre and Karim 491
Piquemal whose efforts greatly contributed in maintaining it throughout the years. SNP genotyping was 492
performed at the Genome Transcriptome Facility of Bordeaux (Grants from Investissements d’Avenir, 493
EquipEx Xyloforest ANR-10-EQPX-16-01). 494
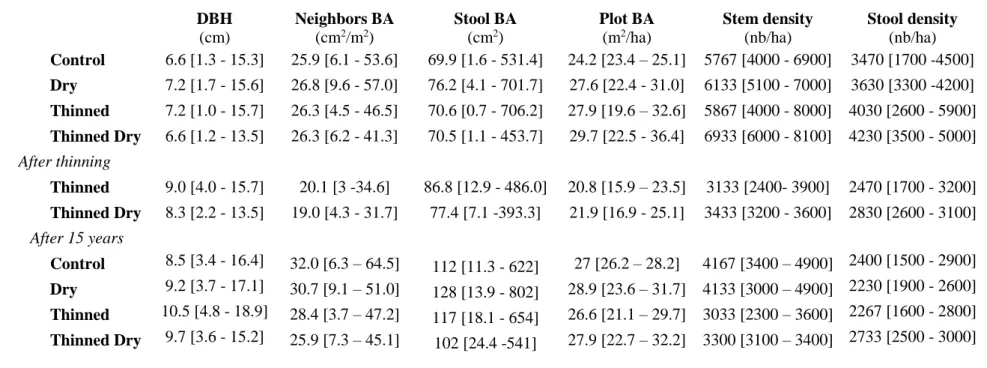
Table 1 : Stem, stool and stand characteristics before and after thinning. Means and range (within brackets) of the different metrics are shown. BA = Basal Area. 495
Neighbors basal area is calculated within a 3m-radius circle around each stem. 496 497 498 DBH (cm) Neighbors BA (cm2/m2) Stool BA (cm2) Plot BA (m2/ha) Stem density (nb/ha) Stool density (nb/ha) Control 6.6 [1.3 - 15.3] 25.9 [6.1 - 53.6] 69.9 [1.6 - 531.4] 24.2 [23.4 – 25.1] 5767 [4000 - 6900] 3470 [1700 -4500] Dry 7.2 [1.7 - 15.6] 26.8 [9.6 - 57.0] 76.2 [4.1 - 701.7] 27.6 [22.4 - 31.0] 6133 [5100 - 7000] 3630 [3300 -4200] Thinned 7.2 [1.0 - 15.7] 26.3 [4.5 - 46.5] 70.6 [0.7 - 706.2] 27.9 [19.6 – 32.6] 5867 [4000 - 8000] 4030 [2600 - 5900] Thinned Dry 6.6 [1.2 - 13.5] 26.3 [6.2 - 41.3] 70.5 [1.1 - 453.7] 29.7 [22.5 - 36.4] 6933 [6000 - 8100] 4230 [3500 - 5000] After thinning Thinned 9.0 [4.0 - 15.7] 20.1 [3 -34.6] 86.8 [12.9 - 486.0] 20.8 [15.9 – 23.5] 3133 [2400- 3900] 2470 [1700 - 3200] Thinned Dry 8.3 [2.2 - 13.5] 19.0 [4.3 - 31.7] 77.4 [7.1 -393.3] 21.9 [16.9 - 25.1] 3433 [3200 - 3600] 2830 [2600 - 3100] After 15 years Control 8.5 [3.4 - 16.4] 32.0 [6.3 – 64.5] 112 [11.3 - 622] 27 [26.2 – 28.2] 4167 [3400 – 4900] 2400 [1500 - 2900] Dry 9.2 [3.7 - 17.1] 30.7 [9.1 – 51.0] 128 [13.9 - 802] 28.9 [23.6 – 31.7] 4133 [3000 – 4900] 2230 [1900 - 2600] Thinned 10.5 [4.8 - 18.9] 28.4 [3.7 – 47.2] 117 [18.1 - 654] 26.6 [21.1 – 29.7] 3033 [2300 – 3600] 2267 [1600 - 2800] Thinned Dry 9.7 [3.6 - 15.2] 25.9 [7.3 – 45.1] 102 [24.4 -541] 27.9 [22.7 – 32.2] 3300 [3100 – 3400] 2733 [2500 - 3000] 499 500
Table 2: Parameters of the best individual model for stem growth, growth resistance to drought and 501
mortality risk. See model predictions on Figure 1B, 3B and 5. 502
Stem growth - log(BAI+1), cm2.year-1
Estimate Standard error
P - value
Intercept -0.21 0.05
<0.001
DBH 0.10 0.005
<0.001
Competition Release (CR) -0.38 0.25
0.14
DBH:CR 0.08 0.03
0.01
Basal Area of the neighbors (BAn) -0.004 0.002
0.02
r2 0.62
Stem resistance to drought – log(BAI2006/mean(BAI2003,BAI2004,BAI2005) +1)
Intercept 0.09 0.08
0.2
DBH 0.02 0.01
0.02
Competition Release (CR) 0.64 0.15
<0.001
r2 0.07
Mortality probability – log odds (mortality)
Intercept 4.9 0.6
<0.001
DBH -1.04 0.11<0.001
Competition Release (CR) -4.87 1.550.1
Rainfall exclusion 0.8 0.30.003
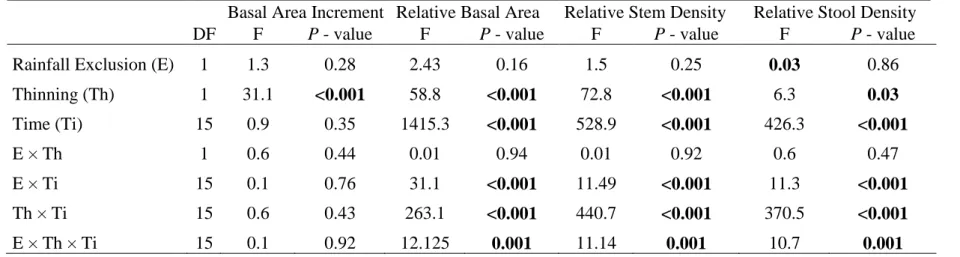
Pseudo-r2 0.48 503Table 3: Results of the linear mixed model analysis for stand-level evolution of basal area increment, relative basal area, relative stem density, and relative 504
stool density (as a fraction of initial situation at the start of the experiment in 2003) according to time and treatments. Significant P-values are highlighted 505
in bold. 506
Basal Area Increment Relative Basal Area
Relative Stem Density
Relative Stool Density
DF
F
P - value
F
P - value
F
P - value
F
P - value
Rainfall Exclusion (E)
1
1.3
0.28
2.43
0.16
1.5
0.25
0.03
0.86
Thinning (Th)
1
31.1
<0.001
58.8
<0.001
72.8
<0.001
6.3
0.03
Time (Ti)
15
0.9
0.35
1415.3
<0.001
528.9
<0.001
426.3
<0.001
E × Th
1
0.6
0.44
0.01
0.94
0.01
0.92
0.6
0.47
E × Ti
15
0.1
0.76
31.1
<0.001
11.49
<0.001
11.3
<0.001
Th × Ti
15
0.6
0.43
263.1
<0.001
440.7
<0.001
370.5
<0.001
E × Th × Ti
15
0.1
0.92
12.125
0.001
11.14
0.001
10.7
0.001
507References 508
Adamec, Z., Kadavy, J., Fedorova, B., Knott, R., Kneifl, M., Drapela, K., 2017. Development of Sessile 509
Oak and European Hornbeam Sprouts after Thinning. Forests 8, 308. 510
https://doi.org/10.3390/f8090308 511
Aldea, J., Bravo, F., Bravo-Oviedo, A., Ruiz-Peinado, R., Rodríguez, F., del Río, M., 2017. Thinning 512
enhances the species-specific radial increment response to drought in Mediterranean pine-oak 513
stands. Agric. For. Meteorol. 237–238, 371–383.
514
https://doi.org/10.1016/j.agrformet.2017.02.009 515
Allen, C.D., Macalady, A.K., Chenchouni, H., Bachelet, D., McDowell, N., Vennetier, M., Kitzberger, 516
T., Rigling, A., Breshears, D.D., Hogg, E.H. (Ted), Gonzalez, P., Fensham, R., Zhang, Z., 517
Castro, J., Demidova, N., Lim, J.-H., Allard, G., Running, S.W., Semerci, A., Cobb, N., 2010. 518
A global overview of drought and heat-induced tree mortality reveals emerging climate change 519
risks for forests. For. Ecol. Manag., Adaptation of Forests and Forest Management to Changing 520
Climate 259, 660–684. https://doi.org/10.1016/j.foreco.2009.09.001 521
Ameztegui, A., Cabon, A., De Cáceres, M., Coll, L., 2017. Managing stand density to enhance the 522
adaptability of Scots pine stands to climate change: A modelling approach. Ecol. Model. 356, 523
141–150. https://doi.org/10.1016/j.ecolmodel.2017.04.006 524
Bennett, A.C., McDowell, N.G., Allen, C.D., Anderson-Teixeira, K.J., 2015. Larger trees suffer most 525
during drought in forests worldwide. Nat. Plants 1, 15139. 526
https://doi.org/10.1038/nplants.2015.139 527
Binkley, D., Stape, J.L., Ryan, M.G., 2004. Thinking about efficiency of resource use in forests. For. 528
Ecol. Manag. 193, 5–16. https://doi.org/10.1016/j.foreco.2004.01.019 529
Bonal, R., Guichoux, E., Delcamp, A., Laizet, Y., Hampe, A., 2019. 70 highly validated SNP markers 530
for Quercus ilex. https://doi.org/10.15454/AOVOO2 531
Bond, W.J., Midgley, J.J., 2001. Ecology of sprouting in woody plants: the persistence niche. Trends 532
Ecol. Evol. 16, 45–51. https://doi.org/10.1016/S0169-5347(00)02033-4 533
Bose, A.K., Weiskittel, A., Kuehne, C., Wagner, R.G., Turnblom, E., Burkhart, H.E., 2018. Tree-level 534
growth and survival following commercial thinning of four major softwood species in North 535
America. For. Ecol. Manag. 427, 355–364. https://doi.org/10.1016/j.foreco.2018.06.019 536
Bottero, A., D’Amato, A.W., Palik, B.J., Bradford, J.B., Fraver, S., Battaglia, M.A., Asherin, L.A., 2016. 537
Density‐dependent vulnerability of forest ecosystems to drought. J. Appl. Ecol. 54, 1605–1614. 538
https://doi.org/10.1111/1365-2664.12847 539
Bréda, N., Granier, A., Aussenac, G., 1995. Effects of thinning on soil and tree water relations, 540
transpiration and growth in an oak forest (Quercus petraea (Matt.) Liebl.). Tree Physiol. 15, 541
295–306. https://doi.org/10.1093/treephys/15.5.295 542
Cabon, A., Martínez‐Vilalta, J., Aragón, J.M. de, Poyatos, R., Cáceres, M.D., 2018a. Applying the eco-543
hydrological equilibrium hypothesis to model root distribution in water-limited forests. 544
Ecohydrology 11, e2015. https://doi.org/10.1002/eco.2015 545
Cabon, A., Mouillot, F., Lempereur, M., Ourcival, J.-M., Simioni, G., Limousin, J.-M., 2018b. Thinning 546
increases tree growth by delaying drought-induced growth cessation in a Mediterranean 547
evergreen oak coppice. For. Ecol. Manag. 409, 333–342. 548
https://doi.org/10.1016/j.foreco.2017.11.030 549
Camarero, J.J., Sangüesa-Barreda, G., Vergarechea, M., 2016. Prior height, growth, and wood anatomy 550
differently predispose to drought-induced dieback in two Mediterranean oak speciesk. Ann. For. 551
Sci. 73, 341–351. https://doi.org/10.1007/s13595-015-0523-4 552
Cañellas, I., Río, M. del, Roig, S., Montero, G., 2004. Growth response to thinning in Quercus pyrenaica 553
Willd. coppice stands in Spanish central mountain. Ann. For. Sci. 61, 243–250. 554
Clarke, P.J., Lawes, M.J., Midgley, J.J., 2010. Resprouting as a key functional trait in woody plants – 555
challenges to developing new organizing principles. New Phytol. 188, 651–654. 556
https://doi.org/10.1111/j.1469-8137.2010.03508.x 557
Colangelo, M., Camarero, J.J., Borghetti, M., Gazol, A., Gentilesca, T., Ripullone, F., 2017. Size Matters 558
a Lot: Drought-Affected Italian Oaks Are Smaller and Show Lower Growth Prior to Tree Death. 559
Front. Plant Sci. 8. https://doi.org/10.3389/fpls.2017.00135 560
Cotillas, M., Sabaté, S., Gracia, C., Espelta, J.M., 2009. Growth response of mixed mediterranean oak 561
coppices to rainfall reduction: Could selective thinning have any influence on it? For. Ecol. 562
Manag. 258, 1677–1683. https://doi.org/10.1016/j.foreco.2009.07.033 563
D’Amato, A.W., Bradford, J.B., Fraver, S., Palik, B.J., 2013. Effects of thinning on drought vulnerability 564
and climate response in north temperate forest ecosystems. Ecol. Appl. 23, 1735–1742. 565
https://doi.org/10.1890/13-0677.1 566
Danusevicius, D., Kerpauskaite, V., Kavaliauskas, D., Fussi, B., Konnert, M., Baliuckas, V., 2016. The 567
effect of tending and commercial thinning on the genetic diversity of Scots pine stands. Eur. J. 568
For. Res. 135, 1159–1174. https://doi.org/10.1007/s10342-016-1002-7 569
del Campo, A.D., Fernandes, T.J.G., Molina, A.J., 2014. Hydrology-oriented (adaptive) silviculture in 570
a semiarid pine plantation: How much can be modified the water cycle through forest 571
management? Eur. J. For. Res. 133, 879–894. https://doi.org/10.1007/s10342-014-0805-7 572
del Campo, A.D., González-Sanchis, M., García-Prats, A., Ceacero, C.J., Lull, C., 2019. The impact of 573
adaptive forest management on water fluxes and growth dynamics in a water-limited low-574
biomass oak coppice. Agric. For. Meteorol. 264, 266–282. 575
https://doi.org/10.1016/j.agrformet.2018.10.016 576
Doblas-Miranda, E., Alonso, R., Arnan, X., Bermejo, V., Brotons, L., de las Heras, J., Estiarte, M., 577
Hódar, J.A., Llorens, P., Lloret, F., López-Serrano, F.R., Martínez-Vilalta, J., Moya, D., 578
Peñuelas, J., Pino, J., Rodrigo, A., Roura-Pascual, N., Valladares, F., Vilà, M., Zamora, R., 579
Retana, J., 2017. A review of the combination among global change factors in forests, 580
shrublands and pastures of the Mediterranean Region: Beyond drought effects. Glob. Planet. 581
Change 148, 42–54. https://doi.org/10.1016/j.gloplacha.2016.11.012 582
Ducrey, M., 1996. Recherches et expérimentations sur la conduite sylvicole des peuplements de chêne 583
vert. For. Méditerranéenne XVII, 151–168. 584
Ducrey, M., Toth, J., 1992. Effect of cleaning and thinning on height growth and girth increment in 585
holm oak coppices (Quercus ilex L.), in: Romane, F., Terradas, J. (Eds.), Quercus Ilex L. 586
Ecosystems: Function, Dynamics and Management, Advances in Vegetation Science. Springer 587
Netherlands, Dordrecht, pp. 365–376. https://doi.org/10.1007/978-94-017-2836-2_38 588
Eagleson, P.S., 1982. Ecological optimality in water‐limited natural soil‐vegetation systems: 1. Theory 589
and hypothesis. Water Resour. Res. 18, 325–340. https://doi.org/10.1029/WR018i002p00325 590
Fernández-de-Uña, L., Cañellas, I., Gea-Izquierdo, G., 2015. Stand Competition Determines How 591
Different Tree Species Will Cope with a Warming Climate. PLOS ONE 10, e0122255. 592
https://doi.org/10.1371/journal.pone.0122255 593
García, C., Guichoux, E., Hampe, A., 2018. A comparative analysis between SNPs and SSRs to 594
investigate genetic variation in a juniper species (Juniperus phoenicea ssp. turbinata). Tree 595
Genet. Genomes 14, 87. https://doi.org/10.1007/s11295-018-1301-x 596
Gavinet, J., Ourcival, J.-M., Limousin, J.-M., 2019. Rainfall exclusion and thinning can alter the 597
relationships between forest functioning and drought. New Phytol. 0. 598
https://doi.org/10.1111/nph.15860 599
Gavinet, J., Vilagrosa, A., Chirino, E., Granados, M.E., Vallejo, V.R., Prévosto, B., 2015. Hardwood 600
seedling establishment below Aleppo pine depends on thinning intensity in two Mediterranean 601
sites. Ann. For. Sci. 72, 999–1008. https://doi.org/10.1007/s13595-015-0495-4 602
Gebhardt, T., Häberle, K.-H., Matyssek, R., Schulz, C., Ammer, C., 2014. The more, the better? Water 603
relations of Norway spruce stands after progressive thinning. Agric. For. Meteorol. 197, 235– 604
243. https://doi.org/10.1016/j.agrformet.2014.05.013 605
Gentilesca, T., Camarero, J.J., Colangelo, M., Nolè, A., Ripullone, F., 2017. Drought-induced oak 606
decline in the western Mediterranean region: an overview on current evidences, mechanisms 607
and management options to improve forest resilience. IForest - Biogeosciences For. 10, 796. 608
https://doi.org/10.3832/ifor2317-010 609
Giuggiola, A., Bugmann, H., Zingg, A., Dobbertin, M., Rigling, A., 2013. Reduction of stand density 610
increases drought resistance in xeric Scots pine forests. For. Ecol. Manag. 310, 827–835. 611
https://doi.org/10.1016/j.foreco.2013.09.030 612
Giuggiola, A., Ogée, J., Rigling, A., Gessler, A., Bugmann, H., Treydte, K., 2015. Improvement of water 613
and light availability after thinning at a xeric site: which matters more? A dual isotope approach. 614
New Phytol. 210, 108–121. https://doi.org/10.1111/nph.13748 615
Giuggiola, A., Zweifel, R., Feichtinger, L.M., Vollenweider, P., Bugmann, H., Haeni, M., Rigling, A., 616
2018. Competition for water in a xeric forest ecosystem – Effects of understory removal on soil 617
micro-climate, growth and physiology of dominant Scots pine trees. For. Ecol. Manag. 409, 618
241–249. https://doi.org/10.1016/j.foreco.2017.11.002 619
Grömping, U., 2006. Relative Importance for Linear Regression in R: The Package relaimpo. J. Stat. 620
Softw. 17, 1–27. https://doi.org/10.18637/jss.v017.i01 621
Hegyi, F., 1974. A simulation model for managing jack-pine stands, in: Proceedings, Growth Models 622
for Tree and Stand Simulation, IUFRO S4.01–4. Department of Forest Yield, Royal College of 623
Forestry, Stockholm, Sweden, pp. 74–90. 624
Hülsmann, L., Bugmann, H., Brang, P., 2017. How to predict tree death from inventory data — lessons 625
from a systematic assessment of European tree mortality models. Can. J. For. Res. 47, 890–900. 626
https://doi.org/10.1139/cjfr-2016-0224 627
Jones, T.A., Domke, G.M., Thomas, S.C., 2009. Canopy tree growth responses following selection 628
harvest in seven species varying in shade tolerance. Can. J. For. Res. 39, 430–440. 629
https://doi.org/10.1139/X08-186 630
Keenan, R.J., 2015. Climate change impacts and adaptation in forest management: a review. Ann. For. 631
Sci. 72, 145–167. https://doi.org/10.1007/s13595-014-0446-5 632
Kerhoulas, L.P., Kolb, T.E., Koch, G.W., 2013. Tree size, stand density, and the source of water used 633
across seasons by ponderosa pine in northern Arizona. For. Ecol. Manag. 289, 425–433. 634
https://doi.org/10.1016/j.foreco.2012.10.036 635
Koskela, J., Lefèvre, F., Schueler, S., Kraigher, H., Olrik, D.C., Hubert, J., Longauer, R., Bozzano, M., 636
Yrjänä, L., Alizoti, P., Rotach, P., Vietto, L., Bordács, S., Myking, T., Eysteinsson, T., 637
Souvannavong, O., Fady, B., De Cuyper, B., Heinze, B., von Wühlisch, G., Ducousso, A., 638
Ditlevsen, B., 2013. Translating conservation genetics into management: Pan-European 639
minimum requirements for dynamic conservation units of forest tree genetic diversity. Biol. 640
Conserv. 157, 39–49. https://doi.org/10.1016/j.biocon.2012.07.023 641
Lechuga, V., Carraro, V., Viñegla, B., Carreira, J.A., Linares, J.C., 2017. Managing drought-sensitive 642
forests under global change. Low competition enhances long-term growth and water uptake in 643
Abies pinsapo. For. Ecol. Manag. 406, 72–82. https://doi.org/10.1016/j.foreco.2017.10.017 644
Lefèvre, F., Boivin, T., Bontemps, A., Courbet, F., Davi, H., Durand-Gillmann, M., Fady, B., Gauzere, 645
J., Gidoin, C., Karam, M.-J., Lalagüe, H., Oddou-Muratorio, S., Pichot, C., 2014. Considering 646
evolutionary processes in adaptive forestry. Ann. For. Sci. 71, 723–739. 647
https://doi.org/10.1007/s13595-013-0272-1 648
Lempereur, Martin‐StPaul, Damesin, Joffre, Ourcival, Rocheteau, Rambal, 2015. Growth duration is a 649
better predictor of stem increment than carbon supply in a Mediterranean oak forest: 650
implications for assessing forest productivity under climate change. New Phytol. 207, 579–590. 651
https://doi.org/10.1111/nph.13400 652
Limousin, J.-M., Rambal, S., Ourcival, J.-M., Joffre, R., 2008. Modelling rainfall interception in a 653
mediterranean Quercus ilex ecosystem: Lesson from a throughfall exclusion experiment. J. 654
Hydrol. 357, 57–66. https://doi.org/10.1016/j.jhydrol.2008.05.001 655
Linares, J.C., Camarero, J.J., Carreira, J.A., 2009. Interacting effects of changes in climate and forest 656
cover on mortality and growth of the southernmost European fir forests. Glob. Ecol. Biogeogr. 657
18, 485–497. https://doi.org/10.1111/j.1466-8238.2009.00465.x 658
Lloret, F., Keeling, E.G., Sala, A., 2011. Components of tree resilience: effects of successive low-growth 659
episodes in old ponderosa pine forests. Oikos 120, 1909–1920. https://doi.org/10.1111/j.1600-660
0706.2011.19372.x 661
Manrique-Alba À, Beguería S, Molina AJ, et al (2020) Long-term thinning effects on tree growth, 662
drought response and water use efficiency at two Aleppo pine plantations in Spain. Science of 663
The Total Environment 728:138536. https://doi.org/10.1016/j.scitotenv.2020.138536 664
Mayor, X., Rodà, F., 1993. Growth response of holm oak (Quercus ilex L) to commercial thinning in 665
the Montseny mountains (NE Spain). Ann. Sci. For. 50, 247–256. 666
https://doi.org/10.1051/forest:19930303 667
McDowell, N.G., Allen, C.D., 2015. Darcy’s law predicts widespread forest mortality under climate 668
warming. Nat. Clim. Change 5, 669–672. https://doi.org/10.1038/nclimate2641 669