Publisher’s version / Version de l'éditeur:
Proceedings 18th International Symposium on Ice, IAHR'06, 1, pp. 167-174, 2006
READ THESE TERMS AND CONDITIONS CAREFULLY BEFORE USING THIS WEBSITE. https://nrc-publications.canada.ca/eng/copyright
Vous avez des questions? Nous pouvons vous aider. Pour communiquer directement avec un auteur, consultez la
première page de la revue dans laquelle son article a été publié afin de trouver ses coordonnées. Si vous n’arrivez pas à les repérer, communiquez avec nous à [email protected].
Questions? Contact the NRC Publications Archive team at
[email protected]. If you wish to email the authors directly, please see the first page of the publication for their contact information.
NRC Publications Archive
Archives des publications du CNRC
This publication could be one of several versions: author’s original, accepted manuscript or the publisher’s version. / La version de cette publication peut être l’une des suivantes : la version prépublication de l’auteur, la version acceptée du manuscrit ou la version de l’éditeur.
Access and use of this website and the material on it are subject to the Terms and Conditions set forth at
How well can we predict ice loads?
Timco, G. W.; Croasdale, K. R.
https://publications-cnrc.canada.ca/fra/droits
L’accès à ce site Web et l’utilisation de son contenu sont assujettis aux conditions présentées dans le site LISEZ CES CONDITIONS ATTENTIVEMENT AVANT D’UTILISER CE SITE WEB.
NRC Publications Record / Notice d'Archives des publications de CNRC: https://nrc-publications.canada.ca/eng/view/object/?id=be022eab-224b-46c9-be6b-41555b50c23b https://publications-cnrc.canada.ca/fra/voir/objet/?id=be022eab-224b-46c9-be6b-41555b50c23b
Reprinted from:
Proceedings 18th International Symposium on Ice, IAHR’06 Vol. 1, pp167-174, Sapporo, Japan, 2006.
HOW WELL CAN WE PREDICT ICE LOADS?
G.W. Timco1 and K.R. Croasdale2
1
Canadian Hydraulics Centre, National Research Council, Ottawa, ON, K1A 0R6 Canada
2
K.R. Croasdale & Assoc., Calgary, AL, T2R 1M5 Canada
ABSTRACT
A study has been performed to investigate the general level of agreement of predicting ice loads from various international experts. The format followed that of three previous studies of this type carried out in 1988, 1994 and 1996. Four simple ice loading scenarios were developed and experts in ice mechanics were invited to predict the loads. Twenty-one Predictors took part in this study. The results show that there is a considerable improvement in agreement for loads generated by a level, first-year ice sheet on a vertical-sided structure. This improvement in agreement is attributed to new full-scale data which is publicly available. There is still a large range of predicted loads from first-year ridges (factor of five) and multi-year floes (factor of seven) interacting with a vertical-sided structure. There is a large range of disagreement (factor of over eleven) on predictions of level ice on a conical-shaped structure.
KEYWORDS: ice loads; sea ice, calculations, comparison, global load INTRODUCTION
Predicting ice loads is never easy. In even the simplest situation, there are several factors that complicate the calculation and often several assumptions must be made. However, an accurate estimate of ice loads is extremely important for the safe and economical design of offshore structures, bridge piers, ice management structures, etc. Because of this, there has been considerable research on ice loads. These include developing analytical models, physical model tests, field programs, and numerical models. In spite of this effort, there are often large discrepancies in the prediction of ice loads. In 1988, Sanderson did a survey of predicted ice loads by inviting several international experts to predict loads for a few very basic situations. He found a very wide spread in the predicted values and little consensus on the loads. These international predictions were later carried out by Shkhinek and others (1994) and Croasdale (1996). In all cases there was a large discrepancy with differences of almost an order of magnitude in the Croasdale study.
Since that time, there has been a considerable amount of new information from field measurements of ice loads. Moreover, there is a concentrated effort to develop an International Code for Arctic Structures (ISO Standard TC67/SC7/WG8). The question is, “How well can we now predict ice loads?” To better understand this, a set of simple
ice-structure interaction scenarios on a vertical and sloping ice-structure were sent to a number of leading international experts in this field. They were asked to predict the ice load for each of these loading situations. This paper presents the results.
ICE LOAD SCENARIOS
There are two different structural configurations and three different ice conditions for this exercise.
Structural Configuration #1 – Vertical-sided structure: A vertical-sided offshore structure of
100 m diameter lies offshore in Arctic waters. Assume that it is perfectly rigid and that it has a low friction coating.
Structural Configuration #2 – Conical Structure: A conical-shaped structure with a 45º slope
lies offshore in Arctic waters. The width of the structure is 50 m at the waterline. Assume that it is a perfect cone and that it has a low friction coating.
Ice Condition #1 – Level First-year Ice - A level first-year ice sheet of thickness 1.5 m
surrounds the structure for a distance of 50 km. The ice is level with no appreciable ridges or roughness. A wind gradually increases from 0 m/s to 25 m/s over a period of 12 hours. Ice velocity increases over the same period and reaches a maximum value of 0.05 m/s. Assume that there is no adfreeze at the beginning of the event.
Ice Condition #2 – First-Year Ridge - A first-year ridge with a sail of 2.5 m is embedded in a
sheet of 1.5 m thick first-year sea ice. The ridge is 1 km long and strikes the structure at an angle of 90º to the backbone of the ridge (i.e. the structure interacts with the long side of the ridge). The ice sheet is moving at a rate of 0.1 m/s. The event takes place in mid-January with the air temperature of -20ºC. There is little snow on the ridge or surrounding ice.
Ice Condition #3 – Multi-year Floe - A large drifting multi-year ice floe, approximately 1 km
in diameter impacts the structure at an impact speed of 0.5 m/s. The floe has thickness of 6 m, and an average temperature is -5ºC. The floe has some roughness but no significant ridges. The predictors were asked to provide their estimate of the 100-year load for four different scenarios as outlined in Table 1. No factor of safety was to be included in the calculation. They were asked to make reasonable assumptions if the information that they required was not supplied and to give a short (one or two sentence) description of their approach.
Table 1: The Four Scenarios
Scenario Structure Ice Conditions Approach used for estimating loads
1 Vertical 1 – Level Ice
2 Vertical 2 - Ridge
3 Vertical 3 – Multi-year Floe
THE PREDICTORS
The predictors were selected based on their knowledge of ice loads. They were informed that the results would be presented at the 18th IAHR Symposium on Ice, in Japan, and that the paper would include the List of Predictors, but their predictions would not be directly linked to them. Twenty-nine experts were chosen and invited to participate. Nineteen predictions were received from twenty-one predictors (in two cases, two predictors worked together and sent one prediction for both). Table 2 provides details on the List of Predictors.
Table 2: List of Predictors
Name Organization
Tom Brown University of Calgary, Calgary, AL, Canada George Comfort BMT Fleet Technology, Kanata, ON, Canada Karl Evers HSVA, Hamburg, Germany
Bob Frederking Canadian Hydraulics Centre, NRC, Ottawa, Canada
Knut Hoyland The University Courses on Svalbard, Longyearbyen, Norway Koh Izumiyama National Maritime Research Institute (NMRI), Tokyo, Japan Michelle Johnston Canadian Hydraulics Centre, NRC, Ottawa, Canada
Tuomo Karna VTT Technical Research Centre of Finland, Espoo, Finland Dan Masterson
Paul Spencer Sandwell, Calgary, AL, Canada
Mauri Määttänen Helsinki University of Technology, Espoo, Finland Dmitri Matskevitch ExxonMobil, Houston, TX, USA
Richard McKenna McKenna & Associates, Wakefield, QC, Canada Dennis Nottingham PND Consulting Engineers, Anchorage, Alaska, USA Dmitry Onishchenko GAZPROM, Moscow, Russia
Terry Ralston ExxonMobil (retired), Houston, TX, USA
Karl Shkhinek St. Petersburg Technical University, St. Petersburg, Russia Dev Sodhi CRREL (retired), Hanover, NH, USA
Pavel Truskov
Stanislav Vershinen Sakhalin Energy, Russia
Brian Wright Wright & Associates, Canmore, AL, Canada
THE RESULTS
Many of the Predictors indicated that they found this exercise both challenging and frustrating. This process highlighted the many assumptions and uncertainties that exist when trying to estimate an ice load on an offshore structure. Most of the Predictors attempted to estimate the loads for all four scenarios. Many mentioned that the third scenario with multi-year ice had the least degree of certainty for them. Table 3 lists the results of the predictions. Please note that the predictions in this table do not correlate with the names in Table 2. They have been shuffled so that the responses are anonymous.
The Predictors were asked to present a very short description of the approach that they used to calculate the loads for each of the scenarios. A few of them sent fairly length descriptions and comments, whereas the majority simply stated the general approach. These comments were collected and categorized by the authors according to one of four different approaches
mentioned: (1) use of Codes, (2) full-scale data, (3) analytical models, or (4) numerical models. In some cases, more than one was mentioned and it was not unambiguous which approach should be chosen for this analysis. If that was done as, for example, “an analytical model based on full-scale data”, the methodology would be categorized as full-scale data.
Table 3: Predictions for the Four Scenarios
1 2 3 4 1 150 175 100 18 2 210 605 660 60 3 199 No prediciton 125 No prediciton 4 200 270 210 25 5 190 270 No prediciton 50 6 250 430 700 28 7 127 185 201 73 8 190 310 400 60 9 120 172 630 21 10 160 250 450 18 11 164 164 210 23 12 225 450 375 15 13 265 190 360 80 14 300 190 No prediciton 31 15 210 265 460 55 16 150 120 350 140 17 193 311 634 12 18 210 289 323 16 19 220 200 300 No prediciton Average 196 269 382 43 SD 46 122 188 33 Scenario Predictor SCENARIO 1
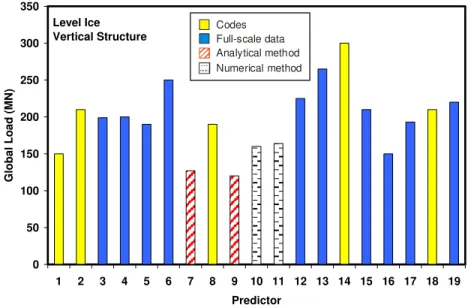
Scenario #1 asked for the prediction of the load due to a level sheet of first-year sea ice of 1.5 m thickness interacting with a vertical-sided caisson structure. Figure 1 shows the predictions. In general, there is quite good agreement amongst all of the predictors. A global load of 196 MN was the average value predicted with a standard deviation of 46 MN from this value. The majority of the Predictors cited full-scale data as the main source of information, especially the Molikpaq data published by Wright, Timco and Johnston.
SCENARIO #2
Scenario #2 asked for the prediction of a first-year ridge with a vertical-sided structure. Figure 2 shows the predictions. Values ranged from 120 MN to 605 MN (i.e. a factor of five difference) with an average value of 269 MN and a standard deviation of 122 MN. Thus, there is considerably more spread in the predictions compared to those for the level ice. The Predictors cited using full-scale data or analytical models as the basis for determining the loads.
0 50 100 150 200 250 300 350 1 2 3 4 5 6 7 8 9 10 11 12 13 14 15 16 17 18 19 Predictor G lo ba l Loa d ( M N ) Level Ice Vertical Structure Codes Full-scale data Analytical method Numerical method
Figure 1: Predictions for Scenario #1 with a level ice sheet interacting with a vertical-sided structure. The average of the predictions was 196 MN.
0 100 200 300 400 500 600 700 1 2 3 4 5 6 7 8 9 10 11 12 13 14 15 16 17 18 19 Predictor Gl ob al Lo ad ( M N ) First-year Ridge
Vertical Structure Codes
Full-scale data Analytical method Numerical method
Figure 2: Predictions for Scenario #2 of a first-year ridge interacting with a vertical-sided structure. The average of the predictions was 269 MN.
SCENARIO #3
Scenario #3 asked for the prediction of the load from a large multi-year floe interacting with a vertical-sided structure. Figure 3 shows the predictions. Predicted values ranged from 100 MN to 700 MN (i.e. a factor of seven) with an average value of 382 MN and a standard deviation of 188 MN. Note that two of the Predictors did not supply a prediction for this ice loading situation. Similar to Scenario #2, there was about an equal split in using full-scale data and analytical models for predictions.
0 100 200 300 400 500 600 700 800 1 2 3 4 5 6 7 8 9 10 11 12 13 14 15 16 17 18 19 Predictor G lo ba l Loa d ( M N ) Multi-year Floe
Vertical Structure Codes
Full-scale data Analytical method Numerical method
Figure 3: Predictions for Scenario #3 with the multi-year ice floe interacting with a vertical-sided structure. The average of the predictions was 382 MN.
SCENARIO #4
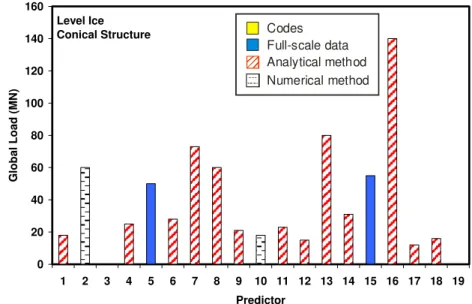
Scenario #4 asked for a prediction of the load from a sheet of level first-year ice on a conical-shaped structure. This scenario caused problems for many of the predictors since they had to make a number of assumptions regarding the friction of the structure and the height of ride-up on the cone. They were told that the ice would not ride-ride-up to interact with the deck of the platform. Figure 4 shows the predictions. Values ranged from 12 MN to 140 MN (factor of eleven difference) with an average value of 43 MN and a standard deviation of 33 MN. Two Predictors did not provide predictions for this situation. Most of the Predictors used an analytical model (either the Ralston or Croasdale model) to predict the loads.
0 20 40 60 80 100 120 140 160 1 2 3 4 5 6 7 8 9 10 11 12 13 14 15 16 17 18 19 Predictor Gl ob al Lo ad ( M N ) Level Ice
Conical Structure Codes
Full-scale data Analytical method Numerical method
Figure 4: Predictions for Scenario #4 with a level ice sheet interacting with a conical-shaped structure. The average of the predictions was 43 MN.
APPROACHES
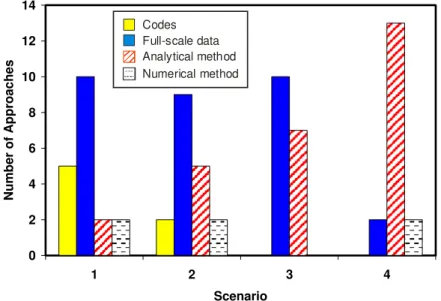
Figure 5 shows a summary of the approaches for each of the four scenarios. For the first-year level ice, the majority of Predictors based their estimate on full-scale data. For the first-year ridge and multi-year ice loading situations, there was more of a split between the approaches. The predictions for the loads on the cone were almost solely based on analytical models.
0 2 4 6 8 10 12 14 1 2 3 4 Scenario N u m b e r of A ppr oa ch es Codes Full-scale data Analytical method Numerical method
Figure 5: Bar chart showing the different approaches used to predict the loads for each of the four scenarios.
HAVE WE IMPROVED ON AGREEMENT?
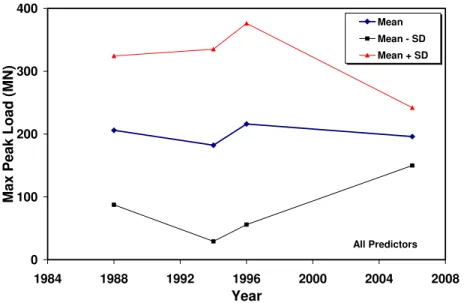
The results of the predictions, as shown in Figures 1 to 4, indicate that there are still considerable differences in experts’ predictions of ice loads. The question is: “Have we reached better consensus than in the past?” To investigate this, it would be necessary to compare the mean and standard deviations of the predictions to those from the previous Ice Load Consensus (ILC) studies. This, unfortunately, can only be done for one of the scenarios – Scenario #1. This is the only scenario which was used in all the previous three studies. Figure 6 shows a comparison of the mean predictions and the mean ± one standard deviation for each of the four ILC studies. These represent the predicted loads from a level sheet of first-year ice on a vertical-sided structure. It is interesting to note that the predicted mean values are quite similar for each of the studies. However, there was a very high standard deviation about the predicted mean for each of the previous three studies. There is a considerable improvement in agreement with this study. The range of predicted values is significantly reduced. The authors attribute this to better knowledge and use of measured full-scale data.
CONCLUSIONS
The results of this study show some very interesting trends. There is significantly better agreement now on predictions than in the past of loads from level, first-year sea ice on vertical structures. Most predictions are based on full-scale data. There is still considerable variation in the loads predicted for the interaction of a first-year ridge or a multi-year floe
interacting with a structure. A variety of approaches were used for predictions based on either analytical models or (limited) full-scale data. There is a similar wide range in predictions of level ice interacting with a conical structure. In this case, most Predictors used analytical models which were not based on full-scale data since this type of data is not available.
0 100 200 300 400 1984 1988 1992 1996 2000 2004 2008 Year Ma x Pe ak Load (MN) Mean Mean - SD Mean + SD All Predictors
Figure 6: Comparison of predictions of design loads from a first-year ice sheet interacting with a vertical-sided structure.
Overall, the authors feel that the improved agreement in predictions and confidence with level, first-year ice largely reflects the availability of full-scale data for this loading situation. Significant improvements for other loading scenarios will only come about once full-scale data are measured and made readily available to the ice engineering community.
ACKNOWLEDGEMENTS
The authors would like to thank all of the Predictors for their time and patience in this study. Also, GT would like to acknowledge financial support from the Program of Energy Research and Development (PERD) through the ice-structure interaction program.
REFERENCES
Croasdale, K. R. (1996). “Ice Load Consensus Study”. K.R. Croasdale Report to Joint Industry Partners, Calgary, AL, Canada.
Sanderson, T.J.O. (1988). “The Ice Load Question: Some Answers.” in Proc. IAHR Symposium on Ice, Vol. 2, pp 740-748, Sapporo, Japan.
Shkhinek, K., Bhat, S., Blanchet, D., Croasdale, K.R. and D.G. Matskevitch. (1994). “Comparison of the Russian and Foreign Codes and Methods for Global Load Estimation.” Proceedings, OMAE’94, Houston, TX, USA.