HAL Id: halshs-00937179
https://halshs.archives-ouvertes.fr/halshs-00937179
Submitted on 28 Jan 2014HAL is a multi-disciplinary open access archive for the deposit and dissemination of sci-entific research documents, whether they are pub-lished or not. The documents may come from teaching and research institutions in France or abroad, or from public or private research centers.
L’archive ouverte pluridisciplinaire HAL, est destinée au dépôt et à la diffusion de documents scientifiques de niveau recherche, publiés ou non, émanant des établissements d’enseignement et de recherche français ou étrangers, des laboratoires publics ou privés.
Intra-Firm Diffusion of Innovation: Evidence from
Tunisian SME’s in Matters of Information and
Communication Technologies
Adel Ben Youssef, Walid Hadhri, Hatem M’Henni
To cite this version:
Adel Ben Youssef, Walid Hadhri, Hatem M’Henni. Intra-Firm Diffusion of Innovation: Evidence from Tunisian SME’s in Matters of Information and Communication Technologies. Middle East Develop-ment Journal, Taylor Francis, 2011, 3 (1), pp.75-97. �halshs-00937179�
INTRA-FIRM DIFFUSION OF INNOVATION: EVIDENCE
FROM TUNISIAN SME’S IN MATTERS OF INFORMATION
AND COMMUNICATION TECHNOLOGIES
Abstract
The aim of this paper is twofold: first, we want to explore the intra-firm diffusion of information and communication technologies (ICT) within the Tunisian firms and to characterize its general trends of adoption and usage. Second, we want to emphasize the rank and epidemic effects stressed by the disequilibrium models of intra-firm diffusion of innovation following the traditional view of (Mansfield, 1963, Antonelli 1985). Based on face-to-face questionnaires of a random sample of 175 firms our paper shows that: (i) three technological waves of ICT adoption are well characterized in the Tunisian manufacturing sector. This dynamic of adoption is linked to the age of the technologies. Time is the main explanatory variable for intra-firm diffusion of these technologies. (ii) A positive correlation between the size of the firm, seniority and the depth of adoption is found. These econometric estimates show that the rank effect is well characterized within the Tunisian firms. (iii) A positive correlation between technological absorptive capacity building and intensity of ICT usage is found. This correlation confirms the epidemic effect. (iv) Our results show that disequilibrium models’ explanations of intra-firm diffusion of innovation are valid within the Tunisian manufacturing sector and seem more appropriate than the equilibrium theory for developing countries.
Introduction
Information and Communication Technologies (ICT) are widely considered one of the most important engines of growth since the late 1990s (Bresnahan and Trajtenberg, 1995 Helpman, 1998 and Antonelli, 2003). They impact the nature and scope of the firms by cutting costs and transforming the market’s borders. Several studies have recommended that firms and governments should invest in these technologies. Strong evidence is found between the adoption of such technologies and the improved performances of firms worldwide (OECD, 2004).
These technologies offer effective opportunities for firms to reach a larger market share by allowing them to compete in the global market. They facilitate the opportunity to cut costs by better coordination and by outsourcing some applications like human resources or accounting. They also present opportunities by building more efficient information systems and doing some workflow tasks. However, to reach efficient outcomes, the adoption of these technologies still remains insufficient. Some firms and their employees have access to all the ICT equipment whether or not they would intensively use them. The questions of the intensity and nature of usage are becoming central.
Astebro (2004), among others, proposed to focus more on the effective usage and intensity of usage (depth of adoption) and less on the adoption of ICT itself. In fact the intensity of usage reveals how people are engaging in better coordination, more efficient production systems and more flexible practices within the firms. Astebro’s observation is extremely important when we look at firms of developing countries. From the macroeconomic point of view, data gathered by the International Telecommunication Union (ITU) shows that developing countries are bridging the gap of ICT equipment, however little is known about the microeconomics of usage intensity. Differences in the expected effect of these technologies between developing and developed countries are important and may lead to different patterns of usage and then will need an appropriate economic argument.
Starting from these observations, the aim of this article is twofold. First, we want to characterize different patterns between adoption of ICT and the depth of adoption of ICT in the context of a small open developing country (Tunisia). Our article relies on the theoretical background of intra-firm diffusion of technologies initiated by Mansfield (1963) and Antonelli (1985). Second, we want to emphasize the relationship between the depth of adoption and the main characteristics of the firm (size, age and time of adoption) in order to validate the models of intra-firm diffusion and innovation.
The paper is organized as follows. Section one summarizes the related literature and examines some of the firms’ features that, in the rest of the paper, will be used as explanatory variables of ICT adoption. Section two presents our main hypothesis, the sample’s characteristics and the descriptive analysis. Section three is dedicated to the econometric analysis. Section four discusses the results and section five concludes.
1. Theoretical Background
The theoretical starting point for our analysis is the well-established literature on new technology adoption. This literature points out the delays in the adoption of new technology and differences in adoption rates across firms, industries and countries. To understand the adoption and diffusion of ICT as a new technology it is essential to uncover the factors that explain this delay and the variation in the rates of its adoption. Three theoretical backgrounds explain the intra-firm diffusion.
The first is the epidemic models (Mansfield, 1963; Antonelli, 1985 Levin et al., 1992). In this approach it is assumed that the use of a technology increases over time as the risk attached to
further adoption is reduced through learning. Thus, it’s assumed that the usage pattern is S-shaped curve following a logistic curve. Starting from this point of view, the older the adoption of the technology the more is the intensity of usage. The usage of such technology is not related to the cost/benefit analysis which is why such an approach is called disequilibrium approach. Only time matters.
The second type is called the equilibrium models. Stoneman and Battisti (1997) suggest that the pattern does not increase monotonically from the first date of adoption. They rely to the equilibrium approach, which suggests a non-linear and discontinuous diffusion pattern. « At
each moment, technology use in time t will only extend to the point where the marginal expected profit gain from further adoption equals the cost of adoption (appropriately defined) of the new technology. Over time either the marginal gain and/or the cost of adoption may change and as they do so the level of use will change. (Battisti and Stoneman (2005)». In this
approach, the intensity of usage may differ from one firm to another and may vary in each period depending on the cost/benefit approach. The perceived value of the marginal benefits may vary strongly.
An alternative approach where both inter and intra-firm margins are considered simultaneously is extensively explained by Battisti and Stoneman (Battisti, 2000; Battisti and Stoneman, 2003, 2005, 2009). The general idea is that the inter-firm phenomenon may be more important in the earlier stages of diffusion, whereas the intra-firm effect may become more relevant at later stages of the diffusion. This model is based on two theoretical trends: the diffusion view, and the neo-Schumpeterian approach. Diffusion models emphasize the impact of rank, stock and epidemic effects on the firms’ ICT adoption. This work emphasizes these types of diffusion determinants. The neo-Schumpeterian approach introduced the notion of the firms’ selection capacity and reinforced the role of technological capabilities and knowledge absorption capacity.
The debate between these opposite approaches is a debate about the determinants of depth of usage of these technologies over time. While the disequilibrium approach stresses time, learning and capabilities as basic determinants of the intra-firm diffusion of technologies, the equilibrium approach mention the return on investment, costs of technologies and the perceived value of the usage as the main determinants. Our article tries to contribute to this debate by examining two types of ICT determinants of adoption and usage (rank and epidemic effects). In fact the data gathered by our survey does not allow us to explore the stock effect. This was the case also for other studies where rank effect and stock effects were computed together without lack of generality (Battisti and Stoneman, 2005).
1.1. Rank effect
In order to discuss the rank effect we will focus on two main determinants: size and firm seniority. These two variables are commonly considered by the intra-firm diffusion literature as the main variables able to detect the rank effect. Starting from the equilibrium theory of intra-diffusion of technology, size cannot matter. In fact, since the intensity of usage depends on the returns of the technology, there’s no need to have a monotonic relation between size and usage.
However, a positive relationship between size and intensity of use (depth of adoption) may confirm the disequilibrium and epidemic theory, which suppose a relationship between size and usage intensity (depth of adoption). The main argument relies on the capability of the firm to reduce uncertainty and risk associated with further usage of the technologies. This fact— supported by empirical literature— shows that the adoption of new technologies is more likely when the size of firms is larger. Firm size is commonly used in the empirical literature on new technology adoption because it is easy to observe and it serves as a proxy
for several arguments. Different explanations are given in order to justify why large firms are more able to adopt and use new technologies (Fabiani et al., 2005; Morgan et al., 2006; Thong, 1999). First, SMEs rather show a daily use of digital technologies, but need to be assisted to reach more efficient use. They need to build a “technological absorptive capacity”. Therefore, the larger a company the wider is its “technological absorptive capacity”. ICT are general purposes technologies (Bresnahan and Trajtenberg, 1995). They are not mature by nature and need to be adapted to firms’ specific needs. Larger firms are more able to dedicate people to these tasks and to the resolving of problems linked to ICT usage. Secondly, it’s well known that these technologies are network technologies. Hence, the size of the firm is an objective dimension of the size of the network. Firms use these technologies in a more effective way as they grow bigger. There is a need for more coordination among workers and staff. They need more information about these tasks. For example, the need for implementing an Intranet application is correlated to the firm’s size.
From the equilibrium theory’s point of view there’s no specific reason for a correlation between the firm’s seniority and the intensity of usage. In fact, since the usage depends on the marginal expected revenue; different firms with different ages may use the technology differently. However, from the disequilibrium theory, seniority may be correlated with the experience of usage and its absorptive capacity of using the technology. A positive relationship may be found between seniority and intensity of usage (intra-firm diffusion of the technology). This confirms then that the innovation follows an S-shaped model of diffusion.
1.2. Epidemic effect
Epidemic effect refers to the fact that technology is more used when other firms use it. Two main variables were selected in order to test the epidemic effect: adoption time and website development. The adoption time considered reveals that firms are more likely to use these technologies as time goes by. The novelty of our approach is that most of the literature considers the evolution of the number of firms adopting a considered technology considering time. In our work we consider the speed of adoption of a technology within the firms. There are two main justifications for our hypothesis. First, the number of firms adopting the considered technology is correlated with the speed of adoption. Since then the usage of one or the other of these variables is sufficient. Another argument is that in the context of our study, since the sample is not too large, the evolution of the proportion of firms using a particular technology may not reveal the true dynamics. The speed of adoption by firms is more able to show this dynamics as well as the patterns of adoption and usage.
The second variable is to consider a website. In fact, firms invest in having a website in order to have better communication for their production as well as better visibility. The situation described seems like a coordination game. Firms are moving from an equilibrium where no one has a website to a situation where all firms have their own website. The evolutionary dynamics of adoption seems to be working well; the more firms adopting a website the higher the probability of a given firm to invest in designing a website. This variable is important for detecting this epidemic effect, as nowadays consumers are changing their habits.
1.3. Technological absorptive capacity effect
Technological absorptive capacity is linked to the uncertainty and risk reduction when using a particular technology. In fact, firms may invest to reduce this risk in human capital and build a technological absorptive capacity. The more the firms invest in human capital and in “framing” the more the technology is spread over the firms. The rate of framing is then considered a proxy for risk reduction and may be considered as a first step to having an epidemic effect. Several studies have pointed that in order to reach the optimal use of a given
technology, firms’ capabilities in matter of technologies help them to better use other type of technologies. Lal (1999) pointed out that Indian firms manufacturing electric and electronic goods have a higher probability of adopting ICTs when: (i) the managing directors have a high level of education, (ii) the firm’s skill intensity is high, and (iii) the managers have a clear strategic vision of R&D importance. Arvanitis and Hollenstein (2001) provided clear evidence of these multiple effects using firm-level data for Swiss manufacturing. They underlined that AMT adoption is positively influenced by the share of employees with qualifications at the tertiary level. Hollenstein (2004) used an ordered probit model to test the ICT adoption behavior of Swiss firms. He confirmed the influence of several determinants such as rank and epidemic effects, as well as new workplace practices. He also showed that the firm’s absorptive capacity— captured by variables measuring the level of employees’ qualification, the participation in ICT-oriented training courses and the firm’s innovative behavior— has a significant positive impact on ICT adoption.
In our study we will approximate this technological absorptive capacity by the variable rate of frame. The higher the rate, the more likely the firm will invest in ICT-using capabilities. 2. Hypothesis, Sample and Descriptive Analysis
2.1. Hypothesis
The aim of our work is to test three hypotheses related to the depth of adoption of ICT (intra-firm diffusion of innovation) in the context of an emerging country like Tunisia.
Hypothesis 1 (S-shaped diffusion pattern): The main determinant of ICT diffusion is time. This hypothesis confirms the view of Mansfield (1963).
Proposition 1: Three types of ICT clusters diffusion patterns are identified depending on the seniority of the technologies.
Hypothesis 2 (Rank Effect): The firm size and its seniority exert a positive effect on usages and equipment. They confirm the Rank effect and the disequilibrium theory.
Hypothesis 3 (Epidemic Effect): Depth of usage of ICT is positively correlated to adoption time and the possession of a website.
In order to demonstrate our hypotheses we will present the sample as well as the data, and then we will confirm the first hypothesis by descriptive analysis and the other two by econometric estimations.
2.2. The sample
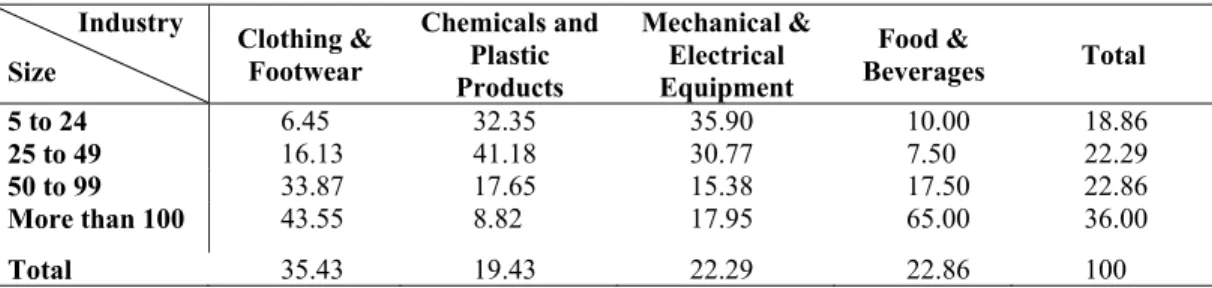
The data for this study was gathered by a face-to-face survey administrated to a random sample1 of 175 firms in Tunis, the largest of Tunisia’s metropolitan cities, during the period June 2004 to February 2005. Out of 320 surveys distributed, 205 were completed. However, only 175 usable surveys were retained for data analysis, providing a response rate of nearly 55%. Table 1 summarizes the size of the firms and their sectoral belonging.
In spite of this, the qualitative findings of the survey are very likely to hold in a much broader setting since our sample has all the characteristics that make it stand as a good representation of stable and viable Tunisian firms. As we shall also see below, there are no size and industry- specific traits that would make it difficult to generalize our results. Firms belonging to high-tech industries are relatively rare (although not absent). This characteristic, in our opinion, makes our study particularly interesting when it comes to investigating ICT
1
We remind that all the Tunisian manufacturing sector is composed of about 5500 firms with more than 10 employees.
penetration and usage in major Tunisian (and to some extent the Southern Mediterranean) regions, and not only the most advanced ones.
Before its implementation, three professors checked the questionnaire in order to ensure its consistency2. Each survey contained a cover letter explaining the purpose of the study. For each firm, the participation of the contact person was voluntary and participants were assured that their answers would be treated with confidentiality. All respondents were from the top management.
The obtained dataset contains various types of information: (1) general characteristics of the firm such as size, sector and legal status, (2) usage and depth of use of the considered technologies (3) factors influencing (positively or negatively) the use of ICTs, (4) strategic use of ICTs, (5) adoption of new organizational practices and (6) ICT and the workplace. Firms with less than 100 employees account for approximately 64% of the sample for the reasons explained before. Among them, small firms (having between 5 and 49 employees) prevail. According to the definition of SMEs adopted by the EU, medium-sized firms are added to the small ones, which leave us with a share of less than 5% for large firms in the sample.
As far as the industry distribution is concerned, SMEs are particularly concentrated in consumer goods industries, such as Food & Beverages and Clothing & Footwear. There is a realistic representation of two other sectors, Mechanical & Electrical Equipment (22,3%) and Chemicals & Plastic products (19,4%).
2.3. Three waves of ICT and S-shaped curve of ICT diffusion
Our data processing confirms that ICT are general purposes technologies (GPTs) and heterogeneous clusters composed of at least three main waves of technologies. All our indicators — adoption level of ICTs, depth of usage of ICTs and time required to use particular ICTs (see Table2) — show that there is a:
First wave — first generation technologies — assumed to be relatively widespread (more than 80%), intensively used (between 4 and 5 on Likert scale) and rapidly introduced in all business sectors. These technologies are: fixed phones, fax, office computers and general purpose software.
Second wave — intermediate technologies — with high potential of use. In the mid of the nineties such technologies were named new ICTs like Internet, E-mail, free software, and mobile phones.
Third wave — up to date technologies — are based on networking. They are the latest technological generations of ICTs. Most of them need, to optimize their use, costly investments, knowhow and qualified human resources. These technologies are: Intranet, laptops, videoconference (VC) and Electronic Data Interchange (EDI).
Our last result is in accordance with similar studies like those of Lucchetti and Sterlacchini (2004). These authors identified three types of ICTs: General-use ICTs (reflected essentially by our first and second generations of ICTs), production-integrating ICTs basically Intranet and EDI and market-oriented ICTs identified by the presence and the content of a firm’s website. However, our classification seems to be close to the disequilibrium dynamics where only time matters.
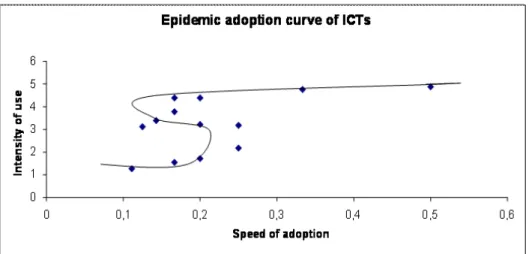
Figure 1 below reflects a link between the speed of adoption (estimated by the opposite of the time required to use a particular ICT) and the intensity of use (according to the Likert scale) of the chosen technologies. The relation takes the form of an S-shaped curve (sigmoid)
2
reminiscent of the Mansfield hypothesis. In the first part of the graph we find technologies with low intensity and low speed as they are the newest (third wave), then we find technologies characterized by low speed and a relatively high intensity of use. They are the second wave of ICTs. Finally old technologies with high speed of adoption and high intensity of use are localized at the top of the curve.
In order to highlight the depth of adoption of ICTs and its main determinants we discriminate between these waves of technologies and focus only on the second and third.
This descriptive analysis shows clearly that there is a first confirmation of the disequilibrium theory of innovation diffusion. Time seems to be one of the more important variables that explain the patterns of diffusion, as the dynamics seems to be cumulative. One of the most important reasons may be the rationality of the entrepreneurship in the Mediterranean area with regards to technology (Bellon, Ben Youssef & M’henni, 2006). Bounded rationality seems to be the rule as there is lack of awareness of the possibilities offered by ICT (Bellon, Ben Youssef and M’henni, 2007). Further investigations are needed in order to understand whether the more stabilized effects also confirm this theory.
3. Econometric Analysis 3.1 Econometric models
3.1.1. ICT adoption model
To study the relationship between ICT adoption and usage and their determinants (rank and epidemic effects) we use an ordered probit econometric model. The aim of the model is to determine the effect of a given factor on the probability of ICT adoption and use by the firm. This method allows the study of impacts of different factors on a multinomial ordered variable. This method is widely used for similar studies (Galiano and Roux, 2006, Bocquet and Brossard, 2007).
The basic variables of our study are binary and qualitative. Firms’ answers give us the information on whether they adopt a particular technology or not. For example, a firm indicates if it chooses the adoption of Intranet or not. Since we have various types of binary variables, they are gathered with different types of scores, in order to formulate a total score of ICT adoption. This gives us the multinomial character of this distribution (because it is composed of various methods) and the ordered character (because it is deduced starting from other binary variables).
Starting from these hypotheses, we use the ordered probit models. The explained variable is subscripted from 1 to 13 for the adoption score. These variables are thus discrete and ordinate. A probit multinomial model would thus neglect the ordinality of the dependent variable, while a linear regression would treat the difference between indices 3 and 4 in the same way that it treats the difference between indices 1 and 2, whereas this corresponds only to one classification. Thus, in these two cases, the estimators would be biased (Greene, 2000; Thomas, 2000).
The models commonly used for these types of variables are the ordered logit and probit models. These models are founded on the estimation of a continuous latent variable, subjacent with the subscripted variable of interest. In an ordered probit model, the residual associated with this latent variable is supposed to follow a normal law. Following this method, it is possible to study the influence exerted by series of factors on a multinomial ordered variable (Greene, 2000; Thomas, 2000). The ordered probit models are generally based on probability. The latent model is similar to a binomial probit.
i i
i x
Where y is an unobserved, continuous and latent measurement of ICT use, *i xi is a vector of
endogenous variables, β is the vector of the parameters and,
ε
i is the residual error thatfollows a normal distribution. In the case of the multinomial ordered probit, one observes that for i j i j i j if c y c y = < * < +
where j=0, 1 ... j represent the various technologies of the endogenous variable. The observed coded variables, yi are determined by the following model:
, , 2 , 1 , 0 * 1 3 * 2 2 * 1 1 * J i J i i i i y if J y if y if y if y μ μ μ μ μ μ μ < < = < < = < < = < < ∞ − = − M
where
μ
k is an unknown parameter that must be estimated with the vector β.The estimation of the model enables us to obtain the probabilities of realization of each index of the dependent variable. These probabilities are given by:
) ( 1 ) ( Pr ) ( ) ( ) 3 ( Pr ) ( ) ( ) 2 ( Pr ) ( ) 1 ( Pr ) ( ) 0 ( Pr ' 1 ' 2 ' 3 ' 1 ' 2 ' 1 ' i J i i i i i i i i i i i x J y ob x x y ob x x y ob x y ob x y ob β μ φ β μ φ β μ φ β μ φ β μ φ β μ φ β φ − − = = − − − = = − − − = = − = = − = = − M
with φ representing the normal law function distribution. The adjustment of the model is done by the maximum likelihood estimation (Maddala and Flores, 2001) and written as follows:
∏∏
= = = N i J j y ij x ij F L 1 0 ) , ( βLet us note that the marginal effects of the explanatory variables xi on the probabilities are
not equal to the coefficients. Thus, only the signs of the coefficients will be interpreted here and not their values. We try to model first the intensity of adoption of ICT and then the intensity of usage of various ICT tools.
The basic model specification estimated for the ICT adoption score yi1 is as follows:
2 0 1 2 3 4 5
Firms were asked to classify themselves, on a 5 points ordinal scale, according to the answer3 that best described their intensity of usage of ICT tools. The ICT tools list included the thirteen tools listed in Table 2. The weighted values were added across all ICT tools listed to yield a total intensity of ICT use score. Higher scores represented more intensity of use. Thus, a score of 65 indicated that a firm used all thirteen tools intensively.
Data was analyzed using multiple regression analysis with a stepwise procedure used to determine the relative importance of a set of independent variables in determining the firm’s intensity of ICT use score. We estimate a linear model of type:
Where is total intensity of ICT use score, a vector of endogenous variables, β the
vector of the parameters and, ui the residual error, which follows a normal distribution.
Data was analyzed using multiple regression analysis with a stepwise procedure used to determine the relative importance of a set of independent variables in determining the firm’s intensity of ICT use score. We estimate a linear model of type:
The data was analyzed using STATA, v. 10.0, to estimate the models. The data was examined for violation of the assumptions underlying multivariate methods prior to the analysis.
3.2 Variables
3.2.1. Dependant variables
In our study we consider two models for two different dependant variables. Our dependent variables are obtained starting from the calculation of a total score of ICT adoption and a score of ICT uses.
Variables measuring ICT adoption
Firstly, we calculate the stock of the thirteen ICT tools cited above adopted by the firms: 1: Fixed telephone, 2: Fax, 3: Desktop machine, 4: Generic software, 5: Mobile phone, 6: Internet… Every firm has a score between 0 and 13. The variable used here is an ordered polytomic variable characterizing the adoption of the ICT (score of adoption).
These ICT variables are all binary, in which value ‘0’ means that the considered technology is not adopted by the firm and value‘1’ means that it is adopted.
Therefore this variable is presented as follows:
⎪ ⎪ ⎪ ⎩ ⎪⎪ ⎪ ⎨ ⎧ = = = = equipments if y equipments two if y equipment one if y equipment zero if y i i i i 13 13 2 1 0 M
yi represent the dependant variable of the adoption of ICT by the firm i. This variable will be
estimated by different explanatory variables (Xi).
3
Variables measuring intensity of ICT use
In this paragraph, we chose to analyze the intensity of ICT use, not according to the previously adopted tool (Internet, Computers, EDI…), but according to the firm’s effective usage intensity. The variable used here is a continuous variable which characterizes the intensity of the ICT use (score of usage). In our study we are going to use only the scores of waves 2 and 3 as previously identified. We suppose that the first wave is so general that its technology is used intensively by all the firms. Starting from this point we estimate four models: two models for the adoption and two for the intensity of usage.
3.2.2. Explanatory variables
The aim of our estimation is to characterize the adoption and usage of ICT by a sample of Tunisian firms. The related empirical studies have looked at three factors affecting new technology adoption: rank effect (we select firm's size and firm's seniority as the main variables that explain this effect), 2) epidemic effect (we select the adoption time and the possession of a webpage), and 3) technological absorptive capacity effect (we took into account the rate of frame).
Based on the number of employees, firm size is a variable with four answer levels which measures a firm’s size. If the firm has less than 25 employees it takes the value zero. If the firm has between 25 and 50 it takes the value one. If the firm has a number of employees between 50 and 100 it takes the value two. If the firm has more than 100 it takes the value three.
A second explanatory variable is the firm seniority (firm age). This variable is continuous. It is in the form of number of years and refers to the creation date of the company.
The third explanatory variable is the rate of framing, which should corresponds to the percentage of senior executives, junior executives and technicians of the total number of employees in the firm.
Concerning the time of adoption, it represents time since first adoption of ICT tools. This variable summarizes the speed of adoption of the ICT tools. A fifth variable is the possession of a Website. This is a dummy variable which equals one if the firm had a website in 2005 and zero if it didn’t.
4. Econometric Results
This section presents the empirical results of a probit ordered and linear model of the determinants, respectively, of ICT adoption and use by Tunisian firms. These determinants are gathered according to the two different criteria quoted above. In our empirical study we distinguish between ICT adoption and use of ICT.
In our econometric analysis, we estimated the four models using the Heckman two-step method, which takes into account the problem of selection bias. The Heckman method attempts to control for the effect of non-random selection by incorporating both the observed and unobserved factors that affect non-response. We estimate the Heckman model using the maximum likelihood estimation method in STATA v. 10.0. We note that the parameter estimate on the IMR variable itself was not significant. Indeed, it suggests there wasn’t significant bias in the initial model. This means that the substantial equation is independent of the selection equation. The two decisions are thus made independently of one another. Thus we can affirm that a model of selection does not make it possible to obtain more efficient estimators in our case.
We observe that most of the explanatory variables are significant. It can be outlined that almost all variables have a statistically significant effect on the adoption and use of ICT. Our results confirm most of the theoretical expected effects. Moreover, our results confirm the expected effects stated in our hypotheses. We move to discussing each effect separately below.
Rank Effect
Firstly, we demonstrate that firms’ adoption and use of ICT is a positive function of their size. As expected, there is a positive correlation between a firm’s size and its ICT capital stock (adoption), showing the existence of scale economies for digital investment. Similar to industrial technologies, large firms have more incentives to adopt ICT, as they have the chance to spread adjustment costs over a more substantial output volume. Larger firms are more likely to adopt digital technologies because they show lower levels of financial constraints. This effect is relatively stable regardless of the type of the technology considered. At the same time, the firm’s size has a positive and significant effect on the intensity of use of ICT (intra-firm diffusion). Our results confirm the expected effects stated in hypothesis 2. The raking effect of diffusion seems validated here since we have shown that a firms’ size matters in intra-firm diffusion. This is mainly because larger companies need relatively more internal or external (wave 2 and 3) coordination tools. Concerning the firm's seniority effect, we show that ICT adoption and uses differ according to the models. Globally, the age of the company does not have a significant effect on the adoption of the second and third waves ICTs. And only more than ten-year-old firms have a significant effect. The effect of this variable in the intensity of use is more important for aged firms than for others. Within our sample and especially for companies that are older than ten years we find a significant effect. These findings show that the disequilibrium theory is validated. In fact, the correlation between the intensity of use (intra-firm innovation diffusion) and the rank variables (seniority and size) indicate that a firm’s behavior can’t be independent of its size and seniority even if expected returns of the marginal use of the technology considerations are forgotten. Our results show also that the dynamics followed by the adoption of the technology differ from the ones followed by the depth of adoption. These findings are shared by most of the new literature in the matter of ICT usage. The challenge to verify the epidemic variables seems to be more attractive in this context.
Epidemic Effect
The time adoption variable is significant to explain the adoption and the depth of adoption of ICTs. We have already defined this variable as the speed of adoption of each technology by individual firm that is the inverse of the time taken by each firm to adopt a new technology. The correlation between the two variables indicates that a propagation effect exists and confirms our first intuition that the intra-firm hypotheses are suitable to descript the adoption phenomena.
Moreover, when we look at the variable having a website we find that the correlation is significant with adoption and use of ICTs. The effect is positive which is evident. These findings show that the contagion dynamics are working and the epidemic effect could be confirmed.
Technological Absorptive Capacity Effect
When we introduce the frame rate variable we reach the same result, which is a strong correlation with the diffusion variable. Rate of frame is a proxy variable. Technology propagation is dependent on the firm’s capacity to become aware of the new technologies, in order to be able to adopt and adapt them to the local context (if any). For Tunisian SMEs, this
is more the case of firms with high frame rate. In recent studies we have mentioned several problems with regards to ICT adoption by Tunisian firms (Bellon et al., 2006 & 2007). The entrepreneurs play a crucial role in this dynamic. However, most of them were unaware about the possibilities offered by these technologies in 2003. More than 50% of them answered that these technologies are not relevant for their activities despite their general purposes. Thus, the only variable which seems to play a role in the technological absorptive capacity of these technologies is the qualification of the employees. The more qualified they are, the more important the usage becomes. Our estimation confirms this intuition and all the estimates are significant and positively correlated. The lack of information gathered by this survey hinders us from going further in understanding the real dynamics behind this relationship. We have no access to the training programs and volume for the employees that are better correlated with the usage of ICT in most of the empirical works.
5. Concluding Remarks
This paper emphasizes that the adoption and effective use of ICTs among Tunisian firms depend, firstly, on the types or “waves” of ICTs and, secondly, on different firm characteristics. In terms of penetration level, intensity of use and time required to introduce in the firm, these technologies range (in ascending order) from first generation technologies (fixed phone, fax and office computer) to intermediary technologies (internet, email, software) and, finally, more recent ICTs (videoconference, intranet and EDI).
Our work confirms the rank effect and the epidemic effect mentioned by the disequilibrium theory. Our contribution provides empirical findings for this theory and argues that time is still the main factor of innovation diffusion in LDCs. This contrasts with findings for developed countries like Italy, France and the United Kingdom.
In terms of policy implications, the above findings suggest that actions aiming to increase the use of ICTs among Tunisian firms should be based on a well-aimed policy mix. If the objective is to help firms increase their productivity, then the development of third wave ICTs should be given the priority. In this case, a key factor is the improvement of the human capital within SMEs by the government, which can be achieved by lowering, through different types of policy instruments, the hiring and training costs of educated workers, and especially university graduates. Building an absorptive capacity for ICTs needs to precede the enabling of efficient use.
The nature of the present study is mainly descriptive. Further work is necessary to investigate how the investment in different types of ICTs impacts the organizational practices and improves, for instance, the performance of Tunisian firms.
References
Acemoglu, D. & F. Newman, F., A. 2002. “The Labor Market and Corporate Structure”.
European Economic Review. Elsevier Vol. 46(10):1733– N. 56.
Antonelli, C. 1985. “The Diffusion of an Organizational Innovation”. International Journal
of Industrial Organisation. Vol. 3, N. 109–118.
Antonelli, C. 1999. “The Micro Dynamics of Technological Change”. London: Routledge. Antonelli, C. 2003. “The Economics of Innovation, New Technologies and Structural
Change, London, Routledge.
Arvanitis, S. & H. Hollenstein. 2001. “The Determinants of the Adoption of Advanced Manufacturing Technology”. Economics of Innovation and New Technology. Vol. 10, N. 377–714.
Astebro T. B. 2004. “Sunk Costs and the Depth and Probability of Technology Adoption”.
Journal of Industrial Economics. Vol. 52, N. 381–399.
Battisti, G. 2008. “Innovations and the Economics of New Technology Spreading Within and Across Users: Gaps and Way Forward”. Journal of Cleaner Production. Vol. 16S1, N. S22–S31.
Battisti, G., Canepa A. & P. Stoneman. 2009. “E-Business Usage Across and Within Firms in the UK: Profitability, Externalities and Policy”. Research Policy. Vol. 38, N. 133–143.
Battisti, G. & P. Stoneman. 2003. “Inter and Intra-Firm Effects in the Diffusion of New Process Technology”. Research Policy. Vol. 32, N. 1641–1655.
Battisti, G. & P. Stoneman. 2005. “The Intra-Firm Diffusion of New Process Technology”.
International Journal of Industrial Organization. Vol. 23, N. 1–22.
Bellon, B., Ben Youssef, A. and H. M’henni. 2007. “Usage Capacities of ICTs In Emerging Economies”. Revue Tiers Monde. Vol. 192, N. 919–936 (in French).
Bellon, B., Ben Youssef, A. and H. M’henni. 2006. “The Missing Link between Adoption and Usage of ICT in the South Mediterranean Countries”. Revue Française de Gestion Vol. 166 –2006/7, N. 173–190 (in French).
Bocquet R. & O. Brossard. 2007. “The Variety of ICT Adopters in the Intra-Firm Diffusion Process: Theoretical Arguments and Empirical Evidence”. Structural Change and
Economic Dynamics. Vol. 18, N. 409–437.
Bresnahan, T., Brynjolfsson, E. & L. Hitt. 2002. “Information Technology, Workplace Organization and the Demand for Skilled Labor: Firm-Level Evidence”. The Quarterly
Journal of Economics. Vol. 117(1): N. 339–376.
Bresnahan, T. & M. Trajtenberg. 1995. “General Purpose Technologies: Engines of Growth?”. Journal of Econometrics. Vol. 65(1): N. 83–108.
Fabiani, S., Schivardi, F. & S. Trento. 2005. “ICT Adoption in Italian Manufacturing: Firm Level Evidence”, Industrial and Corporate Change, 14(2), pp. 225E249.
Forman, C. 2005. “The Corporate Digital Divide: Determinants of Internet Adoption”.
Management Science. Vol. 51(4): N. 641–654.
Gale F. H. 1997. “Is There A Rural-Urban Technology Gap? Results of the ERS Rural Manufacturing Survey”. Agriculture Information Bulletin No. 736-01. United States Department of Agriculture.
Galliano, D. and Pascale Roux. 2006. "Les inégalités spatiales dans l'usage des tic. Le cas des firmes industrielles françaises". Revue économique. Presses de Sciences-Po. vol. 57(6), pages 1449-1475.
Geroski, P.A. 2000. “Models of Technology Diffusion”. Research Policy. Vol. 29, N. 603– 626.
Greenan N. and Mairesse J. 2004. “A Firm Level Investigation of the Complementarity
between Information and Communication Technologies and New Organizational Practices”. Mimeo Centre d’Etudes et de l’Emploi (Center for Studies and Employment). June.
Greene, W.H. 2000. “Econometric Analysis”. Fourth Edition. New Jersey: Prentice International Hall Edition.
Helpman, E. 1998. “General Purpose Technologies and Economic Growth”. Cambridge: MIT Press.
Hollenstein, H. 2004. “The Determinants of the Adoption of Information and Communication Technologies (ICT). An Empirical Analysis Based on Firm-Level Data for the Swiss Business Sector”. Structural Change and Economic Dynamics. Vol. 15, N. 315–342.
Ichniowski, C., K. Shaw & G. Prennushi. 1997. “The Effects of Human Resource Management Practices on Productivity: A Study of Steel Finishing Lines”. American
Economic Review. Vol. 87(3): N. 291– 313.
Lal, K. 1999. “Determinants of the Adoption of Information Technology: A Case Study of Electrical and Electronic Goods Manufacturing Firms in India”. Research Policy. Vol. 28, N. 667–680.
Levin, A. & C. F. Linn. 1992. “Unit Root Tests in Panel Data: Asymptotic and Finite Sample Properties”. Discussion paper No. 92 –93. San Diego: University of California.
Lucchetti R. & A. Sterlacchini. 2004. “The Adoption of ICT among SMEs: Evidence from an Italian Survey”. Small Business Economics, Springer. Vol. 23(2): N. 151–168.
Maddala G. & A. Flores-Lagaunes. 2001. “Qualitative Response Models”. In “A Companion
to Theoretical Econometrics”, ed. B. Baltagi. Oxford: Blackwell.
Mansfield E. 1963. “The Speed of Response of Firms to New Techniques”. Quarterly
Mitchell S. & D. Clark. 1999. “Business Adoption of Information and Communication Technologies in the Two-Tier Rural Economy: Some Evidence from the South Midlands”. Journal of Rural Studies. Vol. 15, N. 447–455.
Morgan, A., Colebourne, D. & B. Thomas. 2006. “The Development of ICT Advisors for SME Business: An Innovative Approach”. Technovation. Vol. 26(8): N. 980–987.
Nelson, R. & E. Phelps. 1966. “Investment in Humans, Technological Diffusion and Economic Growth”. American Economic Review. Vol. 56(1/2): N. 65 –75.
OECD. 2004. “The Economic Impact of ICT, Measurement, Evidence and Implications”. Paris: OECD.
Stoneman P. & G. Battisti. 1997. “Intra-Firm Diffusion of New Technologies: The Neglected Part of Technology Transfer”. International Journal of Industrial Engineering 4 (2): 270–282.
Thomas, A. 2000. “Econometric of the Qualitative Variables”. Paris: Dunod.
Thong, J.Y.L. 1999. “An Integrated Model of Information Systems Adoption in Small Business”. Journal of Management Information Systems. Vol. 4(15): N. 187–214.
Table 1: Sample Distribution by Firm Size and Industry Industry Size Clothing & Footwear Chemicals and Plastic Products Mechanical & Electrical Equipment Food & Beverages Total 5 to 24 6.45 32.35 35.90 10.00 18.86 25 to 49 16.13 41.18 30.77 7.50 22.29 50 to 99 33.87 17.65 15.38 17.50 22.86 More than 100 43.55 8.82 17.95 65.00 36.00 Total 35.43 19.43 22.29 22.86 100
Table2: Penetration Level, Intensity of Use and Time Required for a First Use of an ICT
Penetration Level Intensity of Use Time Required to Use an ICT
Videoconference 11.5 1.27 8.76 EDI 14.2 1.55 5.67 Intranet 18.2 1.72 5.34 Laptops 36.5 2.18 4.34 Email 67.6 3.18 4.20 Internet 70.9 3.22 4.89 Mobile Phone 79.1 3.78 5.84 Specific Software 58.1 3.12 7.88 Free Software 70.3 3.39 7.05 General Purpose Software 90.5 4.39 6.10 Office Computers 95.3 4.49 5.43
Fax 96.6 4.76 2.87
Appendix 1
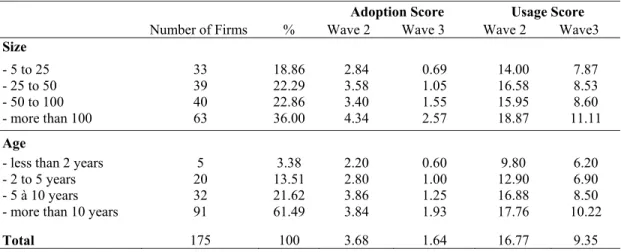
Table 4: ICT Adoption and Usage Depending on Firms’ Size and Age
Adoption Score Usage Score Number of Firms % Wave 2 Wave 3 Wave 2 Wave3 Size - 5 to 25 33 18.86 2.84 0.69 14.00 7.87 - 25 to 50 39 22.29 3.58 1.05 16.58 8.53 - 50 to 100 40 22.86 3.40 1.55 15.95 8.60 - more than 100 63 36.00 4.34 2.57 18.87 11.11 Age
- less than 2 years 5 3.38 2.20 0.60 9.80 6.20 - 2 to 5 years 20 13.51 2.80 1.00 12.90 6.90 - 5 à 10 years 32 21.62 3.86 1.25 16.88 8.50 - more than 10 years 91 61.49 3.84 1.93 17.76 10.22