HAL Id: hal-01458854
https://hal-amu.archives-ouvertes.fr/hal-01458854
Submitted on 12 Apr 2021HAL is a multi-disciplinary open access archive for the deposit and dissemination of sci-entific research documents, whether they are pub-lished or not. The documents may come from teaching and research institutions in France or abroad, or from public or private research centers.
L’archive ouverte pluridisciplinaire HAL, est destinée au dépôt et à la diffusion de documents scientifiques de niveau recherche, publiés ou non, émanant des établissements d’enseignement et de recherche français ou étrangers, des laboratoires publics ou privés.
Controls on Holocene denudation rates in mountainous
environments under Mediterranean climate
Stéphane Molliex, G. Jouet, N. Freslon, D.L. Bourles, Christine Authemayou,
J. Moreau, Marina Rabineau
To cite this version:
Stéphane Molliex, G. Jouet, N. Freslon, D.L. Bourles, Christine Authemayou, et al.. Controls on Holocene denudation rates in mountainous environments under Mediterranean climate. Earth Surface Processes and Landforms, Wiley, 2016, 42 (2), pp.272-289. �10.1002/esp.3987�. �hal-01458854�
1
Please note that this is an author-produced PDF of an article accepted for publication following peer review. The definitive publisher-authenticated version is available on the publisher Web site.
Earth Surface Processes And Landforms
February 2017, Volume 42 Issue 2 Pages 272-289 http://dx.doi.org/10.1002/esp.3987
http://archimer.ifremer.fr/doc/00380/49082/ © 2016 John Wiley & Sons, Ltd.
Achimer
http://archimer.ifremer.fr
Controls on Holocene denudation rates in mountainous
environments under Mediterranean climate
Molliex S. 1, 2, * , Jouet Gwenael 1, Freslon Nicolas 1, 3, Bourles D. L. 3, Authemayou C. 2, Moreau Julien 1,
3
, Rabineau Marina 2
1
IFREMER, Dept Geosci Marines, F-29280 Plouzane, France.
2
Univ Bretagne Occidentale, Inst Univ Europeen Mer, UMR CNRS 6538, Lab Domaines Ocean, F-29280 Plouzane, France.
3
Aix Marseille Univ, Coll France, CNRS, CEREGE,UM34,IRD, BP80, F-13545 Aix En Provence 4, France.
* Corresponding author : S. Molliex, email address : smolliex@gmail.com
Abstract :
The Mediterranean domain is characterized by a specific climate resulting from the close interplay between atmospheric and marine processes and strongly differentiated regional topographies. Corsica Island, a mountainous area located in the western part of the Mediterranean Sea is particularly suitable to quantify regional denudation rates in the framework of a source-to-sink approach. Indeed, fluvial sedimentation in East-Corsica margin is almost exclusively limited to its alluvial plain and offshore domain and its basement is mainly constituted of quartz-rich crystalline rocks allowing cosmogenic nuclide Be-10 measurements. In this paper, Holocene denudation rates of catchments from the eastern part of the island of Corsica are quantified relying on in situ produced Be-10 concentrations in stream sediments and interpreted in an approach including quantitative geomorphology, rock strength measurement (with a Schmidt Hammer) and vegetation cover distribution. Calculated denudation rates range from 15 to 95 mm ka(-1). When compared with rates from similar geomorphic domains experiencing a different climate setting, such as the foreland of the northern European Alps, they appear quite low and temporally stable. At the first order, they better correlate with rock strength and vegetation cover than with morphometric indexes. Spatial distribution of the vegetation is controlled by morpho-climatic parameters including sun exposure and the direction of the main wet wind, so-called Libecciu'. This distribution, as well as the basement rock strength seems to play a significant role in the denudation distribution. We thus suggest that the landscape reached a geomorphic steady-state due to the specific Mediterranean climate and that Holocene denudation rates are mainly sustained by weathering processes, through the amount of regolith formation, rather than being transport-limited. Al/K measurements used as a proxy to infer present-day catchment-wide chemical weathering patterns might support this assumption.
Keywords : Be-10-derived denudation rates, Schmidt Hammer, Quaternary, quantitative geomorphology, weathering
2
stream sediments and interpreted in a approach including quantitative geomorphology, rock 30
strength measurement (with a Schmidt Hammer) and vegetation cover distribution. 31
Calculated denudation rates range from 15 to 95 mm ka-1. When compared with rates from 32
similar geomorphic domains experiencing a different climate setting, such as the foreland of 33
the northern European Alps, they appear quite low and temporally stable. At the first order, 34
they better correlate with rock strength and vegetation cover than with morphometric 35
indexes. Spatial distribution of the vegetation is controlled by morpho-climatic parameters 36
including sun exposure and the direction of the main wet wind, so-called “Libecciu”. This 37
distribution, as well as the basement rock strength seems to play a significant role in the 38
denudation distribution. We thus suggest that the landscape reached a geomorphic steady-39
state due to the specific Mediterranean climate and that Holocene denudation rates are 40
mainly sustained by weathering processes, through the amount of regolith formation, rather 41
than being transport-limited. Al/K measurements used as a proxy to infer present-day 42
catchment-wide chemical weathering patterns might support this assumption. 43
Introduction 44
Relief is the result of the interactions between denudation and sedimentation that are 45
mainly controlled by tectonic forces and climate changes (e.g., Davies et al., 1977; Molnar 46
and England, 1990; Allen, 1997; Willett et al., 2006; Whipple, 2009). The buildup of 47
topography by tectonics causes river channels and hill slopes to steepen, increasing relief 48
and, as a result, enhancing denudation rates and sediment flux (e.g., Willett, 1999; 49
Montgomery and Brandon, 2002). Moreover, rock fracturing induced by deformation 50
increases the likelihood of erosional transport (Molnar et al., 2007). On the other hand, a 51
change in climatic parameters will directly impact denudation efficiency and rates (e.g., 52
Whipple et al., 1999; Bonnet and Crave, 2003). Recent studies, both onshore and offshore, 53
also highlighted the role played by glaciation in the destabilization and denudation of 54
mountainous environments during the Quaternary (Hinderer, 2001; Norton et al., 2010; Jorry 55
et al., 2011;Glotzbach et al., 2013). 56
Millennial to present-day denudation rate estimates in recent orogens correlate with 57
environmental and/or geomorphic metrics such as local relief, slope gradient, channel 58
steepness, mean annual precipitations, and percentage of glacier cover (e.g., Summerfield 59
and Hulton, 1994; Brandon et al., 1998; Montgomery and Brandon, 2002; DiBiase et al., 60
2010; Bermudez et al., 2013; Glotzbach et al., 2013). For long-term scales, relief evolves 61
independently of denudation processes toward steady-state equilibrium between denudation 62
rates and isostatic rock uplift (e.g., Willett and Brandon, 2002). On continental margins, long-63
term sediment fluxes directly depend on the water discharge and hydrology of the 64
3
contributing rivers (Litty et al., 2016), the latter being controlled by climate and drainage 65
basin characteristics (catchment morphology, soil and vegetation developments, bedrock 66
type) (Syvitski and Morehead; 1999). 67
Recently, numerous studies used 10Be-derived catchment-wide denudation rates to 68
quantify feedbacks between tectonics, climate, denudation, and the resulting catchment 69
morphometry in various different settings (e.g., Riebe et al., 2000; Matmon et al., 2003; 70
Wittmann et al., 2007; Ouimet et al., 2009; Palumbo et al., 2009; DiBiase et al., 2010, 2012; 71
Delunel et al., 2010; Henck et al., 2011; Roller et al., 2012; Savi et al., 2014). Denudation 72
rates in mountainous settings have been shown to often be partly correlated to geomorphic 73
metrics, relief and slope in particular (e.g. compilation in Montgomery and Brandon, 2002; 74
Portenga and Bierman, 2011; Willenbring et al., 2013), but some studies highlight the 75
importance of rock strength (Clapp et al., 2001; Morel et al., 2003; Palumbo et al., 2009) 76
and/or bedding orientation (Chittenden et al., 2014; Cruz Nunes et al., 2015), vegetation 77
cover (Roller et al., 2012; Torres Acosta et al., 2015), precipitation and discharge 78
(Bookhagen and Strecker, 2012), and uplift rates (Wittmann et al., 2007; Baran et al., 2014; 79
Godard et al., 2014). 80
The Mediterranean climate is determined by a close interplay between atmospheric 81
and marine processes and strongly differentiated regional topographies (Xoplaki et al., 2004 ; 82
Kulhemann et al., 2008). This leads to a specific subtropical climate with strong seasonal 83
variability, relatively warm temperatures and highly fluctuating precipitations. Very few 84
studies focused on catchment-wide denudation in such Mediterranean climate environment, 85
despite that the encountered specific climatic conditions are able to efficiently model 86
landscapes and create some impressive erosional features within granites such as "tafoni" 87
(Brandmeier et al., 2011). 88
In this study, we investigate the denudation rates of the mountainous island of 89
Corsica in the Mediterranean Sea, particularly focusing on catchments draining the 90
northeastern part of the continental margin (the Golo River and surrounding watersheds). 91
Holocene denudation rates are deduced from in-situ produced cosmogenic 10Be 92
concentration measurements from stream sediments. They are then compared to rock 93
strength and environmental and geomorphic metrics derived from digital elevation models 94
(DEM). Then, forcing parameters such as morphology, climate, uplift, rock strength, 95
vegetation patterns, and catchment area are discussed. 96
1- Geological setting: 97
4
Northeastern Corsica is characterized by a steep mountainous morphology, with 98
elevations reaching more than 2,700 m (Fig. 1). It is composed of two main structural units 99
(Fig. 1): (i) the Hercynian unit, an underlying magmatic basement related to the late 100
Paleozoic Hercynian Orogeny, constitutes the highest part of the island (up to 2704 m in 101
Monte Cinto); (ii) the Alpine unit, an overthrusted nappe-unit built from Mesozoic oceanic 102
crust and sedimentary series emplaced and metamorphosed during the so-called “Pyrenean” 103
compression lasting from the Late Cretaceous to the Eocene (Mattauer et al., 1981; Gibbons 104
and Horak, 1984; Harris, 1985; Fellin et al., 2006; Danisik et al., 2007). This Alpine unit was 105
exhumed during an early to middle Miocene (Cavazza et al., 2001; Zarki-Jakni et al., 2004) 106
regional extension, which occurred due to the Ligurian sea opening which itself was related 107
to the extension in the back-arc area of the Apennines orogen (e.g., Jolivet et al., 1998). 108
This caused the drifting of the Corsica-Sardinia block from the European continent of 109
southern France to its current location (e.g. Réhault et al., 1984; Mauffret and Gorini, 1996; 110
Roca et al., 1999; Gattacceca et al., 2007) and reactivated the contact between the 111
Hercynian and Alpine units as a normal shear zone (Jolivet et al., 1991; Daniel et al., 1996; 112
Brunet et al., 2000). Shallow water sediments were then deposited above the Alpine units in 113
small Miocene basins (Orszag-Sperber and Pilot, 1976) during the early-middle Miocene 114
(Ferrandini et al., 1998; Cubells et al., 1994). In the late Miocene–Pliocene, crustal extension 115
in the proto-Tyrrhenian Sea resulted in the subsidence and deposition of continental and 116
shallow marine deposits up to 2 km-thick in numerous half-grabens (onshore and offshore), 117
as in the Aleria basin (Fournier et al., 1991; Loÿe-Pilot et al., 2004). Since the late Miocene, 118
no major tectonic events have affected Corsica. However, transpressive faulting within the 119
late Miocene to Quaternary units suggest that far-field compressional stresses still affect 120
northeastern Corsica to the present-day (Fellin et al., 2005a; Serrano et al., 2013). 121
The evolution of paleo-surfaces exposed at high altitudes in Corsica has been 122
investigated using apatite fission-track and cosmogenic nuclide methods (Kuhlemann et al., 123
2007; 2009). These studies suggest that the central and northernmost parts of Corsica have 124
experienced continuous exhumation since the Miocene, with high denudation rates in the 125
order of 1000–1500 mm.ka-1 in the early-middle Miocene decreasing to less than 200 mm.ka
-126
1 from the late Miocene to the present-day (Fellin et al. 2005a; Kuhlemann et al., 2007;
127
2009). This leads to the local preservation of old (Paleocene-Eocene) remnant planation 128
surfaces (Kuhlemann et al., 2005a; Danisik et al., 2012). Quaternary uplift rates were 129
investigated using elevated marine terraces and stair-cased alluvial terrace geometry 130
(Conchon, 1978; 1999; Collina-Girard, 1999; Fellin et al., 2005b; Kuhlemann et al., 2005b). 131
These rates range between 50 mm.ka-1 along the southwestern coast, 150-300 mm.ka-1 on 132
the northwestern coast and 200-400 mm.ka-1 in the northeastern part. However, large 133
5
uncertainties are associated to these rates due to the fact that some terraces used in these 134
studies are not well dated and accurate corresponding sea-levels are difficult to estimate. 135
Moreover, recent uplift rates are also expected to vary significantly between different tectonic 136
regimes across the island (Lenôtre et al., 1996). Nevertheless, while recent deformation is 137
well-documented near coastal domains and eastern alluvial plains (e.g. Serrano et al., 2013), 138
the lack of significant seismicity, as well as the lack of recent deformation evidence in 139
upstream areas, leads us to consider Corsica to be a tectonically stable domain. 140
With a catchment area of 1,214 km2 and a length of 89 km, the Golo River is the largest river 141
in Corsica (Fig. 1). It passes through the Alpine and Hercynian domains. Its average gradient 142
is 30 m/km. Preservation of fluvial terraces is low due to the very steep and confined nature 143
of the valleys. Despite the relatively steep slopes, there is no evidence of recent landslides, 144
as the colluvial fans are covered by dense vegetation (Sømme et al., 2011). Its main 145
tributaries are the Asco (34.1 km; 165 km²), Tartagine (30.2 km; 136 km²), Casaluna (25.3 146
km; 100 km²), and Lagani rivers (22.1 km; 47 km²) (Fig.1). Downstream, the Golo alluvial 147
plain (Marana plain; Fig.1) is only 11 km wide. Deposits on this plain are mainly constituted 148
by pebbles in a sandy matrix and are not exclusively provided by the Golo catchment, but 149
also by two coastal catchments draining only the Alpine domain, the Bevinco to the north and 150
Fium Alto to the south (Fig.1). Corsica is experiencing a subtropical Mediterranean climate 151
with strong seasonal variability. The mean annual temperatures are relatively warm (15.9°C 152
on the Marana plain), and the precipitations are highly spatially variable, ranging from 700 153
mm.yr-1 on the Marana plain to 1300-1400 mm.yr-1 in the highest parts of the Golo catchment 154
(Kuhlemann et al., 2007; Sømme et al., 2011). Strong seasonal variations in precipitation 155
result in high flood discharge from the Golo River, with an average discharge of 20.4 m3.s-1 156
and a flood peak reaching up to 734 m3.s-1 (HYDRO French Database, 157
www.hydro.eaufrance.fr). Vegetation is dominated by evergreen bushes and trees in the 158
lowlands with increasing amounts of deciduous and pine forest at higher elevations (Reille et 159
al., 1997; 1999). There is no recent glacier permanent ice in the studied area (Wilhelm, 160
1975), but the uppermost part of the Golo watershed was glaciated during the Last Glacial 161
Maximum (LGM) and subsequent glacial phases (Klaer, 1956; Kuhlemann et al., 2008; 162
Krumrei, 2009). 163
2- Material and methods 164
2-1) Morphometric parameters calculations 165
For each catchment, morphometric parameters including mean elevation, mean 166
slope, shape factor, sinuosity, hypsometric integral, local relief, and the normalized 167
6
steepness index (Ksn) (Tab. 1), were computed from a 25 m-resolution DEM provided by the 168
French Geographical Institut (IGN). 169
Mean elevation and mean slope were computed by calculating the average value of 170
each pixel of the DEM and slope map (derivative DEM), respectively. The shape factor 171
corresponds to the ratio between maximum width and perpendicular maximum length of the 172
catchment. The sinuosity is the ratio between the straight distance from the source to the 173
outlet and the same distance along the stream. 174
The hypsometric integral (Hi) is a non-dimensional parameter representing, after 175
normalization, the repartition of the drainage area as a function of the elevation of the main 176
catchment stream (Strahler, 1952). The shape of the hypsometric curve as well as the value 177
of Hi express the volume of a basin that has not yet been eroded and thus aim to 178
quantitatively express the evolution of a catchment (Strahler, 1952). A convex hypsometric 179
curve with a high integral value (> 0.6) characterizes a weakly eroded catchment, while a 180
concave hypsometric curve with a low integral value (< 0.4) characterizes a strongly eroded 181
catchment. This parameter is highly dependent on the erodibility of the rocks (Hurtrez and 182
Lucazeau, 1999) and on the size of the catchment (Hurtrez et al., 1999; Walcott and 183
Summerfield, 2008). 184
The local relief is defined as the difference in elevation between the interfluve and the 185
lowest point in the erosive channel (Ahnert, 1984). It therefore characterizes the incision, the 186
relief is high if incision is strong (e.g. ; Champagnac et al., 2014). The geophysical relief is 187
another more convenient parameter, calculated as the difference between a smooth surface 188
connecting the highest points in the current landscape and the current topography (Small 189
and Anderson, 1998; Brocklehurst and Whipple, 2002). This smooth surface was created by 190
computed a flow accumulation grid from an inverse DEM. Indeed, the high values of flow 191
accumulation computed from an inverse DEM correspond to the main interfluves and 192
highpoints. The value of geophysical relief obtained by this method highly depends on the 193
“tension” of the smooth surface, i.e. the number of the high points chosen (Ahnert, 1984; 194
Lucazeau and Hurtrez, 1997; Champagnac et al., 2012). For our calculation, we created two 195
smooth surfaces with different “tension” using two border values for flow accumulation (over 196
1000 cells and over 2000 cells) that correspond to the range of representative values. 197
A hydrographic network has a particular relationship between its slope and its 198
drainage area (Hack, 1957; Flint, 1974; Howard and Kerby, 1983), which can be written as 199
the slope-drainage area relationship: 200
S = ks.A-θ 201
7
where S is the slope, A is the drainage area, and ks and θ are the steepness and the 202
concavity of the studied stream, respectively. The concavity θ depends on erosional 203
processes and can be related to orographic rain (Schlunegger et al., 2011) and denudation 204
rates (Vanacker et al., 2015), whereas the steepness index ks depends on erodability and 205
rock uplift. (Howard et al., 1994; Willgose, 1994;Whipple and Tucker, 1999). Since these two 206
parameters are independent, it is possible to normalize ks using the same reference 207
concavity for all watersheds (Snyder et al., 2000; Whipple, 2004; Duvall et al., 2004). This 208
new parameter (ksn) is often used to account for rock uplift in geomorphological studies (e.g. 209
Wobus et al., 2006; Kirby and Whipple, 2012). In this study, using a reference concavity of 210
0.5, we calculated ksn for each 1 km-long stream section in the studied area as well as a 211
weighted average ksn for each catchment. 212
To compute the vegetation cover pattern, we used the “Corine Land Cover” European 213
program database (French data downloadable on
http://www.statistiques.developpement-214
durable.gouv.fr/donnees-ligne/li/1825.html).
215
2-2) In-situ produced 10Be concentrations and estimations of millennial-scale 216
denudation rates 217
Rocks exposed to cosmic rays accumulate cosmogenic nuclides whose 218
concentrations depend on their production rates (P), their half-lives, and the denudation rates 219
(e.g. Gosse and Philips, 2001; Dunai, 2010). With long enough exposure to cosmic ray 220
derived particles, cosmogenic nuclide concentrations reach a steady-state equilibrium at 221
which cosmogenic nuclide gain due to production equals losses due to denudation and 222
radioactive decay (e.g. von Blanckenburg, 2005). At the catchment area scale (A), gain due 223
to production is (P x A), while losses can be estimated by the mean concentration within river 224
sediment grains at the outlet (C) multiplied by the sediment flux (F). The concentration of a 225
particular cosmogenic nuclide (10Be) measured in sediments sampled from river outlets 226
enables us to estimate the sediment flux (and therefore the denudation rate) at the 227
catchment scale, assuming constant erosion in the catchment (Brown et al., 1995; Bierman 228
and Steig, 1996; Granger et al., 1996). The integration time scale is equal to the absorption 229
depth scale (~60 cm in silicate rock; Lal, 1991) divided by the denudation rate. It often 230
corresponds to the last hundreds or thousands of years, depending on the denudation rate. 231
Sixteen samples from active riverbed sands were collected during fieldwork in 2012 at 232
the outlet of sub-catchments from the Golo watershed and surrounding areas in order to 233
determine their mean denudation rate from their in-situ produced 10Be concentrations (Fig. 3; 234
Tab. 2). The physico-chemical preparation of the samples and the AMS measurements of 235
their 10Be concentrations were carried out at the Laboratoire National des Nucléides 236
8
Cosmogéniques (LN2C) in the Centre Européen de Recherche et d’Enseignement des 237
Géosciences de l’Environnement (CEREGE), in Aix-en-Provence. Samples were prepared 238
for 10Be isotopic measurements following chemical procedures modified from Brown et al. 239
(1991), Kohl and Nishiizumi (1992), and Merchel and Herpers (1999). For all samples, sands 240
were sieved to isolate the 250-1000 µm fraction. The magnetic fraction was removed with a 241
magnetic separator (Frantz-type), and pure quartz was obtained by at least 3 repeated ~ 242
10% H2SiF6–HCl etchings and 3 repeated ~ 3% HNO3-HF etchings. Atmospheric 10Be was
243
subsequently eliminated by 3 sequential dissolutions with diluted HF. Approximately 300 µg 244
of an in-house 9Be carrier solution, prepared from deep-mined phenakite (Merchel et al., 245
2008), was added to each sample, and residual grains were dissolved in a strong HF 246
solution. After the obtained solutions were evaporated to dryness and the residues were 247
dissolved in hydrochloric acid, Be was separated by anion and cation exchange columns. 248
After the solution volumes were reduced by heating, the Be hydroxides precipitated using 249
NH3aq were dried and finally ignited at 900°C to BeO. BeO targets were prepared for
250
measurement at the French National Accelerator Mass Spectrometry facility (ASTER), in 251
CEREGE, Aix-en-Provence. The obtained 10Be/9Be ratios were corrected for procedural 252
blanks and calibrated against the National Institute of Standards and Technology standard 253
reference material 4325 by using an assigned value of 2.79±0.03×10⁻¹¹ and a 10Be half-life of 254
1.387±0.012×10⁶ years (Korschinek et al., 2010; Chmeleff et al., 2010). Analytical 255
uncertainties (reported as 1σ) include uncertainties associated with AMS counting statistics, 256
chemical blank measurements, and AMS internal error (0.5%). Long-term AMS 257
measurements of procedural blanks yield a background ratio of 3.0±1.5×10⁻¹⁵ for 10Be/9Be 258
(Arnold et al., 2010). A sea-level high-latitude (SLHL) spallation production of 4.03 ± 0.18 at 259
g–1 yr–1 (weighted mean of the most recently calibrated production rates in the Northern 260
Hemisphere; see Molliex et al., (2013) for references) was used and scaled for latitude 261
(Stone, 2000) and elevation. The production rate is calculated for each cell of the DEM 262
constituting the catchment, and the mean catchment production rate value is calculated by 263
averaging the values of quartz-producing rock areas following the method described by 264
Delunel et al., (2010) and using Balco’s (2001) script to calculate the shielding factor. The 265
contribution of muons to the production rate was calculated using the physical parameters 266
evaluated by Braucher et al. (2011). 267
The presence of glaciers in some catchments during the integration time violates the 268
steady state assumption inherent in this method, which aims to determine a catchment-wide 269
denudation rate using in-situ produced 10Be (Brown et al., 1995; Bierman and Steig, 1996; 270
Granger et al., 1996), and may lead to an overestimation of the denudation rates (Gosse and 271
Philips, 2001; Vance et al., 2003; Portenga et al., 2015). Regarding the samples we 272
9
analyzed, the integration times may cover different glacial periods: LGM from 23 to 19 ka 273
(Mix et al., 2001); Older Dryas (OD) from 17 to 14.7 ka (Severinghaus et al., 1998; Stanford 274
et al., 2006), and Younger Dryas (YD) from 12.9 to 12.1 ka (Cacho et al., 2002). We 275
therefore used a map of glacier coverage, produced by Krumrei (2009), for each climatic 276
period to determine the part of the studied catchments’ surface affected by the presence of 277
glaciers. 278
Among the selected catchments, there are sub-catchments nested in “parent” basins. 279
In order to avoid biases in statistical analysis because of possible dependency between 280
parent and nested catchments, effective denudation rates for the non-nested portion outside 281
of the nested sub-catchment were computed following the methods of Granger et al., (1996) 282
and Portenga et al., (2015): 283
The sediment flux being defined as: 284
285
2-3) Quantification of rock strength by Schmidt Hammer in-situ measurements 286
Variations in rock competence play an important role in determining bedrock incision 287
and denudation rates (e.g. Hack, 1957; Stock and Montgomery, 1999; Whipple et al., 2000; 288
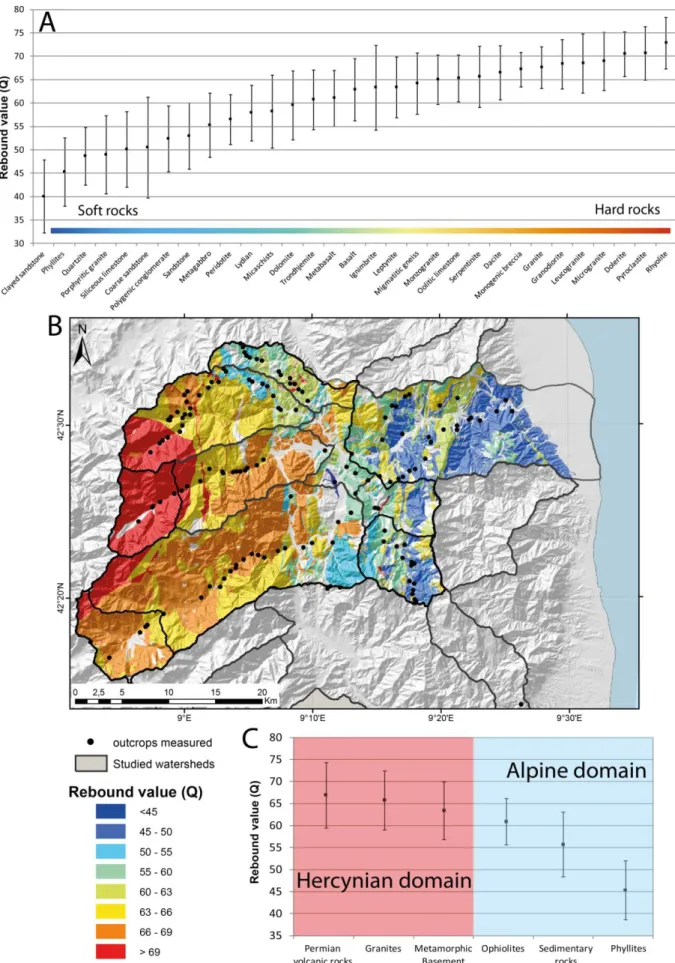
Sklar and Dietrich, 2001; Duvall et al., 2004). The rebound values (Q) given by Schmidt 289
Hammer measurements are more widely used to quantify rock competence in 290
geomorphologic studies (e.g. Duvall et al., 2004; Goudie, 2006; Engel et al., 2014). The Q 291
value appears at a first order to be a good indicator of the resistance of rocks to erosion and 292
is now extensively used in geomorphic studies, even if some other factors, however difficult 293
to infer at this scale, such as fracturing density or chemical composition, enhance erodability. 294
The details of the operational aspects of the Schmidt Hammer method can be found in Basu 295
and Aydin (2004) and Aydin and Basu, (2005). In order to assess variations in bedrock 296
competence, 143 fresh outcrops in 31 different lithologic units in the Golo catchment were 297
used to measure rock strength and define a mean and mode rebound value (Q) for each type 298
of rock. For each site, 15 individual measurements on non-fractured and non-weathered rock 299
surfaces were collected, omitting any test that yielded a hollow sounding impact, that 300
fractured the rock, or that yielded a rebound value (Q) < 30 since the minimum instrument 301
reading is 30. Unconsolidated rocks such as marls or alluvial deposits were thus not tested, 302
10
but these rocks only represent less than 5% of the total Golo drainage area. A mean value 303
was then applied to each lithologic unit in order to create a map of the rock strength of the 304
Golo catchment. This map was used to estimate the catchment-averaged rebound value by 305
computing the weighted mean of each lithologic unit relative to its extension in the 306
catchment. 307
2-4) Inferring wheathering intensity from Al/K concentration 308
The chemical erosion of silicates (i.e. weathering) is defined by the alteration of K-309
feldspath to kaolinite. The clay mineralogy of a sediment can be inferred from the analysis of 310
two major elements (Al and K) which characterize the weathering degree of clays. A high 311
Al/K ratio reflects a high abundance of kaolinite and thus a high weathering degree (e.g. 312
Schneider et al., 1997). Measurements of the Al/K ratio were performed on the <45 μm 313
fraction of 26 river sediment samples. Corsican riverbed sediments are typically 314
characterized by coarse grains and contain very little clay material due to the rapid transport 315
of fine particles. Thus, the clay samples collected for Al/K measurements are from small 316
natural dams where fine particle sedimentation can occur. At each sampling site, a large 317
amount of sediment was sieved using one liter of river water and then only the 0-125 μm 318
fraction was transferred to a pre-cleaned polypropylene bottle. Water was then discarded by 319
centrifugation at the laboratory and the sediment was sieved at 45 μm. The 125-45 μm 320
fraction was discarded and the fine fraction (< 45μm) was dried for 12 hours at 90°C and 321
crushed before analysis. The inorganic geochemical composition (Si, Al, Fe, Mn, Ca, Mg, K, 322
Na, Ti, P, S) of the fine sediment was determined on fusion beads by WD-XRF (Wave 323
Dispersion X-Ray Fluorescence, S8 Tiger, Bruker®) analysis according to the procedure 324
derived from Maghraoui et al. (1999). Calibration curves were established using a set of 325
internal and international reference materials. The relative uncertainty obtained is lower than 326 1%. 327 3- Results 328 3-1) Geomorphologic study 329
All computed parameters are compiled in Fig. 2 and Tab. 1. The Hercynian domain, in 330
the upstream part of the studied catchments, shows a higher mean slope (~ 25 %) than the 331
Alpine one (~ 20 %). Moreover, the morphology is clearly much steeper in the Hercynian 332
domain (mean residual relief: ~ 280 m) than in the Alpine domain (mean residual relief: ~ 333
175 m). The limit between the Hercynian and the Alpine domains regarding slopes and the 334
normalized steepness index values (Ksn) for each 1 km-long stream portion is well marked 335
(Fig. 2A). Upstream, the Golo and Tavignano are both glacial U-shaped valleys with steep 336
11
flanks and flat bottoms (Fig. 2A). Ksn values vary from a factor of 1 to 10 in the Golo, Asco, 337
and Tavignano rivers, indicating that some parts (with higher values) of the hydrographic 338
network present anomalous slopes. These anomalies are located just downstream of the 339
lowest glacial-shaped features suggesting a glacial imprint on the present-day morphology. A 340
change in rock competence between the Alpine and Hercynian domains can also partly 341
account for such Ksn differences. Only small anomalies can be seen in the Alpine domain. 342
They may be explained by local lithologic contacts, for instance near the transition between 343
ophilites and phyllites as seen by comparing Fig. 1B and Fig. 2A. The same kind of 344
structurally induced dichotomy between the Alpine and Hercynian domains is visible on the 345
residual relief map (Fig. 2B). Such a dichotomy is not easily noticeable on the main rivers’ 346
longitudinal profiles (Fig. 2C1; Fig. 2C2). Indeed, longitudinal profiles generally show 347
classical concave-shaped profiles. Nevertheless, some knickpoints can be distinguished on 348
many profiles, corresponding either to lithologic contacts (e.g. Bevinco; Fium Alto) or to 349
transitions from glaciated to non-glaciated areas (e.g. Golo, Asco, Tavignano), in good 350
agreement with Ksn values. These kind of observations have also been made in the 351
Himalayas where knickzones have been mapped downstream of formerly glaciated basins 352
(Korup and Montgomery, 2008), or in the Bolivian Andes where downstream increases of 353
knickzones and concavities correspond to orographic reaches (Schlunegger et al., 2011). 354
Some authors also suggest that these kinds of anomalies may be related to a local change in 355
the uplift rate (Fellin et al., 2005b). The values of the hypsometric integrals range between 356
0.33 and 0.47 indicating an intermediate state between mature and non-mature drainage 357
networks (Fig. 2C3; Tab. 1). 358
3-2) Quantification of millennial-scale denudation rates 359
The 10Be-derived denudation rates range from 15 to 95 mm.ka-1 (Fig. 3), with most of 360
them ranging between 40 and 60 mm.ka-1. Except for catchment 5, integration times range 361
between 7 to 18 ka (Tab. 2). Catchments with the lowest values (< 40 mm.ka-1) are mainly 362
located north of the studied area and drain either the Hercynian (Asco (# 5), the Tartagine (# 363
3)), or the Alpine (Lagani (# 2), Bevinco (# 1)) domains. The highest values (> 70 mm.ka-1) 364
mainly concern catchments in the Alpine domain (Casaluna (# 10), Fium Alto (#12)), except 365
for Restonica (# 15), which is located in the Hercynian domain (Fig.3). 366
With the exception of two samples (5 and 14), the studied catchments present a 367
maximum ice cover surface lower than 15% during less than 20% of the maximum 368
integration time. This implies a measured 10Be concentration of, at the most, 5% lower than 369
would be measured for the same permanently non-glaciated catchment. Given the 370
associated uncertainties, this does not significantly affect the apparent denudation rate. This 371
12
is also the case for catchment 14, with a maximum of 25 % of the drainage surface having 372
been covered by glaciers, but over ~8 % of the maximum integration period in the most 373
adverse conditions. Sample 5 integrates a long time period (~40 ka) that includes several 374
climatic changes and glacier development on more than 50% of its surface (Tab. 2). In this 375
case, the 10Be-derived denudation rate of 15.4 ± 1.8 mm.ka-1 represents an overestimation. 376
Nevertheless, this denudation rate is already the lowest of the studied area, so an 377
overestimation of this value do not change interpretations about processes responsible for 378
such a low denudation. Considering this discussion about the significance of 10Be 379
concentrations in past glaciated areas, we decided to not exclude any data because of the 380
presence of past glaciers in the following statistical analyses, even if the denudation rate 381
determined from sample 5 has to be considered as overestimated. 382
The effective denudation rate was computed for catchments containing a nested part, 383
i.e. 4, 7, 10, and 16. The rate is similar to that deduced from direct measurements for 384
catchments 7 and 16 and is roughly 20-30% higher for catchments 4 and 10. Taking into 385
account the associated uncertainties, the sediment flux at the outlet of catchment 8 is 386
consistent with the sum of the sediment fluxes of the Golo’s upstream tributaries (# 2, 3, 4, 7, 387
and 10), indicating an efficient mixing of sediment up to this point which gives confidence to 388
our results. This portion of the catchment (# 8) is nonetheless too small to allow us to 389
compute an accurate effective denudation rate. An effective denudation rate along the 390
downstream part of the Golo (# 9) cannot be computed because the sediment supply 391
deduced from measured 10Be concentrations do not show significant variations between the 392
upstream (# 8) and downstream (# 9) parts of the catchment portion (Fig. 3; Tab. 2). This 393
indicates that the sediments sampled from catchment 9 are mostly supplied by the upstream 394
part of the catchment. The downstream portion of the Golo River provides a larger part of the 395
finest material, so during sampling we probably miss the sediment resulting from denudation 396
of this sector. Since it is not possible to compute an accurate effective denudation rate, we 397
will exclude catchments 8 and 9 from our statistical analysis. 398
3-3) Rock strength mapping 399
Rebound values (Q) range from 40 ± 8 for Miocene clayed sandstone to 73 ± 5.5 for 400
rhyolite (Fig. 4A). Most of the rocks in the Alpine domain yield values lower than 60, whereas 401
the values are higher than 60 for most of the rocks in the Hercynian domain (Fig. 4B). The 402
Alpine and Hercynian domains are made up of three main structural units: phyllites, 403
Mesozoic sedimentary rocks (flysch, sandstone, and limestone), and ophiolitic complex in the 404
Alpine domain, and a crystalline metamorphic basement, with granites and acid volcanic 405
rocks in the Hercynian domain. Rebound values were averaged for each structural unit (Fig. 406
13
4C). The measurements show that the three harder units belong to the Hercynian domain (~ 407
65 ± 9; Fig. 4C) while the three softer are in the Alpine domain (~ 53 ± 12; Fig. 4C). In order 408
to compare the 10Be-derived denudation rates and mean catchment Q values, we have to 409
assume that the quartz content is almost similar in each unit, even if it difficult to accurately 410
estimate. Some specific rocks do not contain quartz (i.e. limestones) but they only represent 411
a small part of the total drainage area. Quartz-bearing rocks are contained in all units (even 412
ophiolites which are frequently cutted by acid crystalline dykes and quartz veins) and we 413
estimate that the most extended rocks contain a similar ~ 30-50% quartz-content. 414
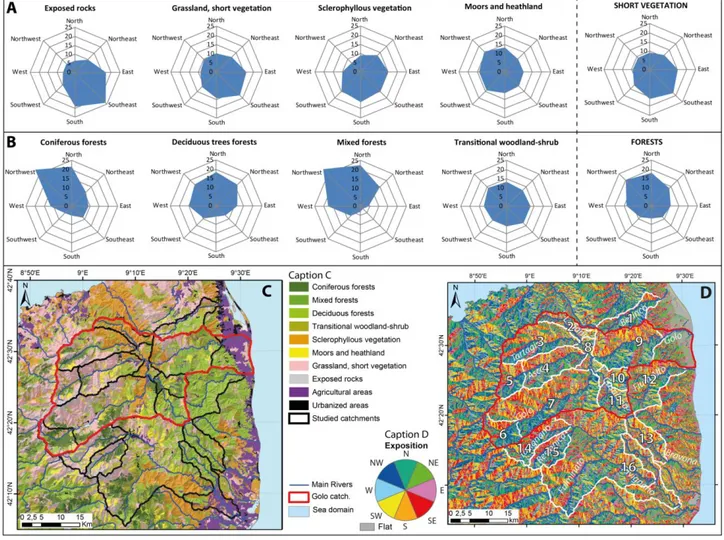
3-4) Inferring vegetal cover and relation with exposition 415
Nowadays, human activities are mainly concentrated in the alluvial plain. The 416
repartition of vegetation is thus almost natural in most parts of the studied area. Vegetation in 417
the Hercynian domain is often sparse or less developed, except for some coniferous forests 418
located in high-elevation valleys. In many places, rocks are directly exposed. The Alpine 419
domain is mainly covered by deciduous or mixed forests and sclerophyllous vegetation (Fig. 420
5C). Field expositions were calculated for each type of vegetation (Fig. 5A; 5B; 5C). Results 421
show that the forests are mainly on NW-exposed slopes (Fig. 5B). This is especially true for 422
coniferous and mixed forests, whereas transitional woodland-shrub domains do not develop 423
on any preferential slope orientation. Areas covered by short vegetal species such as 424
grassland or sclerophyllous are mainly on S- to SE-exposed slopes (Fig. 5A). Areas where 425
rocks directly outcrop are also mainly orientated to the southeast (Fig. 5A). To summarize, 426
vegetation was classified into two main groups: the short vegetation domain and the forest 427
domain, respectively (Fig. 5A; 5B). More than 61% of the forests are on N- to W-exposed 428
slopes, whereas only 26% are on E- to S-exposed slopes. For the short vegetation, 50% is 429
found on E- to S-exposed slopes, whereas only 27% is on N- to W-exposed slopes. 430
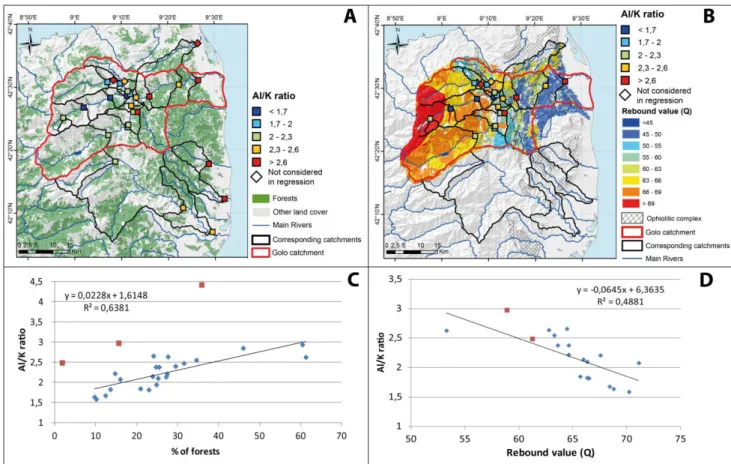
3-5) Al/K measurements reflecting the role of vegetation and/or lithology in 431
weathering intensity 432
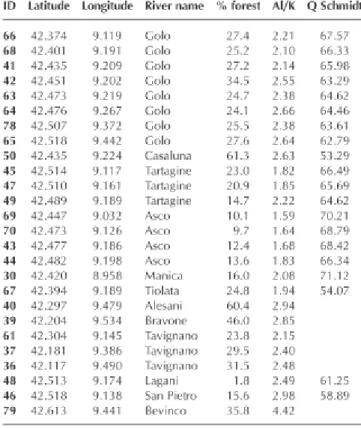
The Al/K ratio ranges from 1.6 to 4.4 (Table 3 and Fig. 6). It has been compared to 433
bedrock strength and vegetation cover. Indeed, the combined presence of high vegetation 434
(presence of forests) and soft bedrock promotes the efficiency of the weathering intensity 435
and regolith formation. In both cases, despite the scattered data, a correlation is noticed with 436
the Al/K ratio (R² = 0.64, linear for bedrock strength and R² = 0.49, linear for vegetal cover) 437
(Fig. 6C and Fig. 6D). The weaker the bedrock, the more important the forest cover in the 438
catchment, and the higher the Al/K ratio. Note that three samples (46, 48, 79; Tab. 3) are 439
excluded from the general regression lines. These samples result from the drainage of a 440
large amount of ophiolites whose initial K2O concentration was significantly lower than that of
14
other Corsican rocks (Grelou-Orsini, 1977; Bailly, 2004) (Fig. 6). The initial composition of 442
the drained rocks indeed influences the Al/K ratio (Bayon et al., 2012) when considering the 443
< 45 µm size fraction. This may also explain the scattering of the data (Fig. 6C and Fig. 6D). 444
Nevertheless, the overall correlation between Al/K ratio, rock strength and vegetal cover 445
leads us to believe that the Al/K ratio can adequately reflect the intensity of weathering in the 446
studied area. 447
3-6) Comparisons between denudation rates and morphometric indexes, 448
climate, lithology, and vegetal cover. 449
10Be-derived denudation rates are mostly integrated over a ~15 ka long time period. The
450
climate in Corsica was colder in the past (Kuhlemann et al., 2008) and the vegetation was 451
mainly constituted by steppes during late glacial and the first thousands years of the 452
postglacial period (Reille et al., 1999). The present-day pattern of forests in Corsica has been 453
nearly the same for the last 7-8 ka (Reille et al., 1999). This pattern is mainly controlled by 454
constant parameters (exposition, altitude, relative humidity, type of substratum…). Without 455
strong human activities, shifts in climate conditions would have only resulted in overall 456
denser or sparser vegetation without significant changes in the spatial pattern of vegetation 457
cover. In these conditions, the use of modern vegetation indices is reliable enough to assess 458
relative distribution over similar integration periods (e.g. Portenga et al., 2015; Torres Acosta 459
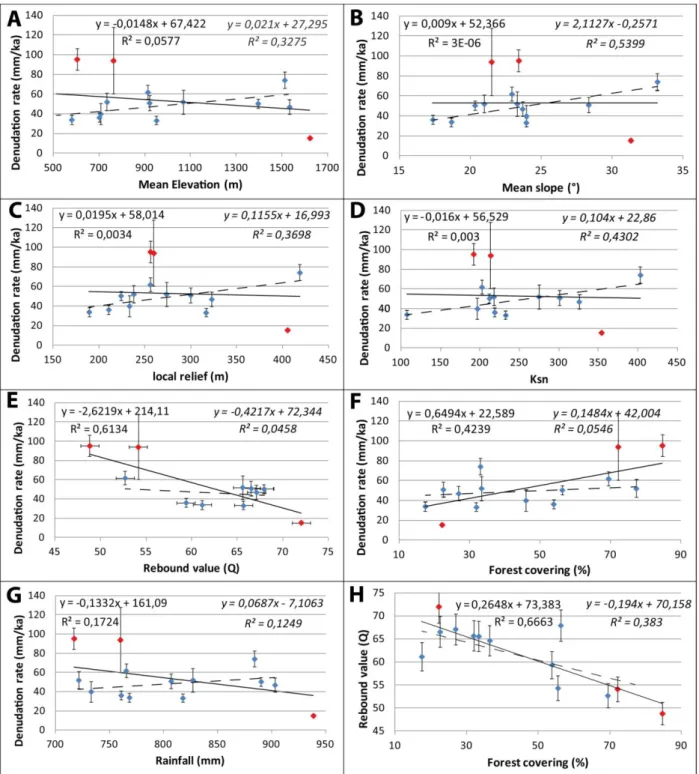
et al., 2015). Fig. 7 shows the relationship between the 10Be-derived denudation rates in the 460
studied catchments and different morphometric and climatic parameters such as mean 461
elevation (Fig. 7A), slope (Fig. 7B), local relief (Fig. 7C), normalized steepness indexes (Fig. 462
7D), and annual rainfall (Fig. 7G) (from the WorldClim database; Hijmans et al., 2005). We 463
also compare 10Be-derived denudation rates with the mean rebound value (Q), used as a 464
proxy of catchment rock strength (Fig. 7E), and with modern vegetation cover (Fig. 7F) 465
represented as the percentage of forests in the catchment. 466
At a first order, none of the morphometric parameters correlate with the deduced 467
denudation rates (R² < 0.05 for slope, Ksn, local relief, mean elevation), indicating that 468
morphology is not the main factor controlling the denudation. Mean annual rainfall values do 469
not correlate either (R² = 0.17). Denudation rates present a better fit with rock strength (Fig. 470
7E; R² = 0.61; linear) and percentage of forests (R²= 0.42; linear); the softer the rock and the 471
more developed the forest, the higher the denudation rate. Note that rock strength also partly 472
correlates with vegetal cover, the forests being preferentially developed on softer rocks (Fig. 473
7H). In detail, correlations between denudation, rock strength, and percentage of forest are 474
mainly driven by the three same samples: 4, 10, and 12. These samples correspond to the 475
extreme values of both rock strength and denudation rates (Tab. 2). If we compute the same 476
15
relationships without these three samples, correlations with rock strength and vegetation 477
weaken (R² = 0.05 for both parameters), whereas correlations with morphometric indexes 478
significantly increase (R² = 0.33 for mean elevation; R² = 0.54 for mean slope; R² = 0.37 for 479
local relief; R² = 0.43 for Ksn; Fig. 7). It appears that rock strength and/or vegetation controls 480
denudation rates at a first order but when values of these two parameters are weakly 481
distributed, a correlation between denudation rates and morphology can be noticed. 482
4- Discussion 483
4-1) Comparison with previously determined denudation rates 484
Denudation rates deduced for Corsica catchments are quite low in comparison with 485
rates determined in the foreland of the northern European Alps, which present a similar 486
geomorphic context (Wittmann et al., 2007; Norton et al., 2011; Molliex et al., 2016). 487
The contemporary averaged sediment flux (bedload and suspended load) estimated 488
from measurements performed at the Golo River outlet during the August 27th 1975 flood 489
event is 64,500 ± 7,500 t.yr-1 (Quenelec, 1982). Considering a mean density of 2.7 t.m-3 for 490
the eroded rocks, the corresponding deduced denudation rate is 23 ± 2.7 mm.ka-1. This value 491
is about half that deduced from 10Be concentration measurements, that is 46.5 ± 9.4 mm.ka-1 492
integrated over the last 13.5 ka (catch. 9, Fig. 3, Tab. 2). Due to the rather short time period 493
integrated when performing the direct sediment flux measurement method, extreme flood 494
events such as millennial or centennial floods are not necessary recorded, which may lead to 495
significant underestimations of fluxes in torrential or particular hydrological domains 496
(watersheds highly sensitive to sudden floods, for instance) (Kirchner et al., 2001; Serrat et 497
al., 2001; Molliex et al., 2016). 498
Conversely, a Holocene denudation rate of 48 ± 25.3 mm.ka-1 was deduced from the 499
estimation of sediment volumes deposited offshore (Calvès et al., 2013; unit 3; last 16 ka; 500
61.5 to 198 t.km².yr-1), similar to that deduced from in situ-produced 10Be concentration 501
measurements. Nonetheless, denudation rates deduced onshore could be inconsistent with 502
sediment flux deduced offshore because of the increase of sediment storage in the 503
catchment during glacial periods (Harbor and Warburton, 1993; Hinderer, 2012). Indeed, 504
glacial denudation leads to the formation of moraines, which are preserved during the glacial 505
period because of the lower precipitation rate and the lower transport capacity due to water 506
discharge. Moraines could thus constitute a significant volume of stored sediment that can 507
easily be mobilized during deglacial and interglacial periods when fluvial processes become 508
more efficient, yielding then to a higher sediment flux during interglacial periods. In the case 509
of eastern Corsica the relatively small extension of several preserved moraines (Krumrei, 510
16
2009; Kuhlemann et al., 2009) should not influence denudation rates inferred from sediment 511
fluxes. 512
4-2) A peri-glacial environment at steady-state equilibrium during Holocene ? 513
Long-term (Quaternary) denudation rates inferred from in situ-produced 10Be concentration 514
measurements on granitic crests ranged from 8 to 20 mm.ka-1 in the Golo catchment 515
(Kuhlemman et al., 2007; 2009). The late Quaternary incision rate of bedrock by the main 516
Golo stream, inferred from OSL-dated terraces geometry, ranges from 160 to 475 mm.ka-1 517
(Fellin et al., 2005a; Sømme et al., 2011). The 10Be derived catchment-scale denudation rate 518
determined for the Golo catchment in this study thus ranges between those estimated for the 519
crests and the main stream. In catchments where stream incision is more efficient than 520
denudation of the crests, the main stream location corresponds to the most effective 521
denudation zone and the crests are significantly less eroded, inducing an increase in relief 522
(e.g. Whipple et al., 1999; Meyer et al., 2010; Yanites and Ehlers, 2012; Champagnac et al., 523
2014). This relief-increase model for the Golo is supported by the stair-cased geometry of 524
terraces in the catchment, indicating the efficient incision of the stream at the Quaternary 525
scale. 526
In glacial and peri-glacial environments such as Corsica, three main climatic phases can be 527
distinguished through changes in sediment fluxes and sedimentary patterns (e.g. Church and 528
Ryder, 1972; Hinderer, 2012). The glacial phase leads to an onshore incision, a strong frost-529
cracking, and eolian alteration. The deglacial phase leads to a strong phase of aggradation 530
due to sea level rise and a high sediment supply controlled by glacial melting and moraine 531
degradation. This phase leads to the deposit of braided terraces. After the sediment supply 532
peak due to the deglaciation, sediment fluxes decrease exponentially and approach an 533
interglacial equilibrium (Ballantyne, 2002). 534
In a fluvial environment, channel steepening is linked to uplift and denudation rates. Channel 535
steepness is thus a reliable proxy that allows us to investigate these parameters (e.g. Anhert, 536
1970; Schmidt and Montgomery, 1995; Roering et al., 1999, 2001; Montgomery and 537
Brandon, 2002; DiBiase et al., 2012). The presented quantitative geomorphology study in 538
Corsica shows that glacial processes in the upstream part of the main catchments have 539
impacted the hydrographic network. On the other hand, global studies indicate that 540
morphology often controls denudation rates in such steep environments (e.g. Montgomery 541
and Brandon, 2002; Portenga and Bierman, 2011; Willenbring et al., 2013). In the northern 542
European Alps, 10Be-derived denudation rates appear to be partly correlated with 543
geomorphic metrics such as slope or relief (Wittmann et al., 2007; Delunel et al., 2010; 544
Norton et al., 2011; Glotzbach et al., 2013; Molliex et al., 2016). 545
17
10Be deduced denudation rates for Corsica can be considered as representative for the
546
Holocene, an interglacial period characterized by a warm and relatively wet climate (Reille et 547
al., 1997; 1999). The fact that denudation rates which integrate nearly all the Holocene 548
period still almost stable despite strong differences in morphologic indexes suggest that 549
Corsica reached the interglacial equilibrium described by Ballantyne (2002). 550
4-3) Importance of regolith production on Holocene denudation rates in 551
Corsica. 552
When the differences in rock strength and/or vegetation cover are significant, 553
denudation rates in Corsica, even if they still low, seem more evidently linked to rock strength 554
and vegetation than to morphology. Because forests are more developed in the Alpine 555
domain, where rocks are softer, than in the Hercynian domain, it is difficult to decipher 556
whether vegetation or rock strength mainly controls the denudation rates. We showed that 557
land exposure plays an important role in vegetal cover distribution, forests being well-558
developed on N- to W-exposed land, whereas S- to E-exposed land is preferentially covered 559
by short vegetation. This repartition could be explained by climatic parameters. Indeed, the 560
“Libecciu”, the prevailing wet wind in Corsica, blows from the west (Benevent, 1914; 561
Brandmeier et al., 2011). Brandmeier et al. (2011) previously pointed out the importance of 562
westward winds such as the “Libecciu” in the particular weathering of Corsican granites 563
characterized by the development of westward-oriented tafoni (erosional features in 564
granites). North-exposed lands have less sun exposure at a daily scale and are thus more 565
prone to keep humidity, which favors vegetation growing. The vegetation development 566
increases the efficiency of pedogenic processes: the more the vegetation is developed, the 567
more the soil and regolith are developed. Correlations between the Al/K ratio, percentage of 568
forests, and bedrock strength could suggest that the chemical weathering of the bedrock and 569
thus the development of the regolith is controlled by the vegetation and type of rocks. Norton 570
et al. (2014) demonstrated that at a low denudation rate, regolith production is poorly related 571
to changes in precipitation rate and temperature. This may explain why precipitation rates, 572
even if the resolution of the climatic data is poor in the studied area (WorldClim database; 573
Hijmans et al., 2005), do not correlate with 10Be-derived denudation rates (Fig. 7G). The 574
denudation rates in Corsica might thus to be directly related to the regolith development, the 575
chemical weathering being more efficient than the physical processes in the denudation 576
process. Some studies also demonstrate a better correlation of denudation rates with 577
lithology and regolith development than with morphometric parameters, even in mountainous 578
environments (Clapp et al., 2001; Morel et al., 2003; Palumbo et al., 2009). Indeed, in those 579
cases, rock strength is directly presented as being responsible for a more efficient regolith 580
production due to rock structures (joints, dipping, schistosity) (Densmore et al., 2007). 581
18
The size of the studied catchments may be an important parameter since correlation 582
between morphologies and denudation rates is often highlighted for large catchments or 583
small catchments in tectonically active settings (e.g. Riebe et al., 2000) while studies 584
concluding to a non-correlation between morphometric indexes and denudation rates often 585
concern small catchments in non-tectonically active settings (< 500 km²; Palumbo et al., 586
2009; Roller et al., 2012). Indeed, it has been suggested that in large catchments, spatial 587
variations of denudation rates linked to local parameters such as lithology or vegetation are 588
averaged (Summerfield and Hulton, 1994; Palumbo et al., 2009). 589
Conclusion 590
Millenial-scale 10Be-derived denudation rates obtained from the Golo sub-basins and 591
surrounding catchments are quite low, almost spatially stable and do not correlate at first 592
order with geomorphic metrics (such as slope, relief, steepness, mean elevation…), as it is 593
usually the case in similar geodynamic and geomorphologic settings. This suggests that 594
Corsica's landscape reached an interglacial steady-state equilibrium that might be caused by 595
the specific characteristics of the Mediterranean climate. Based on catchment mean rock 596
strength (Schmidt Hammer measurements) and vegetation cover distribution, we highlighted 597
that the rock strength and spatial distribution of the vegetation probably play a significant role 598
in the denudation distribution. The pattern of vegetation is partly controlled by its exposure to 599
the sun and the direction of the main regional wet-wind (so-called “Libecciu”). Even if it is 600
difficult to decipher the role of each parameter, we suggest that regolith formation by 601
chemical weathering is the main parameter controlling denudation in mountainous 602
environment experiencing such climatic context. Indeed, higher denudation rates are located 603
in areas where conditions are the most favorable for the development of regolith (weak 604
bedrock or/and developed vegetation). Al/K ratio measurements also support a weathering 605
efficiency linked to the development of the vegetation and/or to the strength of the 606
substratum. The small size of the studied catchments might play a role in the fact that short-607
term denudation rates better reflect local processes such as regolith formation rather than 608
the catchment’s general morphology. 609
Aknowledgements 610
S. Molliex benefited from a post-doc fellowship granted by LabexMER and IFREMER. 611
This work further benefited from a State Grant from the French "Agence Nationale de la 612
Recherche (ANR)" in the Program "Investissements d'Avenir" (ANR-10-LABX-19-01, Labex 613
Mer). The French CNRS INSU SYSTER partly financed the cosmogenic nuclide 614
concentration measurements. We thank L. Léanni, M. Arnold, G. Aumaître, and K. 615
Keddadouche for their valuable assistance during 10Be measurements at the ASTER AMS 616
19
national facility (CEREGE, Aix en Provence), which is supported by the INSU/CNRS, the 617
ANR through the "Projets thématiques d’excellence" program for the "Equipements 618
d’excellence" ASTER-CEREGE action, IRD and CEA. We thank B. Drussel and E. Gautier 619
for their assistance in the field. We are also grateful to P. Bierman, F. Schlunegger and 2 620
anonymous reviewers for their fruitful comments which contributed to improve the 621
manuscript. K. Kovacs post-edited the English style. 622
References 623
Ahnert F. 1970. Functional relationship between denudation, relief, and uplift in large mid-latitude 624
drainage basins. American Journal of Science 268: 243–263. 625
Ahnert F. 1984. Local relief and the height limits of mountain ranges. American Journal of Science 626
284: 1035–1055.
627
Allen PA. 1997. Earth Surface Processes. Blackwell: London; 404 pp.. 628
Arnold M, Merchel S, Bourles DL, Braucher R, Benedetti L, Finkel RC, Aumaître G, Gottdang A, Klein 629
M. 2010. The French accelerator mass spectrometry facility ASTER: Improved performance and 630
developments. Nuclear Instruments and Methods in Physics Research B 268: 1954–1959. 631
Aydin A, Basu A. 2005. The Schmidt hammer in rock material characterization. Engineering Geology 632
81: 1–14. 633
Bailly L. 2004. Séquestration ex-situ du CO2. Inventaire français des roches basiques et ultrabasiques.
634
BRGM report: BRGM/RP-53511-FR; 28 pp. 635
Balco G. 2001. Cosmogenic Isotope Production Rates Over Large Areas. 636
http://depts.washington.edu/cosmolab/P_by_GIS.html 637
Ballantyne CK. 2002. A general model of paraglacial landscape response. The Holocene 12(3): 371– 638
376. 639
Baran R, Friedrich AM, Schlunegger F. 2014. The late Miocene to Holocene erosion patter of the 640
Alpine foreland basin reflects Eurasian slab unloading beneath the western Alps rather than 641
global climate change. Lithosphere 6 (2): 124–131. 642
Basu A, Aydin A. 2004. A method for normalization of Schmidt hammer rebound values. Int. J. Rock 643
Mech. Min. Sci. 41: 1211–1214. 644
Bayon G, Dennielou B, Etoubleau J, Ponzevera E, Toucanne S, Bermell S. 2012. Intensifying 645
weathering and land use in Iron Age Central Africa. Science 335: 1219–1222. 646
Bénévent E. 1914. La pluviosité de la Corse. Recueil des travaux de l'institut de géographie alpine 2 647
(2): 239–264.
648
Bermudez MA, van der Beek PA, Bernet M. 2013. Strong tectonic and weak climatic control on 649
exhumation rates in the Venezuelan Andes. Lithosphere 5: 3–16. 650
Bierman P, Steig EG. 1996. Estimating denudation using cosmogenic isotope abundances in 651
sediment. Earth Surf. Process. Landforms 21: 125–139. 652
Bonnet S, Crave A. 2003. Landscape response to climate change: Insights from experimental 653
modeling and implications for tectonic versus climatic uplift of topography. Geology 31: 123– 654
126. 655
20
Bookhagen B, Strecker MR. 2012. Spatiotemporal trends in erosion rates across a pronounced rainfall 656
gradient: Examples from the southern Central Andes. Earth Planet. Sc. Lett. 327-328: 97–110. 657
Brandmeier M, Kuhlemann J, Krumrei I, Kappler A, Kubik PW. 2011. New challenges for tafoni 658
research. A new approach to understand processes and weathering rates. Earth Surf. Process. 659
Landforms 36: 839–852. 660
Brandon MT, Roden-Tice MK, Garver JI. 1998. Late Cenozoic exhumation of the Cascadia 661
accretionary wedge in the Olympic Mountains, northwest Washington State. Geol. Soc. Am. 662
Bull. 110: 985–1009. 663
Braucher R, Merchel S, Borgomano J, Bourlès DL. 2011. Production of cosmogenic radionuclides at 664
great depth: a multi element approach. Earth Planet. Sci. Lett. 309: 1–9. 665
Brocklehurst SH, Whipple KX. 2002. Glacial erosion and relief production in the Eastern Sierra 666
Nevada, California. Geomorphology 42: 1–24. 667
Brown ET, Edmond JM, Raisbeck GM, Yiou F, Kurz MD, Brook EJ. 1991. Examination of surface 668
exposure ages of Antarctic moraines using in situ produced 10Be and 26Al, Geochimica and 669
Cosmochimica Acta 55: 2269–2283. 670
Brown ET, Stallard RF, Larsen MC, Raisbeck GM, Yiou F. 1995. Denudation rates determined from 671
the accumulation of in situ-produced 10Be in the Luquillo Experimental Forest, Puerto Rico, 672
Earth Planet. Sci. Lett. 129: 193–202. 673
Brunet C, Monié P, Jolivet L, Cadet J-P. 2000. Migration of compression and extension in the 674
Tyrrhenian Sea, insights from 40Ar/39Ar ages on micas along a transect from Corsica to 675
Tuscany. Tectonophysics 321: 127–155. 676
Cacho I, Grimalt JO, Canals M. 2002. Response of the western Mediterranean Sea to rapid climatic 677
variability during the last 50,000 years: a molecular biomarker approach. Journal of Marine 678
Systems 33-34: 253–272. 679
Calvès G, Toucanne S, Jouet G, Charrier S, Thereau E, Etoubleau J, Marsset T, Droz L, Bez M, Jorry 680
S, Mulder T, Lericolais G. 2013. Inferring denudation variations from the sediment record; An 681
example of the last glacial cycle record of the Golo basin and watershed, East Corsica, Western 682
Mediterranean Sea. Basin Research 24: 1–22. 683
Cavazza W, Zattin M, Ventura B, Zuffa GG. 2001. Apatite fission-track analysis of Neogene 684
exhumation in northern Corsica (France). Terra Nova 13: 51–57. 685
Champagnac J-D, Molnar P, Sue C, Herman F. 2012. Tectonics, Climate, and Mountain Topography. 686
J. Geophys. Res. B: Solid Earth 117: B02403. 687
Champagnac J-D, Valla PG, Herman F. 2014. Late-Cenozoic relief evolution under evolving climate: A 688
review. Tectonophysics 614: 44–65. 689
Chantraine J, Autran A, Cavelier C. 1996. Geological map of France (1/1 000 000). Ed. BRGM: 690
Orléans. 691
Chittenden H, Delunel R, Schlunegger F, Akçar N, Kubik PW. 2014. The influence of bedrock 692
orientation on the landscape evolution, surface morphology and denudation (10Be) at the 693
Niesen, Switzerland. Earth Surface Processes and Landforms 39 (9): 1153–1166. 694