HAL Id: cea-02442317
https://hal-cea.archives-ouvertes.fr/cea-02442317
Submitted on 16 Jan 2020
HAL is a multi-disciplinary open access
archive for the deposit and dissemination of
sci-entific research documents, whether they are
pub-lished or not. The documents may come from
teaching and research institutions in France or
abroad, or from public or private research centers.
L’archive ouverte pluridisciplinaire HAL, est
destinée au dépôt et à la diffusion de documents
scientifiques de niveau recherche, publiés ou non,
émanant des établissements d’enseignement et de
recherche français ou étrangers, des laboratoires
publics ou privés.
Hybrid Stereocorrelation for 3D Thermomechanical
Field Measurements
A. Charbal, J.-E. Dufour, F. Hild, S. Roux, M. Poncelet, L. Vincent
To cite this version:
A. Charbal, J.-E. Dufour, F. Hild, S. Roux, M. Poncelet, et al.. Hybrid Stereocorrelation for 3D
Thermomechanical Field Measurements. Advancement of Optical Methods in Experimental Mechanics
vol.3, 3, pp.83-88, 2016. �cea-02442317�
Hybrid Stereocorrelation for 3D Thermomechanical Field Measurements
by A. Charbal,*,♣ J.-E. Dufour,* F. Hild,* S. Roux,* M. Poncelet,* and L. Vincent♣ *LMT, ENS Cachan / CNRS / Univ. Paris Saclay, 61 avenue du Président Wilson
F-94235 Cachan cedex, France
Email: {charbal, dufour, hild, poncelet, stephane.roux}@lmt.ens-cachan.fr
♣ DEN – Service de Recherches Métallurgiques Appliquées, CEA, Université Paris Saclay, F-91191 Gif sur Yvette cedex, France
Email: [email protected]
Abstract:
Three dimensional displacement fields are measured thanks to an original stereo system made of InfraRed (IR) and visible light cameras. This configuration provides the thermal fields which drive the thermomechanical loading and the 3D surface displacement fields, i.e. the response of the studied material. The calibration of the stereo rig is performed by using a 3D target of known geometry and the large gray level variations that occur on the IR images are accounted for by applying a low-pass filter. Because of a slight disorientation of the target, a further calibration correction step revealed necessary. After correction of the target orientation, the measured displacement fields display a good qualitative agreement (no quantitative comparison has been performed yet) with the expected fields.
1. Introduction
Thermal fatigue that may occur in components of nuclear power plants [1–3] is studied with a new experimental setup [4] in which cyclic thermal shocks are applied on an austenitic stainless steel plate by a pulsed laser [5]. The measurements of 2D thermal and 3D displacement fields of the impacted surface are performed with IR and visible light cameras. A finite element analysis of such experiment predicts the largest strain variations during loading to be in the out-of-plane direction, resulting in out of plane displacements of several micrometers [6]. In experimental mechanics stereocorrelation (SC) is commonly used in order to measure such displacement fields [7–11]. In the present study, it is proposed to perform SC by using an original hybrid combination of one IR and one visible light camera. The challenges to be addressed are to use two imaging systems with different properties (i.e., pixel sizes, definitions, gray level distribution and changes when the temperature evolves). A first feasibility analysis was performed [12] and proved on simple rigid body translations (RBT) that such a combination could be used for prescribed amplitudes varying from 5 to over 100 µm. It has also been shown that the scale factor could be readjusted by applying known RBTs during the calibration step. The RBTs were performed at room temperature. Therefore no digital level variations on the IR frames occurred. The assumption of ‘gray’ level conservation was still satisfied and low SC-residuals were obtained. In the present case, the laser shocks induce by locally heating-up the sample large gray level changes. This phenomenon has to be accounted for in order to be able to perform such measurements. The other issue is to calibrate the stereo rig when the characterized sample is a 2D plate. The use of a 3D target [13] to determine the projection matrices is necessary, which are later used for the SC measurements.
First, an overview of the experimental setup is presented, then the SC methodology is described, and finally the measured displacement and temperature fields are illustrated and discussed.
2. Experimental setup
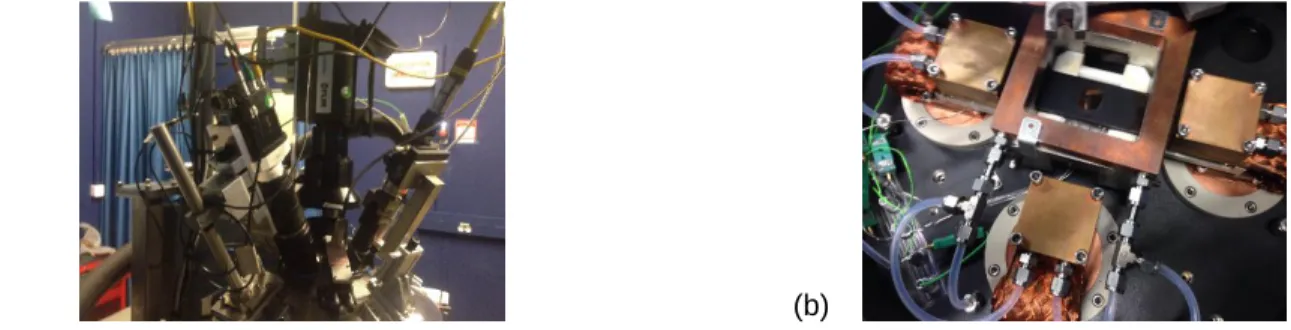
The use of such particular combination of cameras is mostly due to the fact that the experimental bench does not allow for having more than two cameras. The characterized sample is placed within an atmosphere controlled chamber in which secondary vacuum is first performed before introducing He gas. A pulsed laser (TruPulse 156, TrumpfTM, 𝜆 = 1064 nm) is used to apply cyclic thermal shocks to stainless steel plates. In this case study, the shock frequency is 1 Hz, the pulse duration is 50 ms and the incident pulsed power is equal to 310 W. The applied temperature variation is 200 °C on the impacted zone and the initial sample temperature is 400 °C. A focusing optics allows a top-hat power density to be obtained over a 5-mm disk at a working distance of 29 cm. Due to the relatively low absorptivity of the polished then pre-oxidized surface an inclination of the beam is needed to reflect the incident beam onto an absorber. The latter gives access to the mean power reflected by the sample. An infrared camera (x6540sc FLIRTM, definition: 640 × 512 pixels, 𝜆 = [35 µm] reduced to 𝜆 = [3.974.01 µm] with an internal filter for high temperature measurements) is used with a high magnification lens allowing for a pixel size of 15 µm. A visible light camera (MIRO M320S, Vision ResearchTM, definition: 1920 × 1080 pixels) leads to a pixel size of 10 µm.
(a) (b)
Figure 1: Experimental setup (a) and characterized sample (b) within the chamber
3. Stereocorrelation
As for any stereoscopic system, camera calibration is needed. A two-step camera calibration is performed. The first one consists in optical distortion corrections. As the images are projected on a supposed perfect numerical model (of the 3D object) such effects must be considered. The followed method to account for such biases uses integrated DIC (I-DIC) [14], which determines the intrinsic parameters such as radial, decentering and prismatic coefficients [1516] using a dedicated 2D
calibration target. Once the images are corrected of their respective distortions, the projection matrices are estimated in a second step.
The determination of the projection matrices is based on the 3D coordinates of the numerical model projected onto the picture planes. The global approach proposed in Ref. [10] considers the 3D mathematical model of the sample and the use of an I-DIC algorithm allows for the optimization of the projection matrices by using a pseudo-kinematic basis. By working in the parametric space of the surface, it enables for images of different definition and nature to be registered. The homogeneous coordinates in each camera are related to the 3D positions by
{s lxl slyl sl } = [𝐌𝐥][𝐗] and {s rxr sryr sr } = [𝐌 𝐫][𝐗] (1)
where [𝐌𝐥,𝐫] denotes projection matrices for the left and right cameras, [𝐗] the homogeneous coordinates, xl,r and yl,r the pixel
coordinates in each camera, and sl,r the scale factors for the left and right cameras. I-DIC consists of minimizing the functional
τ
τ = ∫[f(𝐱𝐥(u, v, [𝐌𝐥]) − g(𝐱𝐫(u, v, [𝐌𝐫])]𝟐dudv 𝐑𝐎𝐈
(2)
with respect to the unknown matrix components, where u and v denote the parametric coordinates of the surface model. Its linearization with respect to the corrections dMijl,r of the sought quantity yields
τlin= ∫[f(𝐱𝐥) − g(𝐱𝐫) + (𝛁f ∙ 𝛅𝐱𝐥)(𝐱𝐥) − (𝛁g ∙ 𝛅𝐱𝐫)(𝐱𝐫)] 𝟐
dudv
𝐑𝐎𝐈
(3)
The positions in the IR and visible cameras are iteratively updated by computing the sensitivity fields
𝛅𝐱𝐥,𝐫= ∂𝐱𝐥,𝐫
∂Mijl,rdMij
l,r
(4)
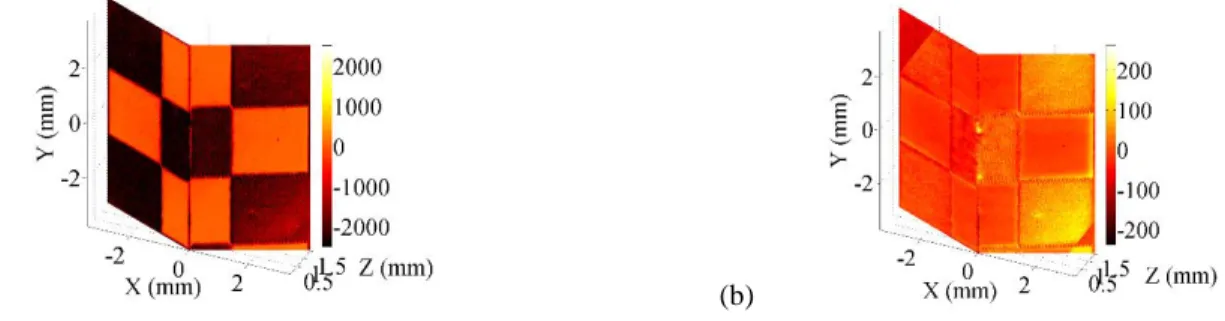
At convergence, the gray level residual field shows that the black and white squares are matching (Figure 2). The low level, i.e. 1.3 % of the dynamic range is due to the gray level corrections that are included (contrast and brightness). Before such corrections the residuals are as high as 19% of the dynamic range. It is worth emphasizing that both images have not the same gray levels distributions.
(a) (b)
Figure 2: I-DIC residuals before (a) and after gray levels corrections (b) during the second calibration step
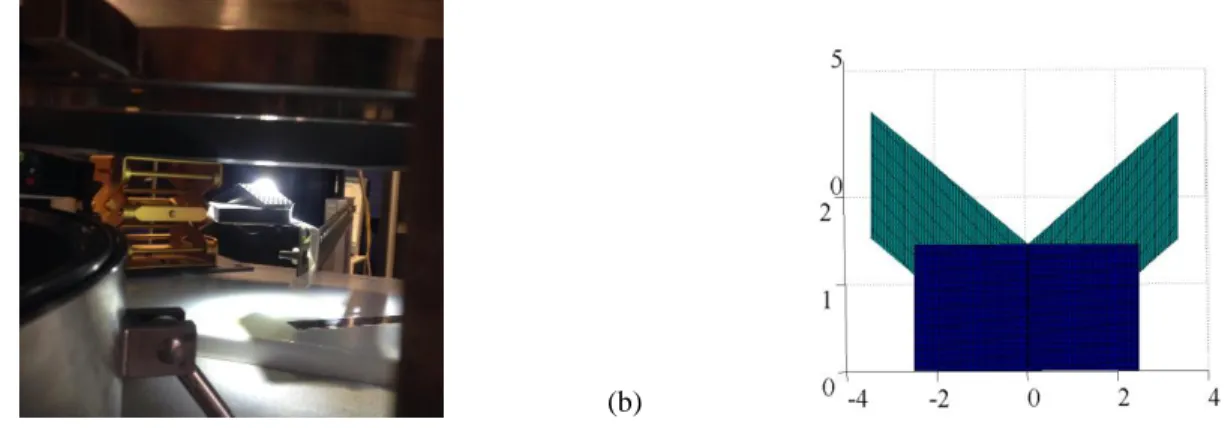
In the following, it is assumed that the 3D sample used for the calibration phase and the characterized 2D surface share the same reference position. The calibration phase and a schematic view of the assumption are shown in Figure 3.
(a) (b)
Figure 3: 3D target in an equivalent position (a).
Due to experimental constraints, it is assumed that the 2-D and 3-D samples (b) are located at a same reference position
Once the transformation matrices are determined, it is possible to perform SC analyses to measure 3D displacements by registering the reference and deformed images shot by the IR and visible light cameras. SC consists in minimizing the following functional [11] 𝛕 = ∫[f(𝐱𝐥(u, v, 𝑷 𝒊𝒋) − g(𝐱𝐥(u, v, 𝑷𝒊𝒋+ 𝒅𝑷𝒊𝒋)] 𝟐 dudv 𝐑𝐎𝐈 + ∫[f(𝐱𝐫(u, v, 𝑷 𝒊𝒋) − g(𝐱𝐫(u, v, 𝑷𝒊𝒋+ 𝒅𝑷𝒊𝒋)] 𝟐 dudv 𝐑𝐎𝐈 (5)
where 𝑷𝒊𝒋 are the control points of the NURBS surface, that are in the present case of a 3 × 15 coordinates defining the 15
control points. The displacement fields are then obtained by estimating the motions 𝒅𝑷𝒊𝒋 of the control points in the deformed
images g. A Newton-Raphson algorithm is implemented to minimize the above functional. The linear equations to solve read [12]
[𝐂]{𝐝𝐩} = {𝐛} (6)
with the SC matrix
[𝐂] = ∫ (𝝏𝒙𝒓 𝝏𝑷𝒊𝒋 ∙ 𝜵𝒇 𝒓𝜵𝒇𝒓∙ 𝝏𝒙𝒓 𝝏𝑷𝒊𝒋 + 𝝏𝒙𝒍 𝝏𝑷𝒊𝒋 ∙ 𝜵𝒇 𝒍𝜵𝒇𝒍∙ 𝝏𝒙𝒍 𝝏𝑷𝒊𝒋 ) 𝑹𝑶𝑰 𝒅𝒖𝒅𝒗 = [𝑫𝒓]𝑻[𝑫𝒓] + [𝑫𝒍]𝑻[𝑫𝒍] (7)
where the unknowns are incrementally determined as
{𝐝𝒑} = {𝒅𝑷𝒊𝒋} (8)
and the SC vector
{𝐛} = [𝑫𝒓]𝑻(𝑓𝑟− 𝑔𝑟) + [𝑫𝒍]𝑻(𝑓𝑙− 𝑔𝑙) (9)
At this stage the gray level corrections brought to the IR frames consist in removing the laser spot by first applying a Gaussian filter to the affected image and perform a subtraction to retain only the high frequencies. One may also use other methods available in the literature such as those proposed in Refs [1718].
4. Results and discussions
The 3D target was not perfectly positioned on the reference position as illustrated in Figure 4. This is visible on the residuals maps and the laser print present on both sides. The residuals are 3.4 % and 1.2 % for the IR and visible light cameras, respectively. Hence, prior to calculations a correction was applied to the 2D model.
(a) (b)
Figure 4: Residual maps obtained with the (a) the visible light (in gray levels) and (b) IR (in digital levels) images after convergence (residuals interpolated in the parametric space)
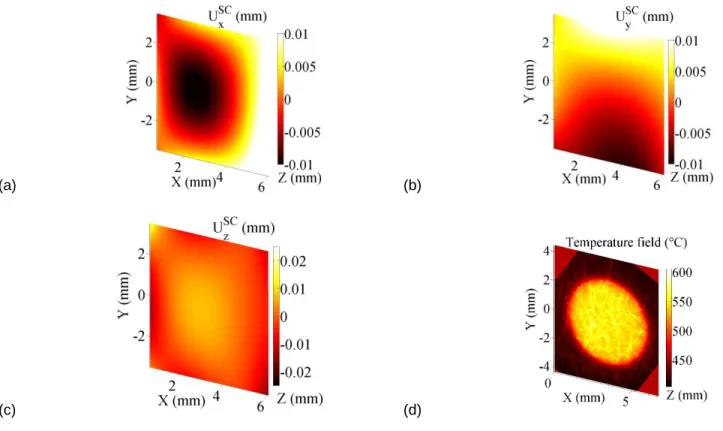
Before any corrections, the measured displacement and temperature fields are plotted in Figure 5. The in-plane fields are expected to describe biaxial expansion. The amplitudes are close to the expected levels, namely, few micrometers for the applied loading, but they fail to reveal the expected expansion. This is due to the sample frame not being perfectly collinear to the 2D mathematical model of the surface or/and being rotated compared to the 3D frame used during the calibration step.
(a) (b)
(c) (d)
Figure 5 : Displacements fields (a) Ux (b) Uy and (c) Uz (color bar in mm) before any rotation corrections, and (d) corresponding temperature field (color bar in °C)
{𝐔} = [𝑹] {𝐔𝑺𝑪} (10)
where [𝑹] denotes a 3D rotation matrix, and {𝐔} the displacement field vector in the sample frame, while {𝐔𝑺𝑪} is the displacement vector determined in the rotated configuration. After corrections of a few degrees on each component the displacement field is in much better agreement with the expected biaxial expansion in the central part (Figure 6).
(a) (b)
(c) (d)
Figure 6: Displacements fields (a) Ux (b) Uy and (c) Uz (colorbar in mm) after a rotation correction and (d) the corresponding thermal loading (colorbar in °C).
To avoid such posterior corrections, it is a necessity to perform reference RBTs on a 2D plate in which the same calibration procedures have been applied to preserve a unique referential.
5. Conclusions and perspectives
The new experimental setup designed to investigate thermal fatigue by using laser shocks allows 3D thermomechanical fields to be measured. Even if the testing machine only enables for the use of two cameras, global SC [1011] can be used to measure 3D surface displacements [12] and thermal fields with a hybrid system. Its feasibility has been shown herein.
The calibration procedure needs to be further improved to have a better knowledge of the sample frame in comparison with that of the calibration target. The various uncertainties should also be investigated. The latter quantities need to be known when comparing or even performing material property identification with FE simulations [1920]. Last in this work a simple gray level correction was implemented for IR pictures. More advanced procedure may be implemented in order to enhance the sensitivity of the IR camera [17].
References
[1] A. Amiable, S. Chapuliot, S. Contentinescu, and A. Fissolo, “A computational lifetime prediction for a thermal shock experiment, Part I: Thermomechanical modeling and lifetime prediction,” Fatigue Fract. Eng. Mater.
Struct., vol. 29, pp. 209–217, 2006.
[2] A. Fissolo, S. Amiable, O. Ancelet, F. Mermaz, J. M. Stelmaszyk, A. Constantinescu, C. Robertson, L. Vincent, V. Maillot, and F. Bouchet, “Crack initiation under thermal fatigue: An overview of CEA experience. Part I: Thermal fatigue appears to be more damaging than uniaxial isothermal fatigue,” Int. J. Fatigue, vol. 31, no. 3, pp. 587–600, 2009.
[3] A. Fissolo, C. Gourdin, O. Ancelet, S. Amiable, A. Demassieux, S. Chapuliot, N. Haddar, F. Mermaz, J. M. Stelmaszyk, A. Constantinescu, L. Vincent, and V. Maillot, “Crack initiation under thermal fatigue: An overview of CEA experience: Part II (of II): Application of various criteria to biaxial thermal fatigue tests and a first proposal to improve the estimation of the thermal fatigue damage,” Int. J. Fatigue, vol. 31, no. 7, pp. 1196– 1210, 2009.
[4] L. Vincent, M. Poncelet, S. Roux, F. Hild, and D. Farcage, “Experimental Facility for High Cycle Thermal Fatigue Tests Using Laser Shocks,” Proc. Fatigue Design 2013, vol. 66, pp. 669–675, 2013.
[5] C. Esnoul, L. Vincent, M. Poncelet, F. Hild, and S. Roux, “On the use of thermal and kinematic fields to identify strain amplitudes in cyclic laser pulses on AISI 304L strainless steel,” Photomechanics 2013, Montpellier (France), 2013.
[6] A. Charbal, L. Vincent, F. Hild, M. Poncelet, J.-E. Dufour, S. Roux, and D. Farcage, “Characterization of temperature and strain fields during cyclic laser shocks,” Quant. InfraRed Thermogr. J., DOI: 10.1080/17686733.2015.1077544, 2015.
[7] J.-J. Orteu, Y. Rotrou, T. Sentenac, and L. Robert, “An Innovative Method for 3-D Shape, Strain and Temperature Full-Field Measurement Using a Single Type of Camera: Principle and Preliminary Results,”
Exp. Mech., vol. 48, no. 2, pp. 163–179, 2008.
[8] J.-J. Orteu, “3-D computer vision in experimental mechanics,” Opt. Meas., vol. 47, no. 3–4, pp. 282–291, 2009.
[9] M. A. Sutton, “Computer Vision-Based, Noncontacting Deformation Measurements in Mechanics: A Generational Transformation,” Appl. Mech. Rev., vol. 65, no. 5, 050802–050802, 2013.
[10] B. Beaubier, J.-E. Dufour, F. Hild, S. Roux, S. Lavernhe, and K. Lavernhe-Taillard, “CAD-based calibration and shape measurement with stereoDIC,” Exp. Mech., vol. 54, no. 3, pp. 329–341, 2014.
[11] J.-E. Dufour, B. Beaubier, F. Hild, and S. Roux, “CAD-based Displacement Measurements with Stereo-DIC : Principle and First Validations,” Exp. Mech., vol. 55, no. 9, pp. 1657–1668, 2015.
[12] A. Charbal, J. E. Dufour, F. Hild, M. Poncelet, L. Vincent, and S. Roux, “Hybrid Stereocorrelation Using Infrared and Visible Light Cameras,” Exp. Mech., DOI: 10.1007/s11340-016-0127-4, 2016.
[13] G. Besnard, J.-M. Lagrange, F. Hild, S. Roux, and C. Voltz, “Characterization of Necking Phenomena in High-Speed Experiments by Using a Single Camera,” EURASIP J. Image Video Process., vol. 2010, no. 1, 215956, 2010.
[14] J.-E. Dufour, F. Hild, and S. Roux, “Integrated digital image correlation for the evaluation and correction of optical distortions,” Opt. Lasers Eng., vol. 56, pp. 121–133, 2014.
[15] D. C. Brown, “Decentering distortion of lenses,” Photogrammetric Engineering, pp. 444–462, 1966. [16] D. C. Brown, “Close-range camera calibration,” Photogrammetric Engineering, pp. 855–866, 1971.
[17] A. Maynadier, M. Poncelet, K. Lavernhe-Taillard, and S. Roux, “One-shot Measurement of Thermal and Kinematic Fields: InfraRed Image Correlation (IRIC),” Exp. Mech., vol. 52, no. 3, pp. 241–255, 2012.
[18] M. Poncelet and H. Leclerc, “A new digital images correlation algorithm to get rid of light reflection problems,” Proc. Photomechanics 2015, Delft (the Netherlands), 2015.
[19] S. Avril, F. Pierron, M. A. Sutton, and J. Yan, “Identification of elasto-visco-plastic parameters and characterization of Lüders behavior using digital image correlation and the virtual fields method,” Mech.
Mater., vol. 40, no. 9, pp. 729–742, 2008.
[20] F. Mathieu, F. Hild, and S. Roux, “Image-based identification procedure of a crack propagation law,” Eng.