HAL Id: insu-01928122
https://hal-insu.archives-ouvertes.fr/insu-01928122
Submitted on 4 Aug 2020
HAL is a multi-disciplinary open access
archive for the deposit and dissemination of
sci-entific research documents, whether they are
pub-lished or not. The documents may come from
teaching and research institutions in France or
abroad, or from public or private research centers.
L’archive ouverte pluridisciplinaire HAL, est
destinée au dépôt et à la diffusion de documents
scientifiques de niveau recherche, publiés ou non,
émanant des établissements d’enseignement et de
recherche français ou étrangers, des laboratoires
publics ou privés.
Temporal and spatial variations in crustal accretion
along the Mid-Atlantic Ridge (29°-31°30’N) over the last
10 m.y.: Implications from a three-dimensional gravity
study
Janet Pariso, Jean-Christophe Sempéré, Céline Rommevaux
To cite this version:
Janet Pariso, Jean-Christophe Sempéré, Céline Rommevaux. Temporal and spatial variations in
crustal accretion along the Mid-Atlantic Ridge (29°-31°30’N) over the last 10 m.y.: Implications from
a three-dimensional gravity study. Journal of Geophysical Research, American Geophysical Union,
1995, 100 (B9), pp.17781 - 17794. �10.1029/95jb01146�. �insu-01928122�
JOURNAL OF GEOPHYSICAL RESEARCH, VOL. 100, NO. B9, PAGES 17,781-17,794, SEPTEMBER 10, 1995
Temporal and spatial variations in crustal accretion along the
Mid-Atlantic Ridge (290-31030 ' N) over the last 10 m.y.:
Implications from a three-dimensional gravity study
Janet E. Pariso and Jean-Christophe
Semptr6
School of Oceanography, University of Washington, Seattle C61ine Rommevaux
Institut de Physique du Globe de Paris, CNRS, Paris, France
Abstract. We have conducted
a three-dimensional
gravity
study
of the Mid-Atlantic
Ridge near
the Atlantis
Transform
to study
the evolution
of accretionary
processes
at this slow-spreading
center
over the last 10 m.y. We have removed
from the free-air
gravity anomaly
the gravity
contribution
of the density
contrast
at the seafloor
and the gravity contribution
of the lateral
density
variations
associated
with the cooling
of the lithosphere.
The resulting
residual
gravity
anomaly
exhibits
substantial
variation
along
and across
the ridge axis. The residual
gravity
anomaly
can be accounted
for by variations
in crustal
thickness
of up to 3 km. For the first two
segments
south
of the Atlantis
Transform,
the midportions
of the segments
have been associated
with thick crust and the segment
discontinuities
have been associated
with thin crust for the last
10 m.y., suggesting
the segment
discontinuities
act as long-term
boundaries
in the delivery
of
melt to the individual
segments.
In contrast,
our calculations
indicate
that for the segments
north
of the fracture
zone, thick crust
is associated
with the midportions
of segments
and thin crust
is
associated
with segment
discontinuities
only in crust
less than -3 m.y. This result suggests
that
focused
mantle upwelling
has only recently
developed
north of the fracture
zone. The onset
of
focused
mantle
upwelling
at approximately
2-3 m.y. may be related
to a change
in the spreading
direction
which occurred
between
magnetic
anomalies
5 and 3 (Figure
1) and resulted
in changes
in
the geometry
of the plate boundary
north of the fracture
zone. Cross
sections
of crustal
thickness
extracted
along the midpoint
traces
of paleosegments
show
that, for a few segments,
up to 2 km
of gradual
crustal
thinning
is observed.
We suggest
that the "apparent"
crustal
thinning
is a result
of lateral
changes
in mantle
density
associated
with buoyant
upwelling
not predicted
by the
passive
flow model used
in our study.
Variations
in computed
crustal
thickness
are observed
across
axis in all of the paleosegments
in our study area, but are not correlated
between
individual
segments.
If these
computed
crustal
thickness
variations
are due to temporal
variations
in melt
production,
this implies
that there is little interdependence
in the amount
of melt supplied
to
adjacent
segments.
Introduction
Geophysical and geochemical studies in recent years have
clearly demonstrated that in addition to transform offsets, the mid-ocean ridge system is segmented at a scale of 20 to 100 km by nontransform discontinuities [Macdonald et al., 1988].
At slow-spreading centers, such as the Mid-Atlantic Ridge (MAR), nontransform discontinuities have offsets ranging from 0 to ~ 40 km [Rona et al., 1976; Phillips and Fleming, 1977; Searle et al., 1977; Ramberg et al., 1977; Rona and Gray, 1980; Sempdrd et al., 1990; Needham et al., 1991; Gente et al., 1991; Sempdrd et al., 1993]. Nontransform offsets delimit the fundamental accretionary units along spreading
centers and thus despite their small dimensions, constitute important structural and magmatic boundaries within oceanic lithosphere.
Copyfight 1995 by the American Geophysical Union. Paper number 95JB01146.
0148-0227/95/95JB-01146505.00
Segments of the slow-spreading Mid-Atlantic Ridge are often characterized by quasi circular mantle Bouguer anomaly (MBA) lows [Kuo and Forsyth, 1988; Lin et al., 1990; Blackman and Forsyth, 1991; Rommevaux et al., 1994;
Detrick et al., 1995]. When the gravity effects of the cooling
lithosphere are removed from the MBA, the residual gravity
anomalies (RGA)form bands extending on either side of spreading segments. The presence of low-residual anomalies
indicates that the midportions of the segments are underlain by low-density material, and that the discontinuities bounding the
segments are underlain by comparatively denser material. Such density variations can be interpreted as resulting from crustal
thickness variations (thick crust at segment midpoints and thin crust at segment boundaries), or the presence of low-
density (hot) mantle beneath segment midpoints, or a
combination of the two [Kuo and Forsyth, 1988; Lin et al.,
1990]. Theoretical studies of mantle flow beneath ridges
indicate that the gravity signal associated with lateral density variations in the melting region beneath ridges is small [e.g.,
Scott, 1992; Rabinowicz et al., 1993]. Thus crustal thickness 17,781
17,782 PARISO ET AL.: GRAvrrY STUDY OF M•D-ATLAN'nC RIDGE
variations are a likely cause for a large fraction of the residual gravity anomalies observed along the Mid-Atlantic Ridge [Lin and Phipps Morgen, 1992]. The seismic refraction study of Tolstoy et el. [1993] confirmed to a first order that crustal
thickness variations are responsible for most of the observed residual gravity signal over the 33 ø S segment of the MAR.
Together, these results indicate that mantle upwelling and
crustal accretion at slow-spreading centers are complex, three- dimensional processes.
The relationship between upper mantle processes and the segmentation of the plate boundary is poorly understood. The presence of off-axis traces of nontransform discontinuities on the flanks of the ridge indicates that segment boundaries may be maintained for periods of time in excess of several m.y. [Rone et el., 1976; Schouten et el., 1987; Sloen end Petriet,
1992; Sempdrd et el., 1995]. Existing geophysical data over the Mid-Atlantic Ridge suggest that mantle upwelling is
focused beneath the middle of most spreading segments [Kuo
and Forsyth, 1988; Lin et al., 1990]. However, the timing,
duration, and temporal stability of focused mantle upwelling beneath the MAR are fundamental parameters over which we have little observational control at present. The duration of buoyant upwelling events beneath the spreading center, and the relationship between upwelling at neighboring segments are important factors which may control the segmentation of the plate boundary. Since variations in crustal thickness are a consequence of focused mantle upwelling, the pattern of crustal thickness on the flanks of the Mid-Atlantic Ridge provides important constraints on the evolution of the segmentation of the plate boundary.
As a means of examining the processes which influence mantle upwelling, ridge segmentation, crustal construction, and their evolution at mid-ocean ridges, we have conducted a detailed geophysical survey over the flanks of the Mid- Atlantic Ridge near the Atlantis Transform over the last 10
m.y. Our investigation was conducted as a two-leg study in
collaboration with the Institut de Physique du Globe de Paris as
part of the French American Ridge Atlantic (FARA) program.
The present study focuses on the Mid-Atlantic Ridge between 29 ø and 31 ø 30' N.
Data Acquisition
We present and analyze gravity and bathymetry data
collected during two surveys along the Mid-Atlantic Ridge
(Figure 1). Geophysical data over the spreading axis (< 2 Ma
lithosphere) south of 30ø40'N were collected during R/V R. D. Conrad leg RC2912 [Lin et al., 1990; Purdy et al., 1990; Sernpdrd et al., 1990; Sernpdrd et al., 1993]. Data on the flanks of the MAR south of 30 ø 40'N and on the axis and flanks of the spreading center north of 30 ø 40' N were collected in
September-November 1992 aboard R/V Maurice Ewing (leg EW9210 [Sernpdrd et al., 1994]). The RC2912 and EW9210 data include gravity and multibeam bathymetry (Sea Beam and Hydrosweep, respectively). The flanks of the spreading center south of our survey area between 28 ø and 29 ø N out to 10 Ma were surveyed in 1990 by the N/O Jean Charcot (leg SARA, Segmentation Ancienne de la Ride Aftantique) and these results
are published elsewhere [Rornrnevaux et al., 1994; Sloan and
Patriat, 1992]. Because the SARA results were previously published we do not discuss these data in our analyses or
interpretation. However, we do include the SARA results in
Plate 1 for comparison with those from our survey area. The coverage obtained during leg EW9210 consists of axis- perpendicular profiles with a spacing of 4-6 km. Continuous GPS coverage was obtained throughout the survey. Bathymetry data were collected using the Hydrosweep multibeam system [Chayes, 1992]. Gravity data during leg EW9210 were acquired
with a Bell Aerospace Gravity Meter-3 and a Bodenseewerk
KSS-30 marine gravity meter. Cross-over errors within leg
80øW 40øN 0 ø 31øN 30øN 29øN 40øW 0 ø 43øW 42øW 41øW 40øW 100 km 31øN 30øN 29øN 44øW 43øW 42øW 41øW 40øW
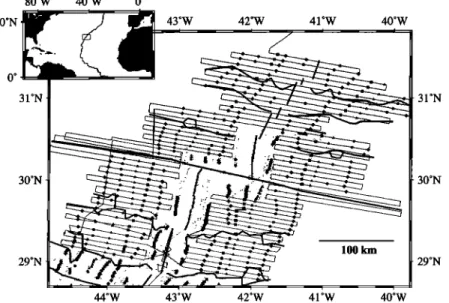
Figure 1. Location of our survey area in the North Atlantic. Ship tracks for the EW9210 data are shown by
stippled black lines and ship tracks for previously published data acquired aboard the R/V R.D. Conrad and the
N/O Jean Charcot are shown by the dotted shaded lines. The position of the ridge and the Atlantis Fracture Zone
are shown by the heavy black lines. Magnetic anomaly picks are after Sloan and Patriat [1992] and P. Patriat
et al., [1995] and are shown by symbols. Solid circles are anomaly 2 (1.86 Ma), solid diamonds are anomaly 3
(3.85 Ma), solid squares are anomaly 3A (5.69 Ma), solid triangles are anomaly 4 (7.01 Ma), shaded circles are anomaly 4A (8.69 Ma), shaded diamonds are anomaly 5 (10.1 Ma).
PARISO ET AL.: GRAVITY STUDY OF MID-ATLANTIC RIDGE 17 783
i
31øN30øN
]
29ON
}*
.. 100 kmBathymetry (m)
I
5200 - 4800 4400 4000 - 3600 - 3200 -. 2800 - 2400 - 2000 - 1600 - 1200 - 800 400Computed Crustal Thickness (km)
Plate 1. (top) Sea
Beam
[Purdy
et al., 1990;
Sempdrd
et al., 1990]
and Hydrosweep
(this study)
bathymetry
in
our survey area. The deep valley extending from west to east at ~ 30 ø N is the Atlantis Fracture Zone. The
remaining
east-west
troughs
that extend across
axis are the traces
of nontransform
discontinuities. (bottom)
Crustal
thickness
computed
by downward
continuing
of the residual
gravity
anomaly
to a depth
of 6 km below
the seafloor.
Values
south
of 29 ø N were not included
in our discussion
but were previously
published
by
Romrnevaux et al. [1994]. South of the Atlantis Fracture Zone, low crustal thickness values are associated with
discontinuity
traces
out to 10 Ma. North of the Atlantis
Fracture
Zone, low crustal
thickness
values
are only
consistently associated with discontinuity .traces for crust < 3 Ma. Contour interval is 0.5 km.EW9210 were 1.8 + 2.1 mGal for the KSS-30 gravimeter and 5.5 + 8.7 mGal for the BGM-3 gravimeter. Because of the
lower cross-over errors, we used the data from the KSS-30
gravimeter
in our analysis. Drift during the EW9210 survey
was 0.53 mGal for the KSS-30. Gravity data were collectedevery 6 seconds and smoothed using a 5-point running
average. The cross-over error between the RC2912 and EW9210 surveys was 1.6 + 1.8 mGal. Thus we estimate the
accuracy of our data to be better than 2 mGal. The gravity data were gridded with a minimum curvature method using splines in
17,784 PARISO ET AL.: GRAVITY STUDY OF MID-ATLANTIC RIDGE
tension [Smith and Wessel, 1990] at a spacing of 1.0 km and 0.78 km (north-south and east-west, respectively) to obtain a 512 by 512 grid.
Geologic Setting
The Mid-Atlantic Ridge between 29 ø N and 31 ø 30" N consists of six spreading segments separated by nontransform discontinuities and the Atlantis Transform (Plate 1 and Figure
2; [Sernp6rd et al., 1990; Sernpdr6 et al., 1995]). The
morphology of the ridge is characterized by a 1- to 2-km-deep rift valley. The Atlantis Transform is approximately 70 km, long and the nontransform offsets present in our survey area have lengths ranging from 5 to 20 km. Previous work identified nontransform offsets south of the Atlantis Transform near 28 ø 51' N and 29 ø 23'N [Semp•r• et al., 1990].
North of the Atlantis Transform, we have identified additional nontransform offsets near 30 ø 33'N, 30 ø 50' N, and 31 ø 12' N.
The right-stepping discontinuities and transform accommodate a 102 ø spreading direction along the spreading center which has a regional trend of 0260-040 ø. The full spreading rate within our survey area has varied from ~ 33 mm yr' at the time of anomaly 5 to ~ 24 mm yr ' at present [Sempdrd et al., 1995].
South of the Atlantis Transform, the MAR is characterized
by two approximate 60-km-long segments (segments 2S and 1S in Figure 2) separated by an offset of 17 km. The on-axis bathymetric depressions associated with the discontinuities extend off-axis in the form of deep troughs that can be traced out to 10 Ma old crust. These troughs, which offset magnetic
anomalies on the flank of the spreading center, are interpreted
as the off-axis traces of the segment discontinuities. Both the discontinuity traces and magnetic anomaly offsets indicate that these two segments have existed for at least 10 m.y., and that they have lengthened and migrated to the south during that _
44øW 43øW 42øW 41øW 40øW
• -" ,
•¾•.•
_
Ju TM r\L.... '• *•, •,• • • , • 30øN 44øW 43øW 42øW 41 øW 40øW Bathymetry (m). ,
0 2500 3000 3500 4000 4500 5000 6000Figure 2. Bathymetric map of our survey area. Major tectonic boundaries inchde individual segments (medium
lines, labeled 2S, 1S, 1N, 2N, 3N, 4N), the Atlantis Fracture
Zone, nontransform discontinuity traces (heavy east-west
lines), and paleosegment midpoim traces (heavy dashed lines). Light black lines parallel to ridge •is represent isochrons (2, 4, 6, •d 8 Ma, respectively) inte•reted from the magnetic •omaly pattern. Contour interval is 500 m.
time. In addition, both bathymetric data and the magnetic anomaly patterns indicate two small intra-offset ridges ceased to exist at 8 m.y. [$ernpdrd et al., 1995].
North of the Atlantis Transform, the morphology of the spreading center and its flanks, as well as the pattern of magnetic anomalies, indicates a complex segmentation
history. North of 30 ø 30' N, the 040ø-trending spreading center
is comprised of short, en 6chelon ridges, 9 to 39 km in length and with offsets ranging from 8 to 15 km, located within a well-defined rift valley. On the basis of magnetic anomalies, $ernpdrd et al. [1995] suggested that these short ridges developed to accommodate changes in spreading direction which have taken place over the last 10 m.y. Although we have identified a total of six en 6chelon ridges, we have proposed that the two shortest ridges (14 and 9 km in length), located between 30 ø 47' N and 30 ø 54' N and between 31ø 08' N and 31 ø 13' N, are intra-offset volcanic constructions which
accommodate large axial discontinuities [$ernpdrd et al., 1994]. These two short ridges are associated with off-axis bathymetric depressions that can be traced out to about 4 Ma (50 km off-axis). We interpret these depressions as the traces of discontinuities which have separated the three existing segments (2N, 3N, and 4N) north of 30 ø 30' N over the past 4 m.y. As we shall describe below, our gravity results are consistent with this interpretation. The presence of deep bathymetric troughs in lithosphere older than 4 Ma., and the pattern of magnetic anomalies indicates that between 4 and 10 Ma, the MAR consisted of four segments within our survey area. However, the length and boundaries of these paleosegments differ from the present spreading center configuration.
Gravity Analysis and Results
Mantle Bouguer Anomaly
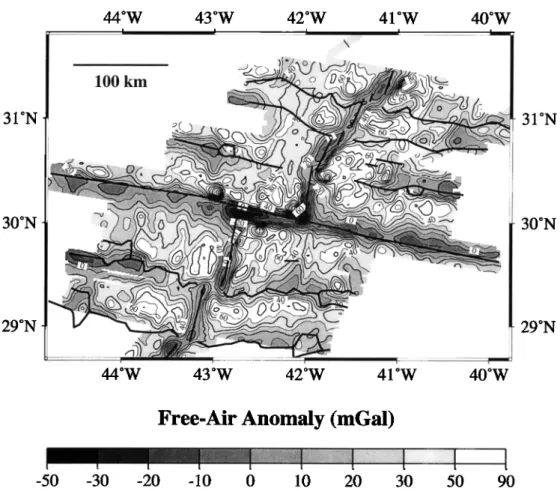
The free-air gravity anomaly is dominated by the gravitational attraction of the density contrast at the seafloor (Figure 3a). We removed from the free-air anomaly the
contribution of the crust/water and crust/mantle interfaces,
assuming a constant crustal thickness. We calculated the
mantle Bouguer correction following the method of Prince and Forsyth [1988] and Kuo and Forsyth [1988]. We assumed a
crustal thickness of 6 km, and used values of 1030, 2730, and
3330 kg m
-3 for the density
of seawater,
crust,
and mantle,
respectively. The mantle Bouguer correction was subtracted from the free-air anomaly point-by-point along the EW9210 and RC2912 tracks at locations where we have gravity measurements. Figure 3b shows a gridded version of the MBA determined by our point-by-point subtraction.
The variations in the MBA (Figure 3b) are due to (1) crustal or mantle density variations not accounted for in our model, or (2) crustal thickness variations. Although it i s
possible to use a layered crustal density structure, Prince and
Forsyth [1988] have shown that in a similar tectonic environment, a two-layer crust, with densities of 2200. and
2900 kg m
'3 for upper crust and layer three, respectively,
results in a difference of less than 1 mGal in the mantle Bouguer correction. Although the youngest lithosphere is
covered with little or no sediment, sediment ponds are likely
to be present in the bathymetric depressions on the flanks of
the
ridge
(Figure
2). Since
we do not
have
a measure
of the true
PARISO ET AL.: GRAVITY STUDY OF MID-ATLANTtC RIDGE 17,785 31øN 30øN 29øN 44øW 43øW 42øW 41øW 100 km 40øW 44øW 43øW 42øW 41øW 40øW 31øN 30øN 29øN
Free-Air Anomaly (mGal)
-50 -30 -20
I I I I I I I
-10 0 10 20 30 50 90
Figure 3a. The'free-air gravity anomaly .is dominated by short wavelength variations which reflect the density contrast at the seafloor. Contour interval is 10 mGal.
sediments which are observed primarily in the traces of discontinuities on the flanks of the spreading center. The study of Rornrnevaux et al. [1994] in the SARA area (immediately south of our study area between 28ø-29øN) indicated that the largest value of sediment thickness within the older portion of the discontinuity traces is about 400 m. However, most
sediment ponds in the Rornrnevaux et al. [1994] study have thicknesses of 100-200 m and their contribution to the free-air anomaly is less than, or of the order of, the uncertainty in our
data. The error in the calculation of the mantle Bouguer
•:orrection
obtained
by not taking into account
the thickest
sediment ponds is of the order of 3-5 mGal [Rornrnevaux et al.,
1994]. Because we do not account for sediments, which have a lower density than the crust in our calculations, we over estimate the Bouguer correction and under estimate the MBA values over the oldest basins (> 8 Ma) within our survey area.
The MBA is characterized by a series of closed-contour
Cbull's eye") lows, which are generally centered
over the
midportions of the individual spreading segments, and a longwavelength increase in the anomaly with age, which is due to
the density increase associated with the cooling of the lithosphere with age (Figure 3b). The MBA lows form a near-
linear trend of 36 ø from north to south in our survey area. Our
off-&xis
coverage
of the first two segments
south of the
Atlantis Transform shows that the low MBA values associated with the midportion of the segment and the higher MBA values associated with the discontinuities extend off-axis. We note that the trace of the MBA high is slightly offset from the trace
of the bathymetric low that defines the discontinuity traces.
The pattern of low MBA values at the mid-portion of segments
and high MBA values associated with segment discontinuities is also present over the four segments north of the transform,
but it extends about 20 km off-axis (-2 Ma old crust). This
pattern of MB^ variations is not observed over the two short,
volcanic ridges located along axis between segments 2N, 3N,
and 4N, justifying our interpretation that they are intra-offset
volcanic ridges.
Residual Gravity Anomaly
We followed the method of Kuo and Forsyth [1988] to remove the effect of a cooling lithosphere from the MBA to obtain the residual gravity anomaly (RGA). We calculated the gravity field due to lateral density variations in the cooling lithosphere using the passive flow model of Phipps Morgan and Forsyth [1988]. This model yields the temperature and flow field in a constant-viscosity mantle due solely to plate spreading (assumed to be at a constant rate). This model does not include flow produced by buoyancy effects in the mantle.
We used
a half-spreading
rate of 12.5 mm yr -1 and a thermal
diffusivity
0c)of 10
-6 m 2 s
-l. To predict
density
variations
in
the lithosphere from the temperature field, we computed a
coefficient
of thermal
expansion
(ct = 3.55 x 10
-5 øK-l)
based
on the average rate of subsidence in our area between 3 and 10
Ma (subsidence
coefficient
= 455 m Ma -1/2). The density
variations determined using this ct value were then used to
predict the variation in the gravity field at sea surface associated with our lithospheric cooling model (Figure 3c). To
PARISO ET AL.: GRAVrrY STUDY OF MID-ATLANT•C RIDGE
44øW
43øW
42øW
41øW
40øW
•:
ß ....
...
'-:
-
•?:
-:%•:_...•:•:•:,
.• •,;:•,•
--- . •:.
...
•:
.".'•-•'
•,: •.
:::::::::::::::::::::::::
•
' .... ....
•,
•.
•:,
.:•::.
.:.
..•
•. • ß
.
..
• ...
•
•:•"
•
...
•
:,•-•:•.•-•-
:..:.
• . .
..•:.:..:.•.•..:?A:•?::•-•:.'"""'•"••••-•..,
'
_
:.•:•:,•
•'"'•'••••••:•':t:
,-, o
44øW
43øW
42øW
41øW
31øN 30øN29øN
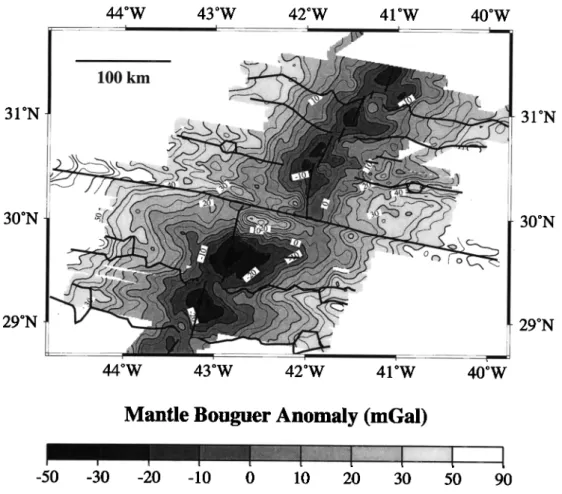
40øWMantle Bouguer Anomaly (mGal)
-50 -30 -20 -10
0
10
20
30
50
90
Figure 3b. The mantle Bouguer anomaly is dominated by a long wavelength increase in gravity which
reflects the increase in density of the lithosphere away from the axis due to cooling. The closed-contour gravity lows over individual segments indicate regions of relatively low-density. Contour interval is 5 mGal.
obtain
the RGA, we performed
a point-by-point
subtraction
of
the thermal correction from the mantle Bouguer anomaly at
trackline
locations
where
we have gravity measurements.
Figure 3d shows a gridded version of the point-by-point subtraction.
Similar to the MBA, the RGA shows that well-developed lows are present over the midportions of the two segments immediately south of the Atlantis Transform. The gravity lows
extend
off-axis'to
the
edge
of our
survey
area.
High
RGA
values
are observed
associated
with, but slightly offset from, the
segmen
t discontinuities
south
of the Ariantis Transform
and
can be traced well to the edge of our coverage. There is no anomalous gravity signature associated with the two intra- offset ridges identified in crust 8 - 10 Ma The RGA north of the Atlantis Transform also exhibits low values centered near (but ..
not always directly beneath) the midportions of segments 1N- 2N, 3N and 4N. However, in contrast to the segments south of
the Ariantis
Transform,
the residual
gravity
anomaly
lows
extend only ~ 20 km off-axis.Computed Crustal Thickness
To investigate possible crustal thickness variations within our survey area, we assumed that the gravity residual,
remaining after the effects of the density contrast at the seafloor and lithospheric cooling were removed from the free-
air anomaly,
was
due
only to variation
in topography
at the
Moho. Moho topography was calculated by downward
continuation of the RGA to a depth of 6 km below the seafloor on a 512 by 512 grid. Because downward continuation is
unstable at short wavelengths, we applied a low-pass filter
with a cutoff wavelength of 25 km and a cosine taper to 35 km. We calculated crustal thickness using values of Moho topography and bathymetry at trackline positions where we have gravity measurements. Plate 1 shows a gridded version of
the crustal thickness values (filtered to remove the short
wavelengths introduced by bathymetry). The crustal thickness values show significant variations (up to 3 km) in our study
area (Plate 1). The computed crustal thickness variations correspond to RGA variations of 10 - 20 mGal (both parallel
and perpendicular
to the ridge)
and are thus
well above
the
noise level of our measurements. Our results indicate that for the two segments south of the Atlantis Transform, the pattern
of thick crust associated with the midportions of segments and thin crust associated with segment discontinuities is
maintained out to a crustal age of 10 Ma. For segments north
of the fracture zone, crustal thickness maxima are observed
near the central portions of segments and crustal thickness
minima are present near the discontinuities only to --20 km off-axis (-2 m.y.). For crust older than 2 m.y., crustal thickness variations do not correlate well with the pattern of
segmentation observed on axis.
In addition
to along-axis
changes
in crustal
thickness,
significant variations are also present across axis (Plate 1, Figure 4). First, undulations in calculated crustal thickness are observed on the flanks of individual segments. At wavelengths
PARISO ET AL.: GRAVrrY STUDY OF MID-ATLANTIC RIDGE 17,787 31øN 30øN
29øN
[
44øW 43øW 42øW 41øW 40øW I 100 km 44øW/
43øW 42øW 41øW .: 31øN 30øN29øN
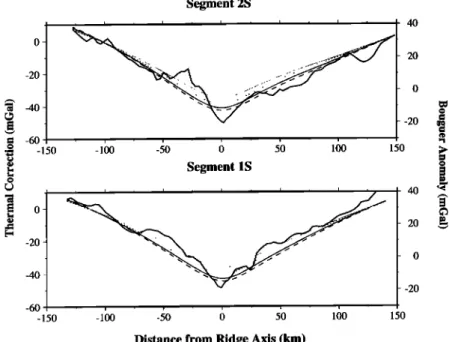
40øWThermal Correction (mGal)
-50 -4O
Figure 3c. The gravity signal at sea surface predicted from lithospheric cooling based on the passive flow model of Phipps Morgan and Forsyth [1988]. Note that although cooling associated with the transform has an important effect on the predicted gravity field, there is no discernable change in predicted gravity field associated with nontransform discontinuities. Contour interval is 2 mGal.
on the order of 40 km (-3 m.y.)• these undulations have amplitudes between 1-2 km and in general are not symmetric
about the ridge axis (except for segment 1S). Second, for the two segments adjacent to the Atlantis Fracture Zone (1S and 1N), the computed crustal thickness is asymmetric with respect to the axis. The midpoint trace of the west flank of segment 1N is generally 0.5 - 1.0 km thicker than that of the east flank and, the midpoint trace of the east flank of segment 1S center is generally 0.5 - 1.0 km thicker than that of the west flank. This suggests a long-term, across-axis 'asymmetry in crustal
production, tectonism, or accretion for the two segments
adjacent to the transform fault. Third, several of the segment flanks exhibit "apparent" crustal thinning, of the order of 1-2
km, with age.
Interpretation
In our calculation of crustal thickness, we have assumed that
the residual gravity anomaly is due solely to topography at the
Moho. Theoretical models of mantle flow beneath ridges,
including various sources of buoyancy, indicate that density
variations in the mantle cannot account for the observed range of variation in the RGA along the axis of the Mid-Atlantic
Ridge [Lin and Phipps Morgan, 1992; Scott, 1992;
Rabinowicz et al., 1993]. .. Thus the primary source of
variability in along-axis, residual gravity appears to reside in
crustal thickness variations and/or lateral density variations in the crust. However, variations in melt fraction retained and in
mantle density due to depletion may explain some of the across-axis variations in residual gravity [Scott, 1992; Su and
Buck, 1993].
Three studies have indicated that crustal thickness estimated using gravity data compares well, to a first order, with crustal
thickness
measured
using seismic
refraction
[Morris and
Detrick, 1991; Tolstoy et al., 1993; Detrick et al., 1995]. However, discrepancies between the seismic and gravity
determination of crustal thickness do appear in these studies.
For example, crustal thickness calculated using gravity compares well with that determined using seismic refraction
south of the Kane Fracture Zone, except in the immediate
vicinity of the transform [Morris and Detrick, 1991]. This discrepancy was attributed to unusually low crustal densities in
the vicinity of the fracture
zone. Similarly, Tolstoy et al.
[1993] showed that crustal thickness variations computed
using gravity data for a segment located near 33 ø S on the Mid- Atlantic Ridge agree to a first order with those seismically
determined. However, their study indicated that approaching 'segment discontinuities, crustal thinning and a decrease in
crustal density are both required. This result was confirmed by Detrick et al. [1995] near the Oceanographer Transform. In the following discussion, we use the residual gravity anomaly to infer variations in crustal thickness. It is important to keep in mind that the observed variations in the residual gravity anomaly may also be due, in part, to variations in crustal or mantle densities.
17,788 PARISO ET AL.: GRAVITY STUDY OF MID-ATLANTIC RIDGE
44øW
43øW
42øW
41øW
.... 100 km 40øW'1
31 øN
31 øN
• :-%:..- .. 30øN ,• ,. ....•:•.44øW
43øW
42øW
41øW
40øW
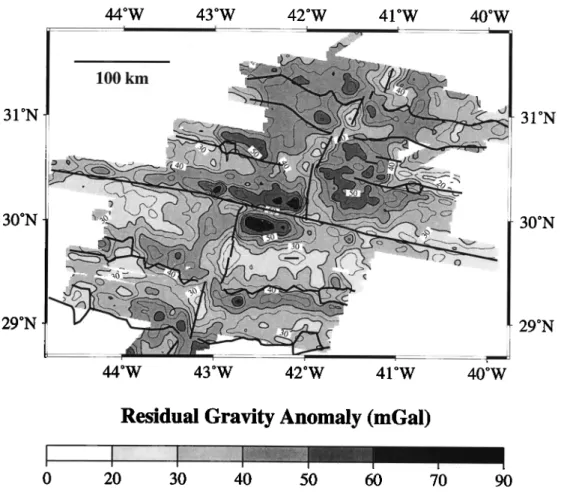
Residual Gravity Anomaly (mGal)
0
20
30
40
50
60
70 90Figure 3d. The residual gravity anomaly (RGA) was calculated by subtracting the gravity field due to lithospheric cooling from the Bouguer anomaly. South of the transform, off-axis traces of segment
discontinuities are associated with relatively high RGA values. North of the transform the off-axis traces of segment discontinuities are not correlated with low RGA values. Contour interval is 5 mGal.
Crustal Thickness Along Segment Mid-points
w E 4 , , i , i , i , , , , i , i , i . 2N 6 4 8 IN 6 4 i i i i ] i 8 2S 6 4
-10 -8 -6 -4 -•2 0
:•
'•
•
1• l'O
Age (Ma)Figure 4. Cross sections of computed crustal thickness along segment mid-point traces of individual spreading segments. Profiles 2S, 2N west; and 3N suggest that gradual crustal thinning has taken place. Note that although many
profiles show undulations
in computed
crustal
thickness,
these
variations are poorly correlated between individual segments.Spatial Variations in Crustal Structure
The variations in crustal thickness that we have computed
based on the residual gravity anomaly reflect to first order the present and past pattern of segmentation of-the plate boundary
within our survey area (Plate 1). In general, the fracture zone and nontransform discontinuities are associated with thin crust (-5-6 km),_ while the midportions of segments are associated
with thicker crust (-6-8 km). However, we note that the
pattern of gravity anomalies (and thus computed crustal
thickness) is complex. The thinnest crust is often slightly offset (to the north or south) from the 'deepest portion of both
the fracture zone and the discontinuity traces. For segments 1N and 2N, the thickest crust is slightly offset to the east and
west, respectively, from the ridge axis itself. For segments
south of the Atlantis Transform (1S and 2S), the pattern of thick crust at the segment midpoint and thin crust beneath the segment ends is maintained out to 10 Ma.
Previous studies [Kuo and Forsyth, 1988; Lin et al., 1990]
have suggested that the low-residual gravity values over the
centers
of individual
spreading
segments
were
expressions
of
focused mantle upwelling. If this interpretation is correct, our results indicate that focused mantle upwelling has been maintained for at least the last 10 m.y. within segments 1S and 2S. In the SARA area, immediately south of our survey area, previously published results show that focused upwelling has also existed at.least for the last 10 m.y. (Plate 1, Romrnevaux
et al. [1994]). Thus segment discontinuities function as long- lived boundaries in the delivery of melt to individual spreading.
PARISO ET AL.: GRAVITY STUDY OF MID-ATLANTIC RIDGE 17,789
segments, or they constitute the lithospheric response of long-lived focused mantle upwelling on time scales up to 10 m.y.
Crustal thickness variations along the four segments identified north of the Atlantis Transform are very complex. On axis, the midportions of these segments are associated with
high values of computed crustal thickness, but the loci of
thickest crust are not necessarily centered directly under the
axis. Our bathymetry data indicate that the neovolcanic zones
north of 30 ø 30' N consists of en 6chelon ridges located within the rift valley. Although our bathymetric data suggest that even the two shortest ridges (30 ø 48' N-30 ø 55' N and 31 ø 1 1' N-31 o 13' N) are the product of constructional volcanism, these short ridges are associated with RGA highs that extend off-axis and correspond to bathymetric troughs. Thus we infer that these short ridges accommodate axial discontinuities associated with off-axis traces. These intra-offset ridges may evolve into spreading segments in the future. Bathymetry, magnetics, and gravity data suggest that segments 1N and 2N may be in the process of merging into one segment. The
magnetic anomaly pattern indicates that there has been a
substantial decrease in the length of the offset at the 1N/2N discontinuity over the last 10 m.y. (Figure 1, Semp•r• et al. [1995]). Although the discontinuity trace is associated with a
bathymetric depression in 4-10 Ma crust (> 50 km off-axis),
only a minor topographic disruption is observed at the 1N/2N boundary in crust < 4 m.y. (< 50 km from the axis). Further,
crust formed at the 1N/2N discontinuity is only associated with
minor thinning for ages < 3 Ma. These observations suggest that in the last 3-4 m.y., the discontinuity between segments 1N and 2N has not been a significant boundary in the geometry
of mantle upwelling.
North of the fracture zone, the pattern of thin crust associated with segment discontinuities and thick crust associated with segment midpoint holds reasonably well for crust less than - 3 m.y. (with the exception of the 1N/2N discontinuity). Although there are substantial crustal
thickness variations from- 3 to 8 m.y. (values range from 5 to
8 km), the maxima and minima in crustal thickness exhibit a
poor correlation with the paleosegmentation pattern (Figures
1 and 3d). A change in the paleosegmentation pattern can be
identified at about 3 -4 m.y. north of 30 ø 30' N and may be related to a progressive, clockwise rotation of the spreading direction from -93 ø to -106 ø between magnetic anomalies 5
(-10.1 Ma) and 3A (-5.7 Ma) [Semp•rg et al., 1995]. This
reorganization of the plate boundary appears to be
contemporaneous with the accretion of a more complex crustal structure which does not exhibit bands of thin and thick crust at high angles to the spreading axis.
The lack of association of the MAR between 30 ø 30' N and 31 ø 30' N with an organized pattern of residual gravity
anomalies, may be explained in two ways. First, the changing segmentation pattern associated with the reorganization of the
plate boundary may have resulted in crustal thickness variations which are smaller in scale than we can resolve with our analysis (-25 km). Alternatively, the reorganization of
the plate boundary may result in mantle upwelling which is not focused in a three-dimensional sense. This effect of the reorganization appears to only have affected spreading
segments located away from the Atlantis and Hayes Transforms. Indeed, Detrick et al. [1995] have shown that the segment located between 33øN and the Hayes Transform is associated with a pattern of residual gravity anomalies akin to that south of 30 ø 30'N.
Although the crust is thinner near the traces of both
transform and nontransform discontinuities, the loci of
thinnest crust do not coincide with the deepest part of the traces. Our calculations show that on the west side of the
Atlantis Fracture Zone, the thinnest crust is located beneath
the north wall of the fracture zone rather than below the deepest part of the fracture zone valley (Plate 1). Similar results have been obtained in previous gravity studies over fracture zones [Prince and Forsyth, 1988; Blackman and
Forsyth, 1991]. Away from the fracture zone in our study area, zones of gravity-inferred thin crust (or highest residual gravity) are observed along the traces of nontransform discontinuities. The morphology of the discontinuities is generally asymmetric in nature [Rommevaux et al., 1994]. The side of the trace which is formed at the "inside corner" of the discontinuity dips steeply toward the offset trace, while crust formed at the outside comer dips more gently. The thinnest
crust is found along the steep wall rather than the deepest portion of the trace. The thin crust found under the steep walls of fracture zones and discontinuities may be a result of the combined effects of a diminished magma supply, resulting from their location at the distal end of an upwelling plume, and tectonic extension. Alternatively, our computed crustal thickness values may be in error because the density of the crust and mantle beneath the deepest part of the discontinuity may be lower than that used in our model. For example, localized serpentinization could reduce the density of the mantle or crust underlying the deepest part of the discontinuity trace.
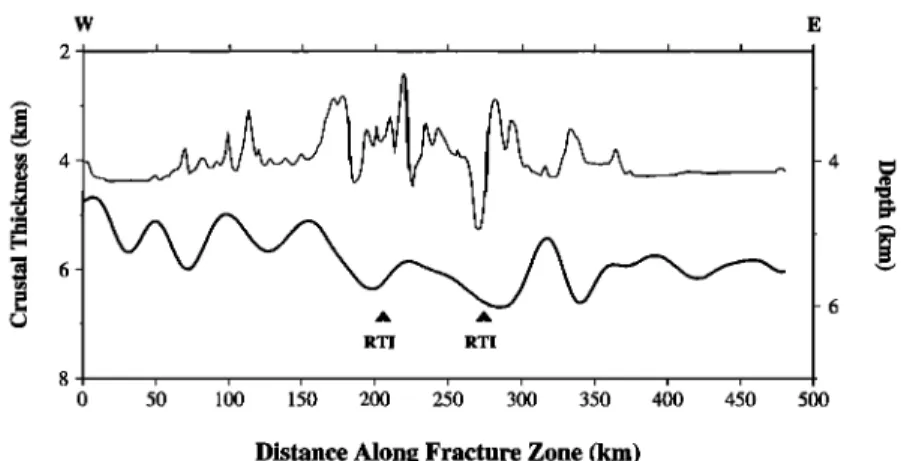
A striking feature of our result is the east-west asymmetry in
crustal thickness along the trace of the Atlantis Fracture Zone.
Crust east of the Atlantis Transform is, on average, 1 km thicker than crust west of it (Figure 5). Seismic refraction work has shown that crustal thickness along the Kane Fracture Zone
is also variable, with 2-to 3-km-thick crust observed along the eastern portion of the fracture zone, but 6-km-thick crust along
the eastern part of the transform [Cormier et al., 1984]. These
results suggest that transform faults are not necessarily magmatically starved during the process of crustal accretion and indicate that, while crustal thinning near and within
fracture zones is common, crust of normal thickness can also
be formed. In the case of the crust formed along the eastern portion of the Atlantis fracture zone, the normal crustal
thickness values (approximately 5-6 km) observed may be due
to an unusually robust magma supply at segment 1S. Our results indicate that the crustal thickness values computed for segment 1S are consistently higher than values from the other segments in our study area (Plate 1 and Figure 4). In addition, bathymetry data and computed crustal thickness values show that crustal production has consistently been higher on the east flank of segment 1S than on the west flank. The high
production of crust on the east flank of segment 1S may have
caused volcanic overprinting in the fracture zone valley, and resulted in high crustal thickness values.
In addition to asymmetry in computed crustal thickness values along the transform itself, there is a clear east-west asymmetry in thickness for crust produced at the two segments adjacent to the transform (Figure 4). Crustal thickness values
on the west flank of segment 1N are generally 0.5 - 1.0 km
higher than that on the east flank, and the crustal thickness
values on the east flank of segment 1S center are generally 0.5 - 1.0 km thicker than that of the west flank. This result suggests long-term across-axis asymmetry in crustal production or tectonism for the two segments adjacent to the
17,790 PARISO ET AL.: GRAVITY STUDY OF M•D-ATLAN'nC RIDGE W • 4 e• 6 RTI RTI 8 0 5'0 160 1•0 260 2•0 340 3•0 440 4•0 5OO
Distance Along Fracture Zone (km)
Figure 5. Cross sections of bathymetry (thin line) and computed crustal thickness (thick line) along the
Atlantis Fracture Zone. Note that the crust underlying the east side of the fracture zone is generally thicker than that underlying the west side.
transform fault. Using three-dimensional numerical modeling
techniques, Rabinowicz et al. [1993] showed that the presence
of a transform fault results in the generation of a toroidal flow field which can shift upwelling plumes away from the ridge crest. Such a mechanism could account for the high crustal production on the west flank of segment 1N and the east flank of segment 1S.
Temporal Variations in Crustal Structure
To examine the temporal variation in crustal structure along axis, we have plotted cross sections of bathymetry and computed crustal thickness along isochrons on both the east and west flanks of the ridge in our study area (Figures 6a and
6b). The isochrons were determined using crustal ages
interpolated from magnetic anomaly data (Figures 1 and 2,
Sernpdrd et a/.,1995). These plots show that there are up to 3.5 km of variation in crustal thickness on axis. If we exclude the
fracture zone, there are still 3 km of variation in crustal
thickness along axis between segment midpoints and
discontinuities. Examining crustal thickness cross sections along isochrons, it is clear that the most salient crustal thickness variations are consistently associated with the segment boundaries. For the southern segments (IS and 2S), the pattern of thin/thick crust associated with discontinuities/segment midpoints is very consistent out to 8
Ma. North of the Atlantis Transform, this correlation between
crustal thickness and position along the segment is only observed for crust which is < 3 Ma. For example, at present,
the four spreading segments north of the Atlantis Transform
are associated with four centers of thick crust. However,
starting at the 3 Ma isochron, the bathymetric highs which
represent paleosegment midpoints, and the bathymetric lows, which define paleosegment discontinuities, are not associated
with thick and thin crust, respectively. As we discussed earlier,
these results suggest that between approximately 3 and 8 Ma, individual segments north of the fracture zone were not
associated with focused mantle upwelling. This is likely related, or in response, to a reorganization of the plate boundary which took place between 10 and 4 Ma [Sernpdrd et
al., 1995].
We have identified the traces of the midpoints of
paleosegments using a combination of the midpoint between
the discontinuity traces, bathymetric highs on the flanks of
the MAR, and high values of calculated crustal thickness (Figure 2). The midpoint traces thus represent lines of maximum crustal thickness and the likely location of segment midpoints, or mantle upwelling centers, with time. Cross sections of crustal thickness along these midpoint traces
Axis 2 Ma 3 Ma 4Ma 6 Ma 8 Ma
S
West Flank
N
1S 2S 1N 2N 3N 4N i - 150 - 100 -50 0 50 100 150 -0 8 -0Distance From Fracture Zone (km)
Figure 6a. Cross sections of bathymetry (thin line) and computed crustal thickness (heavy line) along isochrons on the west flank of the MAR. The bathymetry scale is on the left and the computed crustal thickness scale is on the right. For the two segments south of the fracture zone, segment discontinuities are associated with thin crust for up to 8 Ma. North of the fracture zone, segmentation boundaries are poorly correlated with thin crust in lithosphere > 3 Ma.
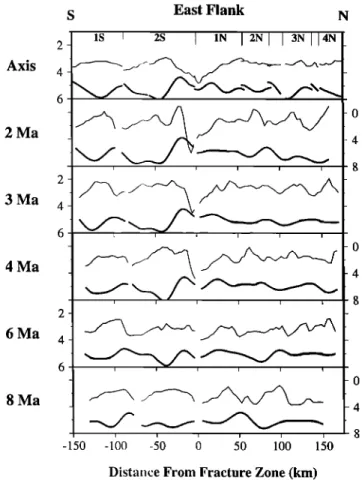
PARISO ET AL.: GRAVITY STUDY OF M•D-ATL•rHC RIDGE 17,791 Axis 2 Ma 3 Ma 4Ma 6Ma 8 Ma
S
East Flank
N
IS I 2S I IN I 2NI I 3Nil 4N _ -150 -100 -50 50 100 1 0 -0Distance From Fracture Zone (km)
Figure 6b. Cross sections of bathymetry (thin line) and
computed crustal thickness (heavy lines) along isochrons on
the east flank of the MAR in our survey area. The bathymetry
scale is on the left and the computed crustal thickness scale is on the right. For the two segments south of the fracture zone, segment discontinuities are associated with thin crust for up to 8 Ma. North of the fracture zone, segmentation boundaries are poorly correlated with thin crust in lithosphere > 3 Ma.
provide a measure of the temporal variation in crustal production for individual segments (Figure 4). The most notable features of the relationship between crustal thickness
and time are as follows: (1) profiles 2S, 2NW, and 3N suggest
gradual crustal thinning with age, (2) the cross sections of segments 2S, 2N, and 3N suggest that the crust near the axis is
at least 1 km thicker than the crust off-axis, and (3) there are up to 2 km of variation in crustal thickness at a timescale of 2-3 m.y. We will address the possible causes and implications of these features in this order.
Apparent decrease in crustal thickness values
with age. Profiles 2S, 2NW, and 3N extracted from grids along paleo midpoint traces exhibit gradual crustal thinning
with age. The same observation can be made for a similar analysis of the gravity field over the MAR between 33 ø N and
40 ø N [Detrick et al., 1995]. To investigate systematic crustal
thickness variations away from the axis of the MAR, we
derived the parameters of the best-fitting, linear relationship between calculated crustal thickness and distance from the axis. Since our calculated crustal thickness is largest near the axis for each profile, we also investigated the relationship between crustal thickness and distance from the axis excluding the near-axis region. When only the portions of the profiles corresponding to ages greater than 2 m.y. are considered,
apparent crustal thinning is observed on profiles 2SE, 1SE,
2NW, and 3NE. Since we did not account for the presence of
sediment in our Bouguer correction, it is possible that our computed crustal thickness values are in error in older crust.
However, significant sediment accumulation is only important within the bathymetric troughs of the discontinuity traces, not
along the relative bathymetric highs that characterize the
paleo midpoint traces. There are several other ways to explain these observations: variations in crustal production with time,
active thinning of crust by tectonic extension, or a crust or mantle density structure which is slightly different than that
used in our analyses. We examine in turn these possible mechanisms.
A possible source for the decrease in computed crustal
thickness values observed with age over some of the spreading segments in our study area is a gradual increase with time in the magmatic budget. Suet al. [1994] have shown that, at slow- spreading centers, crustal production may increase with decreasing spreading rate under certain conditions.
Interpretation of magnetic anomalies in our survey area show that the regional spreading rate has slowed from ~ 32 mm
10 Ma to ~ 24 mm yr -1 at present.
Because
apparent
crustal
thinning is not observed ubiquitously within our area, we argue that a regional decrease in melt production with time is not the
cause of our observation. However, we cannot discard local
variations in melt production as the cause of our observation. Another mechanism for gradual crustal thinning is tectonic extension and crustal denudation. For example, a simple calculation based on conservation of volume indicates that 25% extension (a moderate amount for the Mid-Atlantic Ridge;
[Karson and Winters, 1992]) would result in a decrease in crustal thickness of 1.2 km from our initial reference value. Surface observations over the MAR indicate that fault throw and fault density increase toward segment offsets, suggesting
that the brittle-ductile transition may be deeper near axial discontinuities [Sempdrd, 1991' Shaw, 1992; Sempdrd et al., 1993]. In addition, teleseismic activity along the MAR is predominantly located at the distal ends of segments [Lin and Bergman, 1991]. These results indicate that if crustal thinning occurs by tectonic extension, the largest degree of thinning should occur near segment discontinuities (also see Mutter and Karson, [1992]). However, examination of our computed crustal thickness variations (Plate 1 and Figure 4)shows that the largest decrease in crustal thickness with distance from the ridge takes place along paleo midpoint traces, and that little
crustal thinning occurs along the discontinuity traces.
Therefore, we suggest that although extension is an important process at the MAR, the apparent long-term decrease in crustal thickness along some of the midpoint traces of segments does not have a predominantly tectonic origin.
A possible cause for the observed decrease in computed crustal thickness values with age is an error in the parameters
used in our downward continuation. In this calculation, we used
a constant
mantle density of 3330 kg m -3. Since the
lithosphere cools with age, it is more reasonable to use a variable crust/mantle density contrast close to the axis where lateral temperature variations are likely to be the largest. Downward continuation to Moho level using a crust/mantle density contrast which increases away from the axis according to our passive flow model results in changes in crustal
thickness of the order of 100-200 m. Thus lateral density

![Figure 3c. The gravity signal at sea surface predicted from lithospheric cooling based on the passive flow model of Phipps Morgan and Forsyth [1988]](https://thumb-eu.123doks.com/thumbv2/123doknet/14800283.605883/8.916.176.739.106.606/figure-gravity-surface-predicted-lithospheric-cooling-passive-forsyth.webp)