HAL Id: hal-00296955
https://hal.archives-ouvertes.fr/hal-00296955
Submitted on 26 Sep 2006
HAL is a multi-disciplinary open access
archive for the deposit and dissemination of
sci-entific research documents, whether they are
pub-lished or not. The documents may come from
teaching and research institutions in France or
abroad, or from public or private research centers.
L’archive ouverte pluridisciplinaire HAL, est
destinée au dépôt et à la diffusion de documents
scientifiques de niveau recherche, publiés ou non,
émanant des établissements d’enseignement et de
recherche français ou étrangers, des laboratoires
publics ou privés.
Effects of grid size and aggregation on regional scale
landuse scenario calculations using SVAT schemes
H. Bormann
To cite this version:
H. Bormann. Effects of grid size and aggregation on regional scale landuse scenario calculations
using SVAT schemes. Advances in Geosciences, European Geosciences Union, 2006, 9, pp.45-52.
�hal-00296955�
www.adv-geosci.net/9/45/2006/
© Author(s) 2006. This work is licensed under a Creative Commons License.
Advances in
Geosciences
Effects of grid size and aggregation on regional scale landuse
scenario calculations using SVAT schemes
H. Bormann
University of Oldenburg, Department of Biology and Environmental Sciences, Germany
Received: 23 January 2006 – Revised: 22 May 2006 – Accepted: 3 July 2006 – Published: 26 September 2006
Abstract. This paper analyses the effect of spatial input data
resolution on the simulated effects of regional scale landuse scenarios using the TOPLATS model. A data set of 25 m
res-olution of the central German Dill catchment (693 km2)and
three different landuse scenarios are used for the investiga-tion. Landuse scenarios in this study are field size scenarios, and depending on a specific target field size (0.5 ha, 1.5 ha and 5.0 ha) landuse is determined by optimising economic outcome of agricultural used areas and forest. After an aggre-gation of digital elevation model, soil map, current landuse and landuse scenarios to 50 m, 75 m, 100 m, 150 m, 200 m, 300 m, 500 m, 1 km and 2 km, water balances and water flow components for a 20 years time period are calculated for the entire Dill catchment as well as for 3 subcatchments without any recalibration. Additionally water balances based on the three landuse scenarios as well as changes between current conditions and scenarios are calculated. The study reveals that both model performance measures (for current landuse) as well as water balances (for current landuse and landuse scenarios) almost remain constant for most of the aggrega-tion steps for all investigated catchments. Small deviaaggrega-tions are detected at the resolution of 50 m to 500 m, while sig-nificant differences occur at the resolution of 1 km and 2 km which can be explained by changes in the statistics of the input data. Calculating the scenario effects based on increas-ing grid sizes yields similar results. However, the change effects react more sensitive to data aggregation than simple water balance calculations. Increasing deviations between simulations based on small grid sizes and simulations using grid sizes of 300 m and more are observed. Summarizing, this study indicates that an aggregation of input data for the calculation of regional water balances using TOPLATS type models does not lead to significant errors up to a resolution of 500 m. Focusing on scenario effects the model is more Correspondence to: H. Bormann
sensitive to input data aggregation as aggregation effects of current data and scenarios partly sum up. The maximum rea-sonable grid size for scenario calculations decreases to 200– 300 m.
1 Introduction
The prediction of water fluxes in changing environments and under changing boundary conditions requires the use of dis-tributed and process-based models which have been vali-dated for different environmental conditions (e.g. climate, topography). Spatially distributed modelling of regional wa-ter fluxes and wawa-ter balances, again, requires different spa-tial data sets representing the landscape structure. At least information on topography, soils and vegetation is needed. Thereby the higher the resolution of these data is, the bet-ter the landscape is represented by the data base (Kuo et al., 1999). Spatial patterns can be represented in more detail and small scale fluxes can be considered by the models. As cli-mate change and environmental change are global problems, predictions are needed in many regions of the world with dif-fering data availability in both resolution and quality. A few studies have examined the effect of grid size of input data on catchment hydrological simulations such as Kuo et al. (1999, focusing on topography), Farajalla and Vieux (1995, soils) and Pelgrum (2000, vegetation). Thus, although it is well documented in the literature that data resolution can have a significant impact on simulation results, there are only a few integrative studies analysing all relevant data sets together (Bormann, 2006; Kuo et al., 1999), and obtained model re-sults often are compared and evaluated without taking data resolution into account. With respect to scenario analysis no studies were found analysing the effect of data resolution on scenario results. Therefore, this study elaborates in detail which effect data and model resolution can have on simu-lated water balances and scenario effects. Based on a detailed
46 H. Bormann: Effects of grid size on scenario calculations ; ; ; ; # # # # # # # # # # # # # # # # % [ % [ N ; # % [ Dill catchment river network climate stations rain gauges stream gauges catchment boundary 10 0 10 20 Kilometers Aar Dill upper Dill Dietzhölze
Fig. 1. Subcatchments (upper Dill, Dietzh¨olze, Aar), rain and stream gauges in the Dill catchment (693 km2)in central Germany.
spatial data set of the meso-scale Dill catchment in central Germany a systematic data aggregation (ten aggregation lev-els from 25 m to 2 km resolution) and subsequent model ap-plication using current landuse data, as well as three landuse scenarios is performed investigating the influence of data ag-gregation on model applicability in case of the TOPLATS model (Famiglietti and Wood, 1994). The study was moti-vated by the international initiative on Ensemble Model Pre-diction of the Effects of Landuse Change on Hydrology, or-ganised by the Working Group on Resources Management of the University of Gießen.
2 Material and methods
2.1 Study region
The Dill catchment (693 km2)belongs to the Lahn-Dill low
mountainous region in central Germany. It is the target catch-ment of the collaborative research centre SFB 299 (“Landuse options for peripheral regions”) of the University of Gießen (Germany) and represents a typical peripheral region dom-inated by extensive agriculture and forestry. Mean annual precipitation is between 700 mm to 1100 mm and is highly correlated to the elevation which ranges between 155 m and 674 m above sea level. Average annual mean temperature is
about 8◦C. The main soil types are cambisols, planosols and
gleysols. For the entire catchment a data set in 25 m reso-lution is available for topography (digital elevation model), soil types, current landuse and three landuse scenarios. Two weather stations are located in the catchment providing daily data on temperature, air humidity, wind speed and global
ra-diation. Stream flow is observed at four gauges, precipitation at 15 gauges (Fig. 1). All time series are available for a 20 years time period (1980–1999).
2.2 TOPLATS model
The TOPLATS model (TOPMODEL based atmosphere transfer scheme; Famiglietti and Wood, 1994; Peters-Lidard et al., 1997) is a multi-scale model to simulate local to re-gional scale catchment water and energy fluxes. It combines the local scale SVAT approach (soil vegetation atmosphere transfer scheme) to represent local scale vertical water fluxes with the catchment scale TOPMODEL approach (Beven et al., 1995) to laterally redistribute the water within a catch-ment. There is no lateral interaction between the local SVATs accounted for by the model. But based on the soils topo-graphic index of the TOPMODEL approach a lateral redistri-bution of water is realized by adaptation of the local ground-water levels which are used as lower boundary conditions of the local SVATs. Main process descriptions of TOPLATS are summarized in Table 1. In order to reduce the calibration to a minimum, parameterisation of the TOPLATS model was carried out by deriving as many parameters as possible from standard data bases. Soil parameters were derived using the pedotransfer function of Rawls and Brakensiek (1985). To-pographic parameters were calculated directly from the dig-ital elevation model and plant parameters were taken from the PlaPaDa data base (Breuer et al., 2003). Hence, the cal-ibration was reduced to adjusting stomatal resistances by a constant factor to meet the long-term water balance and to the adaptation of the parameters of the base flow recession curve.
Table 1. Hydrological processes and process descriptions within the TOPLATS model.
Model part Process Approach
Local SVATs Interception Storage approach: storage capacity is proportional to leaf area index
Actual
evapotranspiration
Reduction of potential Penman-Monteith evapotranspiration by soil moisture status
Infiltration Infiltration capacity depending on soil properties and soil water status (Milly, 1986)
Infiltration excess runoff Rainfall rate minus infiltration capacity Saturation excess runoff Contributing areas derived from TOPMODEL
Percolation Gravity driven drainage
Capillary rise Capillary rise from water table: Gardner (1958)
Lower boundary Top of capillary fringe
TOPMODEL Water tables Soils-topographic index
Base flow Exponential decay function
Table 2. Areal proportions of landuse classes of current landuse and three different landuse scenarios in the Dill catchment provided by
ProLand (values for water and urban areas remain constant).
Landuse data set Forest Pasture Crops Fallow Water Urban
Current landuse 54.4% 20.5% 6.5% 9.1% 0.3% 9.2%
Scenario: 0.5 ha 56.0% 31.8% 2.7% – 0.3% 9.2%
Scenario: 1.5 ha 45.9% 17.5% 27.1% – 0.3% 9.2%
Scenario: 5.0 ha 34.0% 20.6% 35.9% – 0.3% 9.2%
2.3 Landuse scenarios
The landuse scenarios investigated in this project are so called field size scenarios. The average field size in the Dill catchment is currently smaller than 1 ha. This is mainly a result of the traditional inheritance system where land is split between all children. This heritage system and the geomor-phologic boundary conditions of the area led to the charac-teristic heterogeneous landscape pattern. The existing land tenure and the small field sizes currently do not support full-time farmers. Part full-time farms with high machinery cost are common in the catchment. As result of the small acreages and the high machinery costs, farmers do not use any large machines. One way of increasing the farm income and sup-porting the utilization of larger machineries is field aggrega-tion by land consolidaaggrega-tion. This may lead to a change in pro-duction systems, resulting in a landuse distribution which is different compared to current situation (Weber et al., 2001).
Landuse scenarios were developed using the “ProLand model” (Fohrer et al., 2002) and provided by the Work-ing Group on Resources Management of the University of Gießen. ProLand is an agro-economical model that predicts optimal production systems, such as intensive or extensive rangeland, suckler cow production, dairy, cropland, or for-est, for a given location. It accounts for different natural,
technical, economic and political premises and assumes that farmers act to optimize their land rent. The field size scenar-ios were provided by ProLand assuming different boundary conditions for farming practices, for example different field size allocations. ProLand predicts economic variables and provides spatially explicit landuse maps. These maps serve as input for the scenario analysis. ProLand differentiates be-tween several pasture and crop production systems, as well as mixed forest. Based on different target field sizes of 0.5, 1.5 and 5.0 hectares, three different landuse maps are provided in 25 m resolution which can be used for scenario analysis. Statistics of landuse scenarios compared to the current con-ditions are given by Table 2.
2.4 Data aggregation
The available grids of soil types, topography, landuse and landuse scenarios (25 m resolution) were systematically ag-gregated stepwise to create grid-based data sets of increasing grid size (50 m, 75 m, 100 m, 150 m, 200 m, 300 m, 500 m, 1 km, 2 km). The aggregation of the digital elevation model was carried out by calculating the simple averages of the pix-els to be aggregated. Concerning soils and landuse, the data sets were aggregated with respect to the majority of the pix-els to be aggregated. The most frequent value was allocated
48 H. Bormann: Effects of grid size on scenario calculations 0 20 40 60 80 100 120
Jan-83 Jan-85 Jan-87 Jan-89 Jan-91 Jan-93 Jan-95 Jan-97 Jan-99
M e a n w e e k ly s tr e a m f lo w [ m ³/ s ] observed simulated
Fig. 2. Comparison of observed versus simulated stream flow of the
Dill catchment in weekly resolution.
to the aggregated pixel. If there was no unambiguous major-ity the surrounding pixels were included into the allocation procedure (Bormann, 2006).
3 Grid size dependent model results
For the current landuse conditions, TOPLATS was calibrated for the whole Dill catchment using the data of the years 1983–1989, validation period was 1990–1999, and the years 1980–1982 were used as a spin up period. The accuracy of the simulation (Fig. 2) is satisfactory considering that TOPLATS was calibrated only with minimum effort. Qual-ity measures for the validation period are only slightly worse than for the calibration period. While for daily discharges the model efficiency (Nash and Suttcliffe, 1970) is of mod-erate quality (0.65 for calibration, 0.61 for validation), the model efficiencies and coefficients of determination increase for longer time intervals (weeks, months) to values greater than 0.8. The mean deviation in annual discharge between observations and simulations is about ±5.9% for the calibra-tion and ±12.0% for the validacalibra-tion period.
For the simulation of the three subcatchments a recalibra-tion was carried only for the maximum baseflow parameter (“baseflow at basin saturation”). The simulation results for
the Dietzh¨olze (81 km2)and on the upper Dill (63 km2)are
quite good while the results for the Aar catchment (134 km2)
are of a moderate quality. Model efficiencies for daily dis-charges range from 0.59 (Aar) to 0.73 (upper Dill, Diezh¨olze) for the calibration period, and from 0.52 (Aar) to 0.69 (up-per Dill, Diezh¨olze) for the validation (up-period. They increase with increasing time intervals to values of 0.76–0.85 (weeks) and 0.82–0.90 (months).
In order to analyse the effect of input data resolution on simulation results for all grid sizes derived from the orig-inal data sets (10 grids ranging from 25 m to 2 km resolu-tion), continuous water balance simulations for 20 years were performed. Exemplary results of the grid size dependent to-tal stream flows (sums of simulated surface runoff and base
250 300 350 400 450 500 550 600 650 10 100 1000 10000 Grid size [m] S tr e a m f lo w [ m m /a ]
Up. Dill cal. Up. Dill val. Diet. cal. Diet. val. Aar cal. Aar val. Dill cal. Dill val.
Fig. 3. Dependence of total stream flow (surface runoff + base flow)
on grid sizes for the Dill basin and its three subcatchments (Up. Dill = Upper Dill, Diet. = Dietzh¨olze). Calibration and validation peri-ods (cal., val.) are analysed separately.
0.4 0.45 0.5 0.55 0.6 0.65 0.7 0.75 10 100 1000 10000 Grid size [m] M o d e l e ff ic ie n c y [ -]
Up. Dill cal. Up. Dill val. Diet. cal. Diet. val. Aar cal. Aar val. Dill cal. Dill val.
Fig. 4. Dependence of model efficiencies on grid sizes for the Dill
basin and its three subcatchments (Up. Dill = Upper Dill, Diet. = Dietzh¨olze). Calibration and validation periods (cal., val.) are anal-ysed separately.
flow) are shown in Fig. 3. Up to a grid size of 500 m the simulated water fluxes remain almost constant except slight differences at the grid size of 100 m, which can be explained by differences in landuse composition at the 100 m aggrega-tion level (Bormann, 2006). At a grid size of 500 m the dif-ferences slightly increase, and from 1 km grid size onwards the simulation results get significantly different. Differences with respect to simulations based on high resolutions in-crease. The same systematics of these results can be found for all main simulated water fluxes (evapotranspiration, sur-face runoff, base flow, stream flow) in all investigated catch-ments, and results are also similar for the calibration and the validation period.
A very similar structure of results also shows the analysis concerning the dependence of the model efficiencies on grid size (Fig. 4). As expected from the simulated water balances they remain constant up to an aggregation level of 300 m to 500 m grid size. Model efficiencies for the 1 km and the 2 km
(a)
(b)
(c)
(d)
(e)
(f)
200 300 400 500 600 10 100 1000 10000 Grid size [m] S tr e a m f lo w [ m m /a ] Dill up. Dill Dietz Aar 550 600 650 700 750 10 100 1000 10000 Grid size [m] E T A [ m m /a ] Dill up. Dill Dietz Aar 200 300 400 500 600 10 100 1000 10000 Grid size [m] S tr e a m f lo w [ m m /a ] Dill up. Dill Dietz Aar 450 500 550 600 650 10 100 1000 10000 Grid size [m] E T A [ m m /a ] Dill up. Dill Dietz Aar 150 200 250 300 350 400 450 10 100 1000 10000 Grid size [m] S tr e a m f lo w [ m m /a ] Dill up. Dill Dietz Aar 550 600 650 700 750 10 100 1000 10000 Grid size [m] E T A [ m m /a ] Dill up. Dill Dietz AarFig. 5. Dependence of simulated water balances on grid size for scenarios for the Dill catchment – scenarios with target field size of 0.5 ha (a), 1.5 ha (b) and 5.0 ha (c); ETA = actual evapotranspiration.
grids are significantly lower. For these grid sizes a significant and systematic decrease of the quality measures (model effi-ciency, coefficient of determination) is observed. A detailed analysis of the dependence of simulation results and model quality measures on grid size, as well as on correlations to input data is given by Bormann (2006).
Analysing the simulated water balances of three landuse scenarios available for the Dill catchment, the same system-atics of the effect of aggregation on simulated water fluxes is observed (Fig. 5). For the Dill catchment as a whole and for all investigated subcatchments the annual water fluxes re-main almost constant up to a grid size of 300 m except the simulated actual evapotranspiration of the 1.5 ha (target field
size of 1.5 ha) scenario for the Dietzh¨olze (Fig. 5b) which shows a clear deviation at the 300 m level. As observed for the current landuse, slight deviations occur at the 100 m level due to aggregation of landuse data, slight deviations also oc-cur at the 500 m level and significant deviations are observed for 1 km and 2 km grid sizes. While the deviation of the sim-ulation results based on large grid cells compared to small grid sizes can be positive or negative, the absolute values of the deviations are high for all investigated water flows (50– 100 mm/a) and especially for the subcatchments.
50 H. Bormann: Effects of grid size on scenario calculations
(a)
(b)
(c)
(d)
(e)
(f)
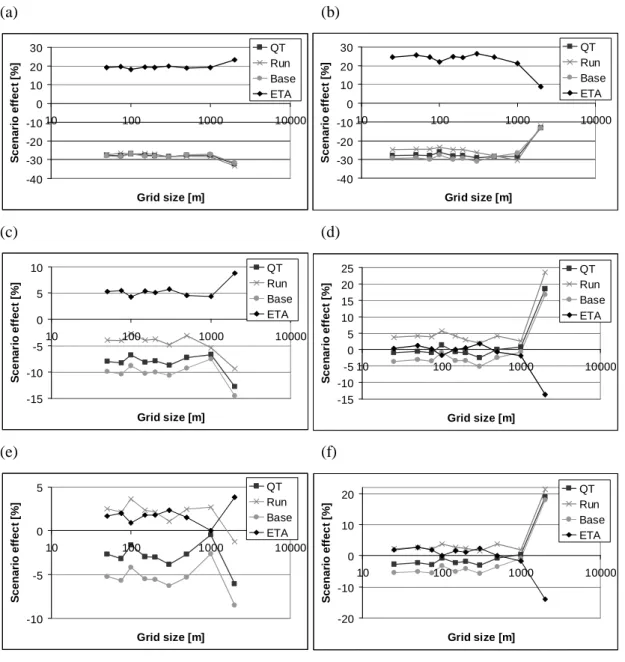
-10 -5 0 5 10 100 1000 10000 Grid size [m] S c e n a ri o e ff e c t [% ] QT Run Base ETA -20 -10 0 10 20 10 100 1000 10000 Grid size [m] S c e n a ri o e ff e c t [% ] QT Run Base ETA -15 -10 -5 0 5 10 10 100 1000 10000 Grid size [m] S c e n a ri o e ff e c t [% ] QT Run Base ETA -15 -10 -5 0 5 10 15 20 25 10 100 1000 10000 Grid size [m] S c e n a ri o e ff e c t [% ] QT Run Base ETA -40 -30 -20 -10 0 10 20 30 10 100 1000 10000 Grid size [m] S c e n a ri o e ff e c t [% ] QT Run Base ETA -40 -30 -20 -10 0 10 20 30 10 100 1000 10000 Grid size [m] S c e n a ri o e ff e c t [% ] QT Run Base ETAFig. 6. Dependence of relative scenario effects (= ((current – scenario)/current)) on grid size for the Dill catchment (a, b, c) and the upper
Dill subcatchment (d, e, f): scenarios with target field sizes of 0.5 ha (a, d), 1.5 ha (b, e) and 5.0 ha (c, f); QT = stream flow, Run = surface runoff, Base = base flow, ETA = actual evapotranspiration.
4 Grid size dependent scenario effects
Focusing on the differences between simulation results based on current landuse conditions and the simulations based on the three different landuse scenarios provided by ProLand (Table 2), a partly different picture is obtained as relative changes of the fluxes due to data aggregation are focused on. The definition of the scenario effects with respect to the wa-ter flows (e.g. evapotranspiration, surface runoff, base flow, stream flow) is given by:
scenario effect =current-scenario
current (1)
where scenario = simulated water flow [mm/a] based on lan-duse scenario at a distinct grid size, and current = simulated water flow [mm/a] based on current landuse at the same grid size.
Different effects are identified for the scenarios. While the 0.5 ha scenario (target field size of 0.5 ha) reacts relatively ro-bust on increasing grid size (Figs. 6a, d, 7a, and d), the 1.5 ha and the 5.0 ha scenarios (target field size of 1.5 ha and 5.0 ha, respectively) show higher sensitivities to aggregation of input data grids. The robust behaviour of the 0.5 ha scenario can be explained by the considerable changes in water flows in-duced by the scenario. Changes in the annual water flows by
(a)
(b)
(c)
(d)
(e)
(f)
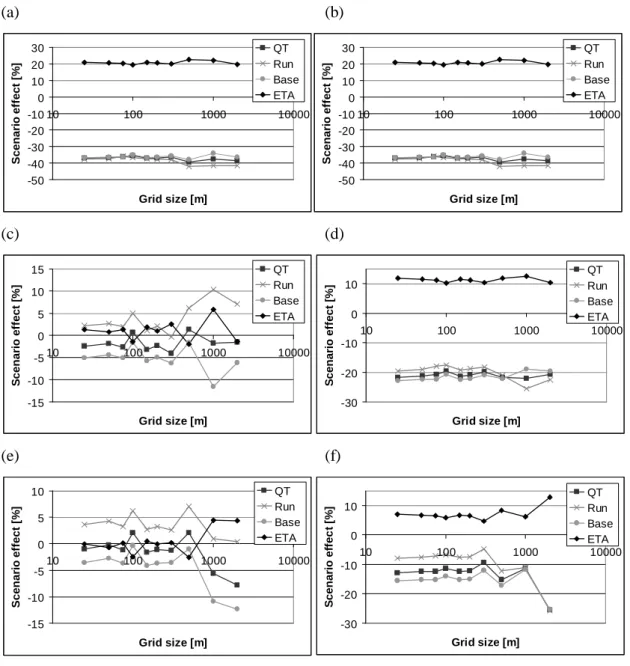
-15 -10 -5 0 5 10 10 100 1000 10000 Grid size [m] S c e n a ri o e ff e c t [% ] QT Run Base ETA -30 -20 -10 0 10 10 100 1000 10000 Grid size [m] S c e n a ri o e ff e c t [% ] QT Run Base ETA -15 -10 -5 0 5 10 15 10 100 1000 10000 Grid size [m] S c e n a ri o e ff e c t [% ] QT Run Base ETA -30 -20 -10 0 10 10 100 1000 10000 Grid size [m] S c e n a ri o e ff e c t [% ] QT Run Base ETA -50 -40 -30 -20 -10 0 10 20 30 10 100 1000 10000 Grid size [m] S c e n a ri o e ff e c t [% ] QT Run Base ETA -50 -40 -30 -20 -10 0 10 20 30 10 100 1000 10000 Grid size [m] S c e n a ri o e ff e c t [% ] QT Run Base ETAFig. 7. Dependence of relative scenario effects (= ((current – scenario)/current)) on grid size for the Dietzh¨olze (a, b, c) and the Aar
subcatchment (d, e, f): scenarios with target field sizes of 0.5 ha (a, d), 1.5 ha (b, e) and 5.0 ha (c, f); QT = stream flow, Run = surface runoff, Base = base flow, ETA = actual evapotranspiration.
±20–30% mask differences between the aggregation levels
in the order of a few percent. This is in contrast to the 1.5 ha and 5.0 ha scenarios which cause changes in annual water flows of about ±5% except for the Aar subcatchment. Hence uncertainties due to aggregation in the order of a few percent can have a significant impact in simulated scenario effects. This leads to the problem that differences caused by aggre-gation can lead to a change in the magnitude of the scenario effect (e.g. for the Dill and the Aar rivers, Figs. 6c, 7f) as well as even lead to a change in the direction of change caused by landuse scenarios (e.g. for the Dietzh¨olze river compared to current situation, Figs. 7b, c). Nevertheless, although the
sensitivity of scenario effects on aggregation seems to be higher then the sensitivity of water balances, the effects of aggregation on scenario results are similar for smaller grid sizes (between 25 m and 200 m except the 100 m level). For increased grid sizes significant deviations can be expected.
5 Conclusions
This study indicates that an aggregation of spatial input data for the calculation of regional water balances us-ing TOPLATS type models does not lead to significant
52 H. Bormann: Effects of grid size on scenario calculations deviations in simulation results data up to a grid size of
300 m. Between a grid size of 300 m and 500 m a slight to partly significant information loss leads to affected simula-tion results. Applying the model on a grid size of 1 km and more causes significant errors in the computed water balance. Changes in scenario effects react more sensitive to aggre-gation of data than the simulated water balance terms. Up to a grid size of 200 m the deviations compared to the smallest grid sizes remain small except aggregation levels where ag-gregation changed the statistics of landuse composition sig-nificantly. The increased sensitivity of simulated scenario ef-fects compared to the water balance terms can have two rea-sons. It firstly can be explained by the partly limited magni-tude of scenario effects compared to the uncertainty induced by the aggregation process. Secondly aggregation effects in current state data and scenario data sets add up and therefore intensify model sensitivity.
Thus due to the existence of model sensitivity to data res-olution, scenario studies in general should be carried out in combination with uncertainty studies. Focusing on scenario effects, the magnitude of the simulated changes, which de-pends on the flow process accounted for, should be set in relation to the sensitivity of the model due to model and data resolution. This can be accomplished for example by per-forming a comprehensive uncertainty analysis and analysing the signal-to-noise ratio between scenario effects and model uncertainty suggested by Bormann (2005).
Acknowledgements. The author thanks the Deutsche
Forschungs-gemeinschaft for funding the collaborative research centre SFB 299 on “landuse options for peripheral regions” and the organisers of the Freudenstadt-Workshop on “Großskalige Modellierung in
der Hydrologie” for the excellent organisation.
Edited by: R. Barthel, J. G¨otzinger, G. Hartmann, J. Jagelke, V. Rojanschi, and J. Wolf
Reviewed by: anonymous referees
References
Beven, K. J., Lamb, R., Quinn, P. F., Romanowicz, R., and Freer, J.: TOPMODEL, in: Computer Models of Watershed Hydrology, edited by: Singh, V. P., Water Resources Publications, 627-668, 1995.
Bormann, H.: Impact of spatial data resolution on simulated catch-ment water balances and model performance of the multi-scale TOPLATS model, Hydrol. Earth Syst. Sci., 10, 165–179, 2006, http://www.hydrol-earth-syst-sci.net/10/165/2006/.
Bormann, H.: Evaluation of hydrological models for scenario anal-yses: Signal-to-noise-ratio between scenario effects and model uncertainty. Adv. Geosci., 5, 43–48, 2005,
http://www.adv-geosci.net/5/43/2005/.
Breuer, L., Eckhardt, K., and Frede, H.-G.: Plant parameter values for models in temperate climates, Ecol. Model., 169, 237–293, 2003.
Famiglietti, J. S. and Wood, E. F.: Multiscale modelling of spatially variable water and energy balance processes, Water Resour. Res., 30(11), 3061–3078, 1994.
Farajalla, N. and Vieux, B.: Capturing the essential variability in distributed hydrological modeling: infiltration parameters, Hy-drol. Process. 9, 55–68, 1995.
Fohrer, N., M¨oller, D., and Steiner, N.: An interdisciplinary mod-elling approach to evaluate the effects of landuse change, Phys. Chem. Earth, 27, 655–662, 2002.
Gardner, W. R.: Some steady-state solutions of the unsaturated moisture flow equation with application to evaporation from a water table, Soil Sci., 85, 228–239, 1958.
Kuo, W.-L., Steenhuis, T. S., McCulloch, C. E., Mohler, C. L., We-instein, D. A., DeGloria, S. D., and Swaney, D. P.: Effect of grid size on runoff and soil moisture for a variable-source-area hydrology model, Water Resour. Res. 35(11), 3419–3428, 1999. Milly, P. C. D.: An event based simulation model of moisture and energy fluxes at a bare soil surface, Water Resour. Res., 22, 1680–1692, 1986.
Nash, J. E. and Suttcliffe, J. V.: River flow forecasting through con-ceptual models, Part I. A discussion of principles, J. Hydrol., 10(3), 282–290, 1970.
Pelgrum, H.: Spatial aggregation of land surface characteristics: impact of resolution of remote sensing data on land surface mod-elling, Dissertation, Wageningen, 151p., 2000.
Peters-Lidard, C .D., Zion, M. S., and Wood, E. F.: A soil-vegetation-atmosphere transfer scheme for modeling spatially variable water and energy balance processes, J. Geophys. Res., 102(D4), 4303–4324, 1997.
Rawls, W. J. and Brakensiek, D. L.: Prediction of soil water prop-erties for hydrological modelling, in: Proceedings of the sympo-sium watershed management in the eighties, edited by: Jones, E. and Ward, T. J., Denver, 293–299, 1985.
Weber, A., Fohrer, N., and M¨oller, D.: Long-term landuse changes in a mesoscale watershed due to socioeconomic factors – effects on landscape and functions, Ecol. Model., 140, 125–140, 2001.