HAL Id: hal-01148218
https://hal.archives-ouvertes.fr/hal-01148218
Submitted on 24 Oct 2016
HAL is a multi-disciplinary open access
archive for the deposit and dissemination of
sci-entific research documents, whether they are
pub-lished or not. The documents may come from
teaching and research institutions in France or
abroad, or from public or private research centers.
L’archive ouverte pluridisciplinaire HAL, est
destinée au dépôt et à la diffusion de documents
scientifiques de niveau recherche, publiés ou non,
émanant des établissements d’enseignement et de
recherche français ou étrangers, des laboratoires
publics ou privés.
deformation, and variations of magma withdrawal
Laurent Michon, Frédérick Massin, Vincent Famin, Valérie Ferrazzini,
Geneviève Roult
To cite this version:
Laurent Michon, Frédérick Massin, Vincent Famin, Valérie Ferrazzini, Geneviève Roult. Basaltic
calderas: Collapse dynamics, edifice deformation, and variations of magma withdrawal. Journal
of Geophysical Research : Solid Earth, American Geophysical Union, 2011, 116 (B3), pp.B03209.
�10.1029/2010JB007636�. �hal-01148218�
Basaltic calderas: Collapse dynamics, edifice deformation,
and variations of magma withdrawal
Laurent Michon,
1,2,3Frédérick Massin,
2,3,4Vincent Famin,
1,2,3Valérie Ferrazzini,
2,3,4and Geneviève Roult
3,5Received 14 April 2010; revised 29 November 2010; accepted 4 January 2011; published 31 March 2011.
[1]
The incremental caldera collapses of Fernandina (1968), Miyakejima (2000), and Piton
de la Fournaise (2007) are analyzed in order to understand the collapse dynamics in basaltic
setting and the associated edifice deformation. For each caldera, the collapse dynamics is
assessed through the evolution of the (1) time interval T between two successive collapse
increments, (2) amount of vertical displacement during each collapse increment, and (3)
magma outflow rate during the whole collapse caldera process. We show from the evolution
of T that Piton de la Fournaise and Fernandina were characterized by a similar collapse
dynamics, despite large differences in the caldera geometry and the duration of the whole
collapse caldera process. This evolution significantly differs from that of Miyakejima where
T strongly fluctuated throughout the whole collapse process. Quantification of the piston
vertical displacements enables us to determine the magma outflow rates between each
collapse increment. Displacement data (tiltmeter and/or GPS) for Piton de la Fournaise and
Miyakejima are used to constrain the edifice overall deformation and the edifice deformation
rates. These data reveal that both volcanoes experienced edifice inflation once the piston
collapsed into the magma chamber. Such a deformation, which lasts during the first collapse
increments only, is interpreted as the result of larger volume of piston intruded in the magma
chamber than magma withdrawn before each collapse increment. Once the effect of the
collapsing rock column vanishes, edifice deflates. We also determine for each caldera the
critical amount of magma evacuated before collapse initiation and compare it to analog
models. The significant differences between models and nature are explained by the
occurrence of preexisting weak zones in nature, i.e., the ring faults, that are not taken into
account in analog models. Finally, we show that T at Piton de la Fournaise and Fernandina
was equally controlled by the frictional resistance along the ring faults and the magma
outflow rate. In addition to these two parameters, the collapse dynamics of Miyakejima was
also influenced by variations of the magma bulk modulus, which changed after the influx of
deep gas‐rich magma into the collapse‐related magma chamber. Altogether, our results
show that the dynamics of caldera collapse in basaltic volcanoes proceeds in two phases:
Phase 1, starting with the first collapse, is characterized by the largest collapse amplitude, an
incremental edifice inflation, and a step‐by‐step increase of the rate of magma outflow.
Phase 2 shows a rapid decrease of the magma discharge rate to a low level concomitant with
the continuous edifice deflation. If deep magma is injected into the magma chamber, as at
Miyakejima, an additional phase occurs (phase 3).
Citation: Michon, L., F. Massin, V. Famin, V. Ferrazzini, and G. Roult (2011), Basaltic calderas: Collapse dynamics, edifice deformation, and variations of magma withdrawal, J. Geophys. Res., 116, B03209, doi:10.1029/2010JB007636.
1. Introduction
[2] One of the most striking features recorded during the
recent formation of calderas at Fernandina (Galapagos, 1968), Miyakejima (Japan, 2000) and Piton de la Fournaise (La Réunion, 2007) is the incremental collapse of the rock column into the magma chamber [Simkin and Howard, 1970; Kumagai et al., 2001; Michon et al., 2007]. The mechanics of collapse is usually explained in terms of recurrent stress increase along the ring faults until failure of the country rocks [Simkin and Howard, 1970; Kobayashi et al., 2003]. 1Laboratoire GéoSciences Réunion, Université de la Réunion, Saint
Denis, France.
2Institut de Physique du Globe de Paris, Sorbonne Paris Cité, Paris,
France.
3UMR 7154, CNRS, Paris, France.
4Observatoire Volcanologique du Piton de la Fournaise, La Plaine des
Cafres, France.
5Seismology Department, Institut de Physique du Globe de Paris,
Sorbonne Paris Cité, Paris, France.
Copyright 2011 by the American Geophysical Union. 0148‐0227/11/2010JB007636
JOURNAL OF GEOPHYSICAL RESEARCH, VOL. 116, B03209,doi:10.1029/2010JB007636, 2011
In basaltic setting, the time interval T between two succes-sive collapse increments and the total duration of the whole collapse caldera process are key parameters that reveal the collapse dynamics [Stix and Kobayashi, 2008]. However, these parameters are significantly different from one caldera to another, and hence do not allow a direct comparison of the processes involved in each caldera formation. For instance, the total duration of the whole collapse caldera process varied from about 2 days at Piton de la Fournaise to 40 days at Miyakejima, without any correlation with the final volume of the caldera (Table 1) [Kumagai et al., 2001; Geshi et al., 2002; Michon et al., 2007]. In addition, T grad-ually decreased at Piton de la Fournaise [Michon et al., 2007; Staudacher et al., 2009], remained constant then decreased at Fernandina [Filson et al., 1973; Stix and Kobayashi, 2008], or fluctuated then increased at Miyakejima [Ukawa et al., 2000; Stix and Kobayashi, 2008]. What is the common mechanics of caldera collapse behind the wide range of time scales observed?
[3] According to Kumagai et al. [2001], T may be
ex-pressed as a function of the frictional resistance along the ring faults (which is the subtraction of the static friction force FSand the dynamic friction force FD), the magma bulk
modulus !, the magma outflow ratea, the magma chamber volume V0 and the cross‐sectional area at the base of the
piston‐like subsiding rock column S:
T ¼2V0ðF!"SS" FDÞ ð1Þ
Based on Fernandina and Miyakejima calderas, FS− FDand
! have been considered of primary importance [Simkin and Howard, 1970; Filson et al., 1973; Kobayashi et al., 2003; Stix and Kobayashi, 2008] whereas variations in other para-meters seemed to have little influence on the caldera collapse dynamics in basaltic setting [Stix and Kobayashi, 2008].
[4] The first goal of this paper is to re‐investigate the role
of the above parameters (a, V0, FS − FD and !) in the
evolution of T, taking advantage of the extensive database collected during the recent formation of Piton de la Four-naise caldera. This collapse was the first for which the link between the magma withdrawal and the collapse dynamics could be demonstrated. Indeed, the emission rate determined from direct observations and MODIS data [Staudacher et al., 2009; Coppola et al., 2009] was found to be temporally correlated with the incremental collapses of the rock column into the magma chamber. This suggests that the emission
rate is proportional to the magma discharge rate from the reservoir [Michon et al., 2007].
[5] A second important issue is the causal relationship
between the collapsing column and the eruption/intrusion dynamics. Does the subsiding caldera block push the magma out of the magma chamber? Or does the collapse occur by magma underpressure in the reservoir? These questions have already been addressed in the case of silicic calderas [Druitt and Sparks, 1984; Martí et al., 2000; Folch et al., 2001; Roche and Druitt, 2001], yet whether the pro-posed explanations hold for basaltic calderas remains un-verified. The pressure evolution in the magma chamber after each collapse increment may be expressed using the follow-ing relationship [Kumagai et al., 2001]:
p1¼ p0þ p " p′t ð2Þ
p0and p1are the pressure in the magma chamber before and
after a given collapse increment, respectively, p is the pres-sure increase due to the intrusion of the caldera block into the magma chamber, p′ is the pressure decrease due to magma outflow and t is the time between two collapse increments, i.e., T. Pressures p and p′ are given by
p ¼ !Sz=V0and p′ ¼ !"=V0 ð3Þ
where Sz is the volume of a caldera block intruded into the magma chamber, z corresponding to the vertical displace-ment during a given collapse incredisplace-ment. a is the rate of magma withdrawal from the magma chamber.
[6] According to equations (2) and (3), the condition for
the magma to be pushed out of the magma chamber by a caldera collapse is that Sz be larger than the volume of magmaat withdrawn from the magma chamber before the collapse. This condition may be tested in the light of the 2007 collapse of Piton de la Fournaise caldera.
[7] To explore the different issues described above, we
studied in detail the timing of caldera collapse relative to magma outflows, and correlated it to the deformation of the edifices during the collapse event. Using tiltmeter and/ or seismic data recorded during each caldera collapse, we show that Piton de la Fournaise and Fernandina had strik-ingly similar collapse dynamics despite their scale differ-ences, and that Miyakejima involved additional processes. Our study provides quantitative constraints on the relation-ship between the caldera dynamics, the edifice deformation Table 1. Main Characteristics of the Three Most Recent Basaltic Collapse Calderas
Duration of the Whole Collapse
Caldera Process Number of CollapseIncrements Size (kmCaldera2) Volume (kmCaldera 3) MaximumDepth (m) (Chamber Depth/Piston Diameter)Roof Aspect Ratio
Piton de la Fournaise ∼2 days 44 0.7 0.096a 320–340b 3.8
Miyakejima ∼40 days 46c 2.3 0.6c ∼450c 5.7
Fernandina ∼12 days ∼75d 7–8d,e 1–2d,e 300–350d,e 0.3e aUrai et al. [2007].
bMichon et al. [2007]. cGeshi et al. [2002]. dFilson et al. [1973]. eSimkin and Howard [1970].
and the variations of the rate of magma withdrawal in basaltic setting.
2. Chronology of Caldera Formation and Related
Seismicity
2.1. Piton de la Fournaise
[8] At Piton de la Fournaise, the eruption leading to
cal-dera collapse initiated on 30 March 2007 with a dike injection yielding a short eruption 1 km east of the central cone. After an eruptive lull of 3 days, magma emission resumed on 2 April at a new eruptive fissure located 7 km east of the summit. The gap of eruptive activity contrasts with the continuous volcano‐tectonic seismicity that devel-oped below the summit of the edifice from 30 March and increased until 0200 GMT 5 April. On 1200 GMT 5 April the volcano experienced an increasing centripetal deflation until the first collapse at 2048 GMT. As pointed out by Michon et al. [2007], this event and the next six ones were followed by an increase of the tremor at the eruption site, suggesting a direct effect of the collapsing block on the magma chamber. Seismic and tiltmeter data showed the development of 44 collapse increments until 0009 GMT 8 April, the amplitude of which first slightly increased after the first largest event, then exponentially decreased to a minimum on 2233 GMT 6 April (Figure 1a). The collapse amplitude finally increased a bit until the last collapse. The time interval between the collapse increments varied from several hours to 30 min. The maximum tremor value recorded on 1200 GMT 6 April corresponds to a peak of magma emission, of at least 200 m3s−1, which progressively
decreased until 0100 GMT 7 April [Michon et al., 2007; Staudacher et al., 2009]. The caldera collapse stopped on 8 April whereas the eruption continued at low level until 1 May. At the end of the event in May 2007, the summit caldera had a 0.7 km2 surface, a maximum depth of 320–
340 m and a total volume 96 × 10−3km3(Table 1) [Michon
et al., 2007; Urai et al., 2007]. Based upon an average piston diameter of 520 m and a magma chamber depth of about 2000 m [Peltier et al., 2008], the roof aspect ratio (depth of the chamber roof dividing by its diameter) was 3.8. 2.2. Fernandina
[9] Due to its location in an uninhabited area and the very
scarce monitoring network, limited to seismometers, the formation of the summit caldera at Fernandina is much less constrained than the two other natural cases. According to Simkin and Howard [1970], the volcanic activity started with a lateral eruption on 21 May 1968, the duration of which is not constrained due to a lack of later observations. Between 2 and 7 June, seismometers located at 140 km of Fernandina and in South and North Americas recorded an increasing amount of earthquakes until a probable volcanic explosion monitored by infrasonic stations [Filson et al., 1973]. On 11 June, the dynamics of Fernandina changed drastically with the development of large summit phreatic then phreatomagmatic eruptions. Eruptions stopped on 12 June whereas the seismic activity increased throughout the day until a large earthquake (Ms= 5.1), which was interpreted as
resulting from the first collapse of the roof of the magma chamber [Simkin and Howard, 1970; Filson et al., 1973].
The subsequent seismicity was characterized by large events (Ms ≥ 5) until 14 June. According to Simkin and Howard
[1970], the regular time interval of 6 h observed until 14 June dropped to 3 h on 15 June, to 2 h on 17 June and to 60–90 min on 19 June. The end of the swarm was charac-terized by an increase of the interval between the largest events [Simkin and Howard, 1970]. The earthquake mag-nitude also decreased to Ms4.7–4.9 on 15 June and to Ms<
4.5 between 17 and 20 June [Filson et al., 1973; Stix and Kobayashi, 2008]. During this sequence, the first seismic events, i.e., between 12 and 14 June, accounted for nearly half of the total seismic energy released during the caldera collapse (Figure 1c) [Simkin and Howard, 1970]. The successive collapse increments led to the development of a 1–2 km3trap‐door caldera with a maximum subsidence of
the surface of 300–350 m [Simkin and Howard, 1970; Filson et al., 1973] and a roof aspect ratio of∼0.3 [Stix and Kobayashi, 2008].
2.3. Miyakejima
[10] On 26 June 2000, a dike injection started from the
3‐ to 5‐km‐deep magma chamber of Miyakejima volcano [Nishimura et al., 2001]. Magma rapidly migrated within the crust toward the WNW, feeding a small andesitic submarine eruption on 27 June. The intrusion‐related seismic swarm was initially located below the summit and progressively propagated toward the WNW between−1 and −6 km depth [Wright and Sakai, 2004]. The dike injection triggered a sharp inflation of the southwestern half of the edifice [Ueda et al., 2005; Irwan et al., 2006], rapidly followed by a continuous centripetal deflation of the volcanic island [Ito and Yoshioka, 2002; Murase et al., 2006]. From 4 July, earthquake activity below the summit was reactivated draw-ing a columnar swarm between the magma chamber and the sub‐surface [Geshi et al., 2002]. Initiation of the caldera collapse occurred on 8 July at the same time than a first summit phreatic eruption. Then the volcano underwent 46 collapse increments between 8 July and 18 August, i.e., about 40 days [Ukawa et al., 2000; Geshi et al., 2002]. 39 events out of the 46 collapses produced Very‐Long‐Period (VLP) seismic signals [Kikuchi et al., 2001; Kumagai et al., 2001]. The cumulative seismic energy released by these events and the rate of volumetric changes present a roughly linear increase interpreted as the result of a constant rate of magma withdrawal (Figure 1b) [Kumagai et al., 2001; Stix and Kobayashi, 2008].
[11] By contrast with Piton de la Fournaise, the
incre-mental subsidence at Miyakejima was coeval with 5 summit eruptions: two phreatic ones on 8 July and 10 August an-d three phreatomagmatic events on 14–15 July anan-d 13 anan-d 18 August [Geshi and Oikawa, 2008]. The composition change of the juvenile erupted products during the phreatomagmatic eruptions, from andesitic in July to basaltic in August, was interpreted as the result a deep magma injection between 15 July and 13 August [Geshi and Oikawa, 2008]. The summit eruptive activity and the distal seismic swarm per-sisted until mid‐September 2000 [Geshi et al., 2002; Wright and Sakai, 2004]. The 2000 eruption of Miyakejima led to the development of a∼450 m deep caldera with a diameter of 1.6 km and a volume of 0.6 km3 [Geshi et al., 2002].
Considering the piston diameter described by Geshi et al. MICHON ET AL.: DYNAMICS OF BASALTIC CALDERAS B03209 B03209
Figure 1. Individual (left ‐hand scale and open circles) and cumulative (right ‐hand scale and gray diamonds) amplitude of the collapse events at (a) Piton de la Fournaise, (b) Fernandina, and (c) Miyakejima. For Piton de la Fournaise, the amplitude is represented by the collapse ‐related acceleration determined from the N ‐S component of the RER broadband seismometer of the GEOSCOPE network located 8 km north of the summit. The seismometer is recording the ground velocity (seismic signal in count/m/s). The signal has been deconvoluted from the instrumental response and derived to obtain the acceleration in m s − 2 .Data of Miyakejima are after Stix and Kobayashi [2008]. The released seismic energy during the collapse events of Fernandina was calculated as LogE = 1.96M + 2.05, where E is the energy in Joules, and M is the magnitude of the earthquake. Magnitudes are given by Filson et al. [1973].
[2002] and an average magma chamber depth of 4 km gives a roof aspect ratio of 5.7 (Table 1).
3. Timing of Caldera Collapse
[12] At Piton de la Fournaise and Miyakejima, the
incre-mental collapses were coeval with sudden outward dis-placements of the edifice, producing successive tilt steps on tiltmeter data [Ukawa et al., 2000; Yamamoto et al., 2001; Michon et al., 2007]. T was then considered as the duration between two successive tilt steps. A different approach has been developed for Fernandina. Based on the analysis of the number of events N of a given magnitude Ms, Filson et al.
[1973] discriminated two different populations of seismic events related to the caldera collapse [see Filson et al., 1973, Figure 12]. The largest events, Ms> 4.5, are interpreted as
the result of the collapse of the caldera block whereas the smaller earthquakes would represent secondary adjustments and landslides. However, there is an ambiguity in the work of Filson et al. [1973] because the authors proposed the occurrence of 75 collapse increments whereas only 43 seis-mic events have a magnitude larger than 4.5. Given this disagreement and the uncertainty on the origin of the earth-quakes characterized by a magnitude close to the transition between the two groups, i.e., incremental collapse or read-justments, we chose two thresholds of earthquake magnitude to define T: taking earthquakes magnitude greater than 4.3 yields a set of 77 seismic events consistent with the number of collapses estimated by Filson et al. [1973]. Alternatively, Piton de la Fournaise data suggest that Ms4.4
is a better threshold to define caldera incremental collapses (see below). Applied to Fernandina, this threshold restricts the data set to 59 events.
[13] After reprocessing, whatever the method used, Piton
de la Fournaise, Fernandina and Miyakejima present a first‐ order roughly similar evolution of T. T first decreases until a minimum level and then increases to its maximum value (Figure 2a). At a second order, two different evolutions of T can be identified for Piton de la Fournaise and Fernan-dina on the one hand, and Miyakejima on the other hand (Figures 2b and 2c). Despite differences in the total number of collapse increments, T variations for Piton de la Fournaise and Fernandina draw strikingly similar patterns: a decrease during 30–33% of the collapse increment total number, followed by a relatively constant level between 30 and 33% and 86–91% of the collapse increment total number, before a sharp increase until the last collapse increment (Figure 2b). The similar values of Tnorm, the normalized T with respect to
its longest value Tmax, for both volcanoes confirm the almost
identical collapse dynamics of Piton de la Fournaise and Fernandina (Figure 2c). Tnormdecreases from about 0.2–0.3
for the initial collapses to constant level at around 0.1, before the rapid final increase. Note that the similar collapse dynamics of Piton de la Fournaise and Fernandina, for earthquakes having Ms> 4.4 suggests that the whole caldera
collapse of Fernandina results from about 59 collapse in-crements instead of 75.
[14] The collapse dynamics of Miyakejima shows many
differences with those of Fernandina and Piton de la Four-naise. The distribution of T during the caldera collapse of Miyakejima is much more scattered throughout the event. T increases early in the collapse caldera process, i.e., for
n = 0.6 instead of n = 0.85–0.9 at Piton de la Fournaise and Fernandina (Figure 2c). T finally decreases before the end of the caldera collapse whereas it simply increases on the two other volcanoes. It is worth noting that the final T decrease at Miyakejima was coeval with summit erup-tions, which lack at Piton de la Fournaise and Fernandina during the same final period.
[15] We consider next the amplitude of collapse
incre-ments through time for the three studied calderas and the edifice deformation of Piton de la Fournaise and Miyakejima during their caldera collapse, in order to determine a collapse‐related evolution as complete as possible for each volcano.
4. Amplitude of the Collapse Increments
and Magma Outflow Rates Through Time
[16] A posteriori quantification of the caldera block
downward displacement during each collapse increment may be performed if the total amount of vertical collapse and the relative amplitude of each collapse are known. The caldera collapse of Fernandina triggered a downward dis-placement of 300–350 m of the initial caldera floor [Simkin and Howard, 1970; Filson et al., 1973]. For Miyakejima, Geshi [2009] inferred a total collapse of about 1600 m, i.e., the volume of the caldera (6 × 10⁸ m3) divided by the observed surface of the piston (384 × 103 m2). With the
same approach, we determined a total collapse of about 450 m for Piton de la Fournaise; the ratio between a caldera volume of 96 × 106m3[Urai et al., 2007] and the surface of
the piston of 212 × 103 m2 deduced from orthorectified
images of the caldera.
[17] Assuming that (1) the acceleration amplitude or the
seismic energy released by each collapse increment at Piton de la Fournaise and Fernandina (Figure 1) is proportional to the amount of piston downward displacement and (2) the cumulative acceleration amplitude or the cumulative seismic energy released accounts for the vertical total collapse (450 m at Piton de la Fournaise and a mean value of 325 m for Fernandina), we calculated the downward displacement associated with each collapse increment and the subsequent volumetric changes in the magma chamber (Figure 3a). It is worth noting that the displacements inferred for Fernandina present relatively large (yet impossible to quantify) uncertainties due to the scattered and distant characteristics of the seismic network.
[18] For Miyakejima, volumetric changes have been
already determined from VLP signals [Kumagai et al., 2001]. However, since only 39 out of the 46 collapses triggered VLP signals, we preferentially used tiltmeter data of Yamamoto et al. [2001] to infer the vertical collapse amplitude and subsequently the volume changes. The remarkably parallel evolution of the tilt step amplitude, the volume changes [Kumagai et al., 2001] and the released seismic energy [Kikuchi et al., 2001] clearly indicates that tilt steps are as appropriate as VLP signals for estimating the relative amplitude of collapses (Figure 4). Most importantly, as tilt data recorded the 46 collapse events, they provide a com-plete picture of the evolution of the collapse amplitude throughout the caldera development.
[19] Our results on the downward displacements show
that each caldera experienced maximum vertical displace-MICHON ET AL.: DYNAMICS OF BASALTIC CALDERAS B03209 B03209
Figure 2. (a) Evolution of T during the whole collapse caldera processes at Piton de la Fournaise, Fer-nandina, and Miyakejima. (b) Individual time interval with respect to the collapse total number. (c) Nor-malized T (Tnorm= T / Tmax) and collapse number (n = number of each collapse increment / total number
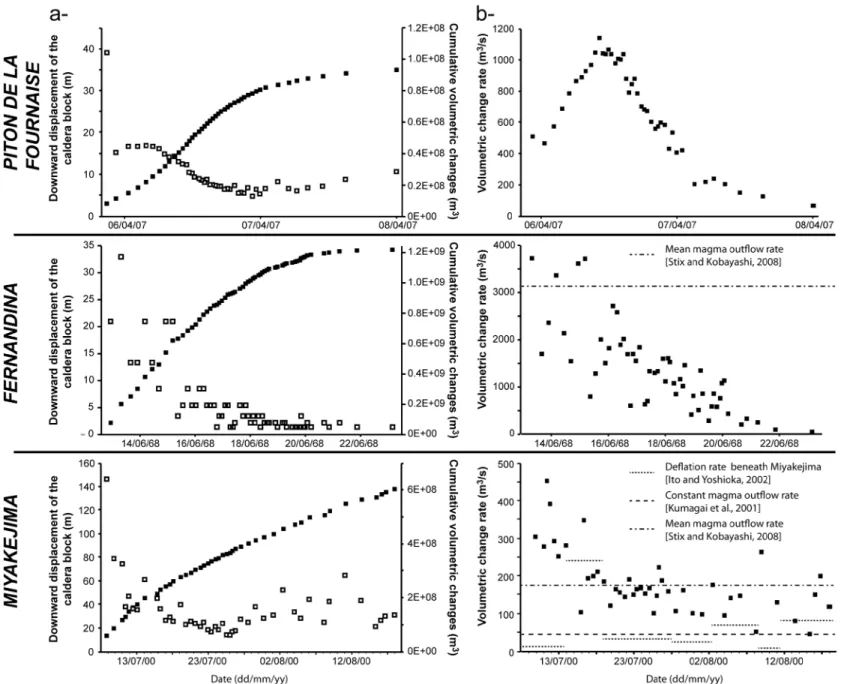
Figure 3. (a) Downward displacements during each collapse increments and the resulting cumulative volumetric changes in the magma chamber. (b) Volumetric change rates inferred from the volumetric changes and the time interval between two collapse increments. See text for explanation.
MICHON ET AL.: DYNAMICS OF BASALTIC CALDERAS B03209 B03209 7 of 18
ments during their first collapse increments, i.e., 39 m, 32 m and 147 m at Piton de la Fournaise, Fernandina and Miyakejima, respectively (Figure 3a). For Miyakejima, this value outstandingly agrees with observations, which indi-cate the development of a 140‐m‐deep caldera after the first collapse increment [Geshi et al., 2002]. In the case of Fernandina, our result is significantly larger than the 8–18 m of collapse proposed by Stix and Kobayashi [2008]. Next the downward displacement amplitudes rapidly decreased except at Piton de la Fournaise where they first remained at a relatively constant level, around 15–17 m, during the 6 subsequent collapse increments and next lowered. For Miyakejima and Piton de la Fournaise, values reached a minimum (∼10% of the maximum displacement) about halfway through the whole collapse events, whereas they continuously decreased at Fernandina until the end of the collapse caldera process. After the low level, downward displacements slightly and progressively increased until 11 m at Piton de la Fournaise, while they rapidly doubled at Miyakejima from 28 July and then remained at a strongly fluctuating high level (from 20 m to 65 m) until the end of the caldera development (Figure 3a). The occurrence of relatively large collapses during this last phase triggered a linear increase of the cumulative volumetric changes, i.e., the cumulated volume of caldera block intruded into the magma chamber, as already mentioned by Kumagai et al. [2001]. This evolution contrasts with those of Piton de la Fournaise and Fernandina where the cumulative volumetric changes are characterized by an attenuation of the augmen-tation during the second half of the collapse caldera process. [20] Dividing the volumetric change related to each
col-lapse increment by the time interval T, we quantified the volumetric change rate, usually interpreted as similar to the magma outflow rate [Kumagai et al., 2001; Stix and Kobayashi, 2008], throughout the collapse processes. Figure 3b first reveals that the volumetric change rates notably differed for the three studied calderas. Maximum rates of 1133 m3s−1, 3724 m3s−1and 454 m3s−1have been
determined for Piton de la Fournaise, Fernandina and Miyakejima, respectively. Figure 3b also shows distinct evolutions of the volumetric change rates for each caldera. At Piton de la Fournaise, the volumetric change rate increased during the first 11 collapse increments, from 460 m3s−1to 1133 m3s−1, then remained stable around 1000 m3 s−1during eight collapse increments, and underwent a first rapid then slow decrease until 68 m3s−1at the end of the
collapse caldera process.
[21] For Fernandina, the volumetric change rate strongly
varied between 796 m3s−1and 3724 m3s−1, from 12 June
(the onset of collapse) to 16 June. Such variations may reflect real changes in the caldera dynamics. However, it must be kept in mind that volumetric change rates depend primarily on the downward displacement amplitudes, on which there are large uncertainties, as explained above. From 16 June, the volumetric change rates decreased from about 2000 m3s−1to 47 m3s−1at the end of the collapse
process, in a way roughly similar to the final decrease observed for Piton de la Fournaise. Integration of our vol-umetric change rates for the whole caldera collapse suggests a mean value of 1341 m3 s−1, which significantly differs from the 3000–3400 m3s−1estimate of Stix and Kobayashi
[2008]. However, this difference is mostly explained by a
shorter total collapse duration, 182 h in their work and 242 h in ours (from 2221 GMT 12 June to 0343 GMT 23 June), and a caldera volume of 2.2 × 10⁹m3, larger than the pre-vious volume estimates, between 1 × 10⁹m3and 2 × 10⁹m3
[Simkin and Howard, 1970; Filson et al., 1973].
[22] By contrast with Piton de la Fournaise and
Fernan-dina, Miyakejima experienced a twofold average evolution of the volumetric change rate (Figure 3b). Between the collapse onset on 8 and 21 July, the volumetric change rates decreased from 454 m3s−1to∼150 m3s−1. Afterward, they fluctuated between 47 m3s−1and 264 m3s−1, at an almost
constant mean volumetric change rate of∼140 m3s−1. These
values and their variations strongly differ from those pro-posed by Ito and Yoshioka [2002] and Kumagai et al. [2001] (Figure 3b). However, their integration during the whole caldera collapse gives a mean volumetric change rate of 155 m3 s−1, which is almost similar to the 170 m3 s−1 proposed by Stix and Kobayashi [2008] for the mean magma outflow rate.
5. Edifice Deformation During Caldera Collapse
[23] Two main results have already been reported
concerning the deformation of Piton de la Fournaise and Miyakejima during their caldera collapse. First, these events were coeval with an overall centripetal deflation of both edifices [Ito and Yoshioka, 2002; Murase et al., 2006; Michon et al., 2007, 2009; Staudacher et al., 2009]. Second, the volcano experienced successive phases of progressive inward subsidence ended by sudden outward inflation while the caldera roof was collapsing in the magma chamber [Ukawa et al., 2000; Michon et al., 2007]. We combine here GPS, tiltmeter and seismic data in order to refine the edifice deformation during both caldera collapses.
5.1. Piton de la Fournaise
[24] The deformation of Piton de la Fournaise has been
monitored by the geodetic network of the Piton de la Fournaise Volcano Observatory. Data recorded by the TCRI tiltmeter station show the occurrence of 44 tilt steps between 2048 GMT 5 April and 0009 GMT 8 April (Figure 5a). Due to local site effects, the largest deformation amplitudes are recorded on the TCRI tangential component. An interesting aspect revealed by tilt and GPS data is a long‐term edifice deformation. TCRI station shows a decreasing trend of the initial slope values after the first 9 collapse increments fol-lowed by an increase until the last collapse event (Figure 5a). GPS data indicate that the first and second trends represent periods of outward and inward displacements of the edifice, respectively. These variations suggest that besides the elastic response of the edifice, the volcano experienced a twofold long‐term deformation corresponding to the edifice inflation followed by its deflation (Figure 5b).
[25] Tilt data are also used to determine the critical
amount of deformation experienced by the edifice before the collapse of the rock column. The tangential component of TCRI reveals a slope variation of 28 mrad before the first collapse increment. Once the collapse initiated the amount of slope variation decreased from about 9mrad after the first collapse increment to a low level around 3 mrad, between 1400 GMT 6 April and 0100 GMT 7 April (Figure 5c). Then, failure occurred for increasing amount of deformation
Figure 4. Evolution of the tilt step amplitude recorded at the MKT station [after Yamamoto et al., 2001] and of the volumetric changes [after Kumagai et al., 2001] and the seismic energy released inferred from the 39 VLP events [after Kikuchi et al., 2001] during the caldera collapse of Miyakejima.
MICHON ET AL.: DYNAMICS OF BASALTIC CALDERAS B03209 B03209 9 of 18
Figure 5 MICHON ET AL.: DYNAMICS OF BASALTIC CALDERAS B03209 10 of 18
up to a maximum value of 10.5mrad at the end of the caldera collapse.
[26] Dividing the amount of slope variation for each
collapse cycle by its duration, T, enables assessments of the rate of deformation during the successive collapse cycles (Figure 5d). Data indicate that after the first collapse cycle, the rate of edifice deformation increased up to an average value of about 8 mrad/h between 1100 and 1300 GMT 6 April. After that, the rate of deformation lowered, first rapidly until 0100 GMT 7 April, then slowly. This evolution is remarkably similar to that of the mean amplitude of the seismic signal recorded by the TKR seismic station, close to the eruption site (Figure 5e). It has been shown that (1) the seismic amplitude and the emission rate had parallel evo-lutions [Coppola et al., 2009; Staudacher et al., 2009] and (2) the seismic amplitude was strongly influenced by the collapse of the rock column into the magma chamber [Michon et al., 2007]. Thus, we propose that the rate of edifice deformation gives qualitative insights into that of magma outflow from the magma reservoir.
[27] Two phases were discriminated from the variations of
both the rate of edifice deformation and the seismic ampli-tude (Figure 5). Phase 1 is characterized by an increasing rate of deformation concomitant with the emission rate and by a decrease of the amount of deformation before failure. Phase 2 starts when the slope variation rate ceases to increase. It is subdivided in two periods 2a and 2b, charac-terized by a rapid and slow decrease of both parameters, respectively. Note that phase 2b starts when the critical amount of deformation yielding to failure along the ring faults increases. These phases 1, 2a and 2b are strictly contempo-raneous with the increase, rapid decrease and slow decrease of the volumetric change rates (Figure 3b).
5.2. Miyakejima
[28] The caldera collapse of Miyakejima was preceded by
a period of deflation, triggered by the 26 June northwestward dike intrusion [Ito and Yoshioka, 2002]. Magma withdrawal from the 3‐ to 5‐km‐deep magma chamber [Nishimura et al., 2001; Murase et al., 2006] led to the destabilization of the rock column on 8 July, and subsequently to its incremental collapses until 18 August (Figure 6a). As in the case of Piton de la Fournaise, tiltmeter data allowed the determination of the amount of deformation preceding each collapse event. Data inferred from the N‐S component of the MKK tiltmeter reveal a slope variation of ∼82 mrad before the first col-lapse increment. The amount of slope variation drastically decreased after this first event, drawing a decreasing trend between 7mrad to 1.5 mrad until 24 July (Figure 6b). Slope variations next tend to increase up to∼8 mrad on 8, 11 and 13 August, before a final decrease coeval with the phreato-magmatic summit eruptions on 13 and 18 August.
[29] Integration of both the time interval and the amount
of slope variation suggests that the deformation of Miya-kejima was characterized by three successive periods (Figure 6c). The rate of deformation first increased between the onset of the caldera collapse and 13 July. Although much shorter, this augmentation is relatively similar to that of phase 1 at Piton de la Fournaise. Then, the deformation rate presents a rapid decrease between 13 and 24 July, comparable to phase 2a at Piton de la Fournaise. Finally, the rate of deformation remained almost constant until the end of the caldera collapse. This period, which differs from phase 2b observed at Piton de la Fournaise by a lack of decrease, is labeled phase 3.
[30] GPS data from the NIED Miyakejima observation
network [Ukawa et al., 2000] are used to determine the edifice large‐scale deformation during the caldera collapse. Variations of the baseline’s length between two couples of GPS stations show that once the collapse initiated on 8 July, baseline’s lengths ceased to decrease and instead increased until 13 July (phase I1 in Figure 6d). The periods of
decreasing then increasing baseline lengths correspond to phases of inward deflation and outward uplift, respectively [Murase et al., 2006]. The inflation phase was followed by a period of deflation lasting 7 days, between 13 and 20 July (period D1 in Figure 6d). Deflation came to a halt on
20 July. At that time, the slight increase of the baseline lengths reveals the occurrence of a 3‐days‐long inflation phase, I2, until 23 July (period I2in Figure 6d). Afterward,
the edifice deflated again even after the end of the collapse caldera process.
6. Discussion
6.1. Amount of Magma Evacuated Before Collapse [31] From a hazard point of view, the critical volume
fraction of magma evacuated fcritbefore caldera collapse is a
parameter of primary importance to evaluate if a given eruption will trigger the collapse of the magma chamber roof. Analysis of past eruptions in silicic setting and of analog models reveals that the greater the caldera roof aspect ratio R, the larger fcrit[Roche and Druitt, 2001; Geyer et al.,
2006]. fcritevolves from 7% to 94% for R ranging between
0.2 and 3.2, respectively [Aramaki, 1984; Druitt and Sparks, 1984; Pyle, 1990; Pallister et al., 1996; Cioni et al., 1999; Wallace et al., 1999; Gardner and Tait, 2000]. Assuming, as many authors did [e.g., Druitt and Bacon, 1989; Martí et al., 2000; Roche and Druitt, 2001], an almost entire emptying of the magma chamber at the end of the collapse caldera process, we determined upper bounds of fcritfor the
three studied caldera collapses as the ratio between the volume of piston intruded in the magma chamber during the first collapse increment and the caldera total volume. This
Figure 5. Deformation of Piton de la Fournaise during the 2007 caldera collapse. (a) Tilt changes recorded by the TCRI tiltmeter stations between 1600 GMT 5 April and 0200 GMT 8 April. Radial and tangential tilts are parallel and perpen-dicular to the slope, respectively. (b) Displacement of the northern rim of the caldera monitored by the SNEG GPS station [after Staudacher et al., 2009]. (c) Amount and (d) rate of slope variation inferred from the tangential component of the TCRI tiltmeter. (e) Mean amplitude per minute of the seismic signal recorded by the TKR seismic station. ER, Emission rate proposed by Coppola et al. [2009] and Staudacher et al. [2009]. 1, 2a and 2b account for the successive phases identified from both the rate of slope variation and the mean amplitude of the seismic signal.
MICHON ET AL.: DYNAMICS OF BASALTIC CALDERAS B03209 B03209
Figure 6. Deformation of Miyakejima during the 2000 caldera collapse. (a) Tilt changes along the N‐S component of the MKK tiltmeter station [after Ukawa et al., 2000]. (b) Amount and (c) rate of slope variation inferred from the radial component of the MKK tiltmeter. (d) Baseline lengths between the MKS‐MKA and MKT‐MKA GPS stations [after Ukawa et al., 2000]. I1and I2correspond to the first and
second periods of inflation. D1and D2represent the first and second periods of deflation. 1, 2a and 3
account for the successive phases identified from the rate of slope variation. The deflation source is located SW of the summit at 4–5 km below sea level [Nishimura et al., 2001; Murase et al., 2006].
yields fcritof 8.2%, 6.4% and 9.4% for Piton de la Fournaise,
Fernandina and Miyakejima, respectively. Note that these values would be smaller if magma is left in the magma chamber following caldera collapse. The results confirm the relationship between R and fcrit. However, our values are
much smaller than theoretical ones inferred from analog models [Geyer et al., 2006], i.e., 73.4%, 16.5% and 82.5% for Piton de la Fournaise (R = 3.8), Fernandina (R = 0.3) and Miyakejima (R = 5.7), respectively. Such a difference may have two possible causes. The first possibility is the pre-existence of ring faults resulting from earlier caldera col-lapses and along which fluids of the hydrothermal system migrate and reduce the edifice strength. Thus, rupture of the caldera roof occurs for values of underpressure lower than expected from isotropic analog models. The second possi-bility, as shown by Martí et al. [2000], is that fcritdepends
essentially on the edifice strength, the magma chamber depth and the magma gas content. Caldera collapse should occur for fcritof a few percent up to 40% for deep gas‐poor
and shallow gas‐rich magma chambers, respectively. Thus, we interpret the basaltic to basaltic‐andesitic magma com-position [Nakada et al., 2005; Villemant et al., 2009] and/or a low edifice strength as the possible causes of the early caldera collapse of Piton de la Fournaise, Fernandina and Miyakejima.
6.2. Collapse‐Related Edifice Inflation
[32] The causal relationship between magma withdrawal
from a sub‐surface reservoir and the edifice centripetal deflation is well known [e.g., Wilson, 1935; Walsh and Decker, 1971; Dvorak, 1992; Roche et al., 2000; Geyer et al. 2006]. GPS and tiltmeter data recorded at Miyakejima [Ukawa et al., 2000; Yamamoto et al., 2001] and Piton de la Fournaise [Michon et al., 2007; Staudacher et al., 2009] during the summit caldera collapses reveal that despite the overall prominent deflation, the edifices also experienced pulses of outward inflation while the caldera block was collapsing. Edifice inflation occurred on both volcanoes after the first collapse increment (Figure 7). A second inflation phase took place at Miyakejima between 20 and 23 July, while the collapse increment amplitude had drastically decreased (Figure 7c).
[33] Edifice inflations are in general related either to
upward magma migrations [e.g., Lénat et al., 1989] or to pressure increase in the magma chamber [e.g., Dieterich and Decker, 1975; Delaney and McTigue, 1994] and/or in the hydrothermal system [e.g., Bonafede, 1991; Dzurisin et al., 1994]. The edifice inflation recorded at Miyakejima after the initiation of the caldera collapse has been recently inter-preted as resulting from an upward magma migration having led to the 14–15 July phreatomagmatic summit eruption [Murase et al., 2006]. Yet, GPS data [Ukawa et al., 2000] indicate that the edifice was already deflating since 12 July, 2 days before the eruption (Figure 6d). Thus, deflation predated eruption, which is not consistent with a magma progressive upward migration between 8 and 14 July.
[34] According to equation (2), a given collapse increment
may produce overpressure in the magma chamber if the volume of piston intruded into the magma chamber exceeds that of magma withdrawn from the magma reservoir before the collapse [Kumagai et al., 2001]. For Piton de la Fournaise and Miyakejima, the incremental edifice inflation recorded
after the onset of caldera collapse was coeval with the piston largest vertical displacements, i.e., the largest volumes in-serted into the magma chamber (Figure 7c). Inflation was also contemporaneous with a period of increasing slope variation rates for both volcanoes (Figure 7). We also showed for Piton de la Fournaise that changes of the slope variation rates were linked to modifications of the magma outflow rates (Figures 5 and 7). We therefore propose that the first large collapse increments related to the caldera collapse of Piton de la Fournaise and Miyakejima triggered overpressure in the magma chamber that caused edifice inflation and the increase of magma evacuation rates. Martí et al. [2000] already pointed out the pressure increase in the magma chamber after the beginning of the caldera collapse and the related discharge rate augmentation. However, the authors assumed that without any intracaldera deposit magma pressure increases in the reservoir up to a lithostatic maximum bound only. Here, the incremental edifice infla-tion recorded at Piton de la Fournaise and Miyakejima during the first collapse increments suggests that the pres-sure in the magma chamber exceeded the lithostatic bound. Knowing that the load of the piston did not increase during the caldera collapse (no syn‐eruptive deposit in the caldera), we propose that the incremental over‐lithostatic could result from the conversion of the kinetic energy related to the piston displacement during the largest collapses, as men-tioned in the laws of energy and momentum conservation.
[35] Whatever the cause of the pressure increase, the
piston forcefully pushed magma out of the reservoir during the first 10 and 6 collapse increments at Piton de la Four-naise and Miyakejima, respectively. Then, the slope varia-tion rates stopped increasing and the edifices started deflating. Edifice deflation, which was coeval with a rapid decrease of the rate of magma withdrawal suggests that the effect of the caldera block on the magma chamber vanished with time. This twofold evolution, i.e., increase then decrease of the magma outflow rate, is similar to that proposed for caldera collapse in silicic setting where the eruption rate first increases due to the load of the piston and next decreases when most of the volatiles are ejected from the magma reservoir [Folch and Martí., 2009].
[36] Troise et al. [2003] showed that inflation tends to
facilitate normal slip along the ring faults. The edifice expansion due to the collapsing rock column therefore cor-responds to a process that could further enhance the collapse of the caldera block into the magma chamber. Applied to silicic calderas, which are supposed to be also bounded by vertical an/or outward dipping faults [Roche et al., 2000], expansion is an additional mechanism that may promote magma migration along the ring faults by opening them.
[37] GPS data show that Miyakejima experienced a second
inflation phase between 20 and 23 July during a period of minimum collapse amplitude. A causal relationship between the amount of vertical collapse and the inflation is therefore unlikely. Furthermore, the phases of edifice inflation did not predate summit eruptions, making the hypothesis of magma migration from the magma chamber to the surface doubtful. According to Ito and Yoshioka [2002], the intru-sion dynamics changed between 20 and 28 July, a period during which the rate of dike intrusion was maximum and sub‐crustal magma reservoirs started to feed the dike. We consequently propose that edifice inflation I2 (Figure 6d)
MICHON ET AL.: DYNAMICS OF BASALTIC CALDERAS B03209 B03209
Figure 7. Comparison between the (a) time interval T between two collapses increments and TQ ,(b) amount of slope var-iation before collapse, (c) downward displacement of the caldera block, (d) slope variation rate and (e) volumetric change rate. See text for explanation. Red arrows in Figure 7a highlight the difference between T and TQ for Miyakejima.
results from the influx of basaltic magmas within the 3‐5‐km‐ deep magma chamber of Miyakejima. Such an event could explain the composition change, from andesitic to basaltic, of the juveniles erupted on 14–15 July and 13 August [Geshi and Oikawa, 2008]. The influx‐related overpressure could also explain the sudden augmentation of the edifice defor-mation rate by a higher rate of magma outflow, on 24 July, just after the inflation phase (Figure 7d).
[38] To conclude, data on Piton de la Fournaise and
Miyakejima first show the striking effect of the collapsing rock column on the dynamics of the magma chamber and therefore on that of magma migration. The largest collapses trigger edifice inflation and boost the rate of magma out-flow. The deformation of Miyakejima also suggests that influx of deeper magmas in the collapse‐related reservoir may trigger edifice inflation during the development of collapse calderas.
6.3. Origin of T Variations
[39] Prior to this work, the evolution of T was described as
being different for Piton de la Fournaise, Fernandina and Miyakejima, each volcano having a specific dynamics [Filson et al., 1973; Ukawa et al., 2000; Michon et al., 2007; Stix and Kobayashi, 2008; Staudacher et al., 2009]. We conversely showed from tiltmeter and seismic data that despite large differences in the caldera geometry and the duration of the whole collapse caldera processes, Piton de la Fournaise and Fernandina experienced a similar collapse dynamics, which contrasts with that of Miyakejima (Figure 2c).
[40] According to equation (1), T depends on (1)
geomet-rical parameters defining to the size of the magma chamber V0
and the surface of caldera block S, (2) the magma’s bulk modulus !, (3) the rate of magma withdrawala, and (4) the frictional resistance FS− FD. ! and FS− FDare considered as
the two most prominent parameters controlling the collapse dynamics [Simkin and Howard, 1970; Filson et al., 1973; Kobayashi et al., 2003; Stix and Kobayashi, 2008].
[41] In the present work, the amount of slope variation
before collapse gives insight into the evolution of the fric-tional resistance FS − FD along the ring faults. Following
Kumagai et al. [2001] and Stix and Kobayashi [2008], the volumetric change rate (Figure 7e) is considered as corre-sponding to the magma outflow rate. The other parameters involved in equation (1) being either unknown (!) or con-stant (V0 and S), we determined a time interval TQ as the
ratio between the amount of slope variation and the volu-metric change rate for Piton de la Fournaise and Miyakejima (Figure 7a). The strikingly similar evolution of T and TQfor
Piton de la Fournaise indicates that (1) both parameters chiefly and equally controlled the time interval between two collapse increments and (2) ! did not significantly influ-enced T during the whole caldera collapse. Applying this result to Fernandina where the evolution of T is similar to that of Piton de la Fournaise (Figure 2c), we propose that the collapse dynamics in 1968 was also governed by FS− FD
and a.
[42] Comparison of T and TQfor Miyakejima confirms the
important role ofa and FS− FDin the collapse dynamics.
However, the relatively large differences between T and TQ
for the two first collapses and during phase 3 suggest that T was not only controlled by the magma withdrawal rate and the frictional resistance (Figure 7a). Such a difference may
result from a rapid increase of ! during the collapse process first 3 days and its decrease after 25 August. Assuming an andesitic magma richer in volatile than the basaltic one involved at Piton de la Fournaise and Fernandina, the magma underpressure that initiated the collapse of the cal-dera block likely triggered magma vesiculation and conse-quently a decrease of the bulk modulus, as described for silicic calderas [e.g., Martí et al., 2000]. ! then increased when the pressure augmentation caused by the collapse of the rock column prevented any magma vesiculation. We propose that the decrease of ! after 25 July results from the influx of a deep volatile‐rich basaltic magma into the col-lapse‐related magma chamber. The presence of such magma has been evidenced by the huge SO2 degassing since the
18 August summit eruption, which likely opened a pathway to the volatile phases to the surface [Kazahaya et al., 2004]. [43] In summary, our data on Piton de la Fournaise and
Miyakejima clearly show that the magma withdrawal rate is as important as the frictional resistance in the collapse dynamics in basaltic setting. Variations of the magma bulk modulus may also influence in a lesser extend this dynamics. 6.4. Synthetic Model for the Development of Basaltic Calderas
[44] Caldera collapses of Piton de la Fournaise,
Fernan-dina and Miyakejima have showed that basaltic calderas are the result of successive collapse increments [Simkin and Howard, 1970; Kumagai et al., 2001; Michon et al., 2007]. [45] The present work enables quantification of the timing
of collapse (i.e., the collapse dynamics), the downward displacements related to each collapse increment, the magma emission rates throughout the collapse caldera process. It also gives new insights into the collapse‐related edifice deformation and the parameters controlling the collapse dynamics. Taking into account the 2 phases recognized at Piton de la Fournaise and Fernandina and a third one at Miyakejima, we propose the following synthetic evolution for the development of basaltic calderas:
[46] First of all, the basaltic volcano experiences a lateral
intrusion fed by an intraedifice magma chamber. Magma withdrawal from the reservoir leads to a centripetal deflation until the rupture of the magma chamber roof [e.g., Druitt and Sparks, 1984].
[47] Phase 1 begins as soon as the caldera block collapses
into the magma chamber. It is characterized by the largest collapse events, an incremental edifice inflation and a step‐ by‐step increase of magma outflow. Edifice expansion and the augmentation of the magma withdrawal arise from a common source: the incremental overpressure caused by the volume of rock intruded in the magma chamber larger than that of magma withdrawn from the reservoir prior to the collapse. During this period the caldera block forcefully pushes the magma out of the reservoir. We propose that the decrease of the frictional resistance is caused by upward fluid migration along the ring faults, due to overpressure. Then, phase 1 is comparable to the period of increasing mass eruption rate described by Martí et al. [2000] and Folch and Martí [2009] for silicic calderas, once the piston subsidence starts (Figure 8).
[48] Phase 2 is characterized by a decrease of the rate of
magma outflow, collapse increments of small amplitude and an edifice overall deflation. The constant deflation indicates MICHON ET AL.: DYNAMICS OF BASALTIC CALDERAS B03209 B03209
that the volume of material intruded in the magma chamber is lower than that of magma withdrawn from the reservoir. It therefore suggests that the caldera block ceases to push the magma out of the reservoir since the end of phase 1. We propose that the transition from phases 2a to 2b results from the increase of the frictional resistance along the ring faults, that could originates from a decrease of upward fluid migration when overpressure stops. As a whole, phase 2 shows striking similarities with the period of decreasing mass eruption rate described by Folch and Martí [2009] for silicic calderas (Figure 8). As a consequence, basaltic and silicic calderas are characterized by a first‐order similar col-lapse dynamics despite large differences in the caldera geometry, magma compositions and eruption styles.
[49] Phase 3 is observed at Miyakejima only. It is marked
by almost constant rates of both edifice deflation and magma outflow until the end of the caldera collapse. Such an evolution results from the influx volatile‐rich deep magma in the collapse‐related reservoir, which rejuvenates the collapse dynamics.
7. Conclusion
[50] Compiling GPS, tiltmeter and seismic data recorded
during the caldera collapses of Fernandina, Miyakejima and Piton de la Fournaise [Filson et al., 1973; Ukawa et al., 2000; Yamamoto et al., 2001; Staudacher et al., 2009], we conclude that
[51] 1. The caldera collapse of Piton de la Fournaise and
Fernandina are characterized by a similar collapse dynamics despite large differences in the caldera size and the roof aspect ratios. For both volcanoes, the magma outflow rate and the frictional resistance along the ring faults chiefly controlled the time interval evolution. This common evo-lution contrasts with that of Miyakejima where the collapse dynamics was influenced by the magma outflow rate, the frictional resistance along the ring faults and also by the magma bulk modulus and an influx of deep magma during the collapse caldera process.
[52] 2. The collapsing rock column pushes the magma out
of the magma chamber during the first collapse increments only. These increments entailed overpressure in the magma chamber and consequently the edifice inflation and the increase of the magma evacuation rate.
[53] 3. The magma chamber roof collapsed for relatively
small amounts of magma evacuated despite large roof aspect ratios (8.2%, 6.4% and 9.4% for Piton de la Fournaise, Fernandina and Miyakejima, respectively). Such low values may result from the continuous fluids migration along pre-existing ring faults that weaken the edifice strength and/or the gas‐poor magma composition as already suggested by Martí et al. [2000].
[54] 4. Collapse caldera processes in basaltic setting are
characterized by two successive phases. Phase 1 corre-sponds to a period of increasing magma withdrawal rates. According to GPS data recorded at Piton de la Fournaise Figure 8. Twofold collapse dynamics for (a) basaltic and (b) silicic calderas. Figure 8a gives the rate of
magma outflow determined for the caldera collapse of Piton de la Fournaise, while Figure 8b gives the mass eruption rate calculated by Folch and Martí [2009] for silicic calderas.
and Miyakejima, this phase is coeval with edifice inflation. Rates of magma outflow next decrease during phase 2 as the edifice deflates. The striking similarity between this evolu-tion inferred for basaltic calderas and the twofold evoluevolu-tion described for silicic collapse calderas, i.e., increase then decrease of the mass eruption rate [Folch and Martí, 2009], suggests that basaltic and silicic calderas are both characterized by a first‐order identical dynamics. If new magma is injected into the collapse‐related reservoir then the collapse dynamics may slightly change as during phase 3 at Miyakejima.
[55] Acknowledgments. The authors thank Adelina Geyer and an anonymous reviewer for their helpful comments.
References
Aramaki, S. (1984), Formation of the Aira caldera, southern Kyushu, 22,000 years ago, J. Geophys. Res., 89, 8485–8501, doi:10.1029/ JB089iB10p08485.
Bonafede, M. (1991), Hot fluid migration: An efficient source of ground deformation ‐ Application to the 1982–1985 crisis at Campi Flegrei‐ Italy, J. Volcanol. Geotherm. Res., 48, 187–198, doi:10.1016/0377-0273(91)90042-X.
Cioni, R., R. Santacroce, and A. Sbrana (1999), Pyroclastic deposits as a guide for constructing the multi stage evolution of the Somma Vesuvius caldera, Bull. Volcanol., 61, 207–222, doi:10.1007/s004450050272. Coppola, D., P. Piscopo, T. Staudacher, and C. Cigolini (2009), Lava
dis-charge rate and effusive pattern of Piton de la Fournaise from MODIS data, J. Volcanol. Geotherm. Res., 184, 174–192, doi:10.1016/j. jvolgeores.2008.11.031.
Delaney, P. T., and D. F. McTigue (1994), Volume of magma accumula-tion or withdrawal estimated from surface uplift or subsidence, with application to the 1960 collapse of Kilauea volcano, Bull. Volcanol., 56, 417–424, doi:10.1007/BF00302823.
Dieterich, J. H., and R. W. Decker (1975), Finite element modeling of surface deformation associated with volcanism, J. Geophys. Res., 80, 4094–4102, doi:10.1029/JB080i029p04094.
Druitt, T. H., and C. R. Bacon (1989), Petrology of the zoned calcalkaline magma chamber of Mount Mazama, Crater Lake, Oregon, Contrib. Mineral. Petrol., 101, 245–259, doi:10.1007/BF00375310.
Druitt, T. H., and R. S. J. Sparks (1984), On the formation of calderas dur-ing ignimbrite eruptions, Nature, 310, 679–681, doi:10.1038/310679a0. Dvorak, J. J. (1992), Mechanism of explosive eruptions of Kilauea Vol-cano, Hawaii, Bull. Volcanol., 54, 638–645, doi:10.1007/BF00430777. Dzurisin, D., K. M. Yamashita, and J. W. Kleinman (1994), Mechanisms of
crustal uplift and subsidence at the Yellowstone caldera, Wyoming, Bull. Volcanol., 56, 261–270, doi:10.1007/BF00302079.
Filson, J., T. Simkin, and L.‐K. Leu (1973), Seismicity of a caldera col-lapse: Galapagos Islands 1968, J. Geophys. Res., 78, 8591–8622, doi:10.1029/JB078i035p08591.
Folch, A., and J. Martí (2009), Time‐dependent chamber and vent condi-tions during explosive caldera‐forming erupcondi-tions, Earth Planet. Sci. Lett., 280, 246–253, doi:10.1016/j.epsl.2009.01.035.
Folch, A., R. Codina, and J. Martí (2001), Numerical modeling of magma withdrawal during explosive caldera‐forming eruptions, J. Geophys. Res., 106(B8), 16,163–16,175, doi:10.1029/2001JB000181.
Gardner, J. E., and S. Tait (2000), The caldera forming eruption of Volcán Ceboruco, Mexico, Bull. Volcanol., 62, 20–33, doi:10.1007/ s004450050288.
Geshi, N. (2009), Asymmetric growth of collapsed caldera by oblique sub-sidence during the 2000 eruption of Miyakejima, Japan, Earth Planet. Sci. Lett., 280, 149–158, doi:10.1016/j.epsl.2009.01.027.
Geshi, N., and T. Oikawa (2008), Phreatomagmatic eruptions associated with the caldera collapse during the Miyakejima 2000 eruption, Japan, J. Volcanol. Geotherm. Res., 176, 457–468, doi:10.1016/j.jvolgeores. 2008.04.013.
Geshi, N., T. Shimano, T. Chiba, and S. Nakada (2002), Caldera collapse during the 2000 eruption of Miyakejima Volcano, Japan, Bull. Volcanol., 64, 55–68, doi:10.1007/s00445-001-0184-z.
Geyer, A., A. Folch, and J. Martí (2006), Relationship between caldera col-lapse and magma chamber withdrawal: An experimental approach, J. Volcanol. Geotherm. Res., 157, 375–386, doi:10.1016/j.jvolgeores. 2006.05.001.
Irwan, M., F. Kimata, and N. Fujii (2006), Time dependent modeling of magma intrusion during the early stage of the 2000 Miyakejima
activity, J. Volcanol. Geotherm. Res., 150, 202–212, doi:10.1016/j. jvolgeores.2005.07.014.
Ito, T., and S. Yoshioka (2002), A dike intrusion model in and around Miyakejima, Niijima and Kozushima in 2000, Tectonophysics, 359, 171–187, doi:10.1016/S0040-1951(02)00510-3.
Kazahaya, K., H. Shinohara, K. Uto, M. Odai, Y. Nalkahori, H. Mori, H. Iino, M. Miyashita, and J. Hirabayashi (2004), Gigantic SO2emission
from Miyakejima volcano, Japan, caused by caldera collapse, Geology, 32, 425–428, doi:10.1130/G20399.1.
Kikuchi, M., Y. Yamanaka, and K. Koketsu (2001), Source process of the long‐period seismic pulses associated with the 2000 eruption of Miyakejima volcano, and its implications, J. Geogr., 110, 204–216. Kobayashi, T., T. Ohminato, and Y. Ida (2003), Earthquakes series
preced-ing very long period seismic signals, observed durpreced-ing the 2000 Miyakejima volcanic activity, Geophys. Res. Lett., 30(8), 1423, doi:10.1029/ 2002GL016631.
Kumagai, H., T. Ohminato, M. Nakano, M. Ooi, A. Kubo, H. Inoue, and J. Oikawa (2001), Very‐long‐period seismic signals and the caldera for-mation at Miyake Island, Japan, Science, 293, 687–690, doi:10.1126/ science.1062136.
Lénat, J.‐F., P. Bachèlery, A. Bonneville, and A. Hirn (1989), The begin-ning of the 1985–1987 eruptive cycle at Piton de la Fournaise (La Réunion): New insights in the magmatic and volcano‐tectonic sys-tems, J. Volcanol. Geotherm. Res., 36, 209–232, doi:10.1016/0377-0273(89)90015-2.
Martí, J., A. Folch, G. Macedonio, and A. Neri (2000), Pressure evolution during caldera forming eruptions, Earth Planet. Sci. Lett., 175, 275–287, doi:10.1016/S0012-821X(99)00296-4.
Michon, L., T. Staudacher, V. Ferrazzini, P. Bachèlery, and J. Martí (2007), April 2007 collapse of Piton de la Fournaise: A new example of caldera formation, Geophys. Res. Lett., 34, L21301, doi:10.1029/2007GL031248. Michon, L., N. Villeneuve, T. Catry, and O. Merle (2009), How summit calderas collapse on basaltic volcanoes: New insights from the April 2007 caldera collapse of Piton de la Fournaise volcano, J. Volcanol. Geotherm. Res., 184, 138–151, doi:10.1016/j.jvolgeores.2008.11.003. Murase, M., et al. (2006), Time dependent model of magma intrusion in
and around Miyake and Kozu Islands, central Japan in June–August, 2000, J. Volcanol. Geotherm. Res., 150, 213–231, doi:10.1016/j. jvolgeores.2005.02.005.
Nakada, S., M. Nagai, T. Kaneko, A. Nozawa, and K. Suzuki‐Kamata (2005), Chronology and products of the 2000 eruption of Miyakejima Volcano, Japan, Bull. Volcanol., 67, 205–218, doi:10.1007/s00445-004-0404-4.
Nishimura, T., S. Ozawa, M. Murakami, T. Sagiya, T. Tada, M. Kaizu, and M. Ukawa (2001), Crustal deformation caused by magma migration in the northern Izu Islands, Japan, Geophys. Res. Lett., 28, 3745–3748, doi:10.1029/2001GL013051.
Pallister, J. S., R. P. Hoblitt, G. P. Meeker, R. J. Knight, and D. F. Siems (1996), Magma mixing at mount Pinatubo: Petrologic and chemical evi-dence from the 1991 deposits, in Fire and Mud: Eruptions and Lahars of Mount Pinatubo Philippines, edited by C. G. Newhall and R. S. Punongbayan, pp. 687–732, Univ. of Wash. Press, Seattle.
Peltier, A., V. Famin, P. Bachèlery, V. Cayol, Y. Fukushima, and T. Staudacher (2008), Cyclic magma storages and transfers at Piton de La Fournaise volcano (La Réunion hotspot) inferred from deforma-tion and geochemical data, Earth Planet. Sci. Lett., 270, 180–188, doi:10.1016/j.epsl.2008.02.042.
Pyle, D. M. (1990), New estimates for the volume of the Minoan eruption, in Thera and the Aegean World III, vol. 2, Earth Sciences, edited by D. A. Hardy, pp. 113–121, Thera Found., London.
Roche, O., and T. H. Druitt (2001), Onset of caldera collapse during ignim-brite eruptions, Earth Planet. Sci. Lett., 191, 191–202, doi:10.1016/ S0012-821X(01)00428-9.
Roche, O., T. H. Druitt, and O. Merle (2000), Experimental study of caldera formation, J. Geophys. Res., 105, 395–416, doi:10.1029/1999JB900298. Simkin, T., and K. A. Howard (1970), Caldera collapse in Galapagos Islands,
1968, Science, 169, 429–437, doi:10.1126/science.169.3944.429. Staudacher, T., V. Ferrazzini, A. Peltier, P. Kowalski, P. Boissier, P. Catherine,
F. Lauret, and F. Massin (2009), The April 2007 eruption and the Dolomieu crater collapse, two major events at Piton de la Fournaise (La Réunion Island, Indian Ocean), J. Volcanol. Geotherm. Res., 184, 126–137, doi:10.1016/j.jvolgeores.2008.11.005.
Stix, J., and T. Kobayashi (2008), Magma dynamics and collapse mechan-isms during four historic caldera‐forming events, J. Geophys. Res., 113, B09205, doi:10.1029/2007JB005073.
Troise, C., F. Pingue, and G. De Natale (2003), Coulomb stress changes at calderas: Modeling the seismicity of Campi Flegrei (southern Italy), J. Geophys. Res., 108(B6), 2292, doi:10.1029/2002JB002006.
MICHON ET AL.: DYNAMICS OF BASALTIC CALDERAS B03209 B03209
Ueda, H., E. Fujita, M. Ukawa, E. Yamamoto, M. Irwan, and F. Kimata (2005), Magma intrusion and discharge process at the initial stage of the 2000 activity of Miyakejima, central Japan, inferred from tilt and GPS data, Geophys. J. Int., 161, 891–906, doi:10.1111/j.1365-246X.2005.02602.x.
Ukawa, M., E. Fujita, E. Yamamoto, Y. Okada, and M. Kikuchi (2000), The 2000 Miyakejima eruption: Crustal deformation and earthquakes observed by the NIED Miyakejima observation network, Earth Planets Space, 52, xix–xxvi.
Urai, M., N. Geshi, and T. Staudacher (2007), Size and volume evaluation of the caldera collapse on Piton de la Fournaise volcano during the April 2007 eruption using ASTER stereo imagery, Geophys. Res. Lett., 34, L22318, doi:10.1029/2007GL031551.
Villemant, B., A. Salün, and T. Staudacher (2009), Evidence for a homo-geneous primary magma at Piton de la Fournaise (La Réunion): A geo-chemical study of matrix glass, melt inclusions and Pélé’s hairs of the 1998–2008 eruptive activity, J. Volcanol. Geotherm. Res., 184, 79–92, doi:10.1016/j.jvolgeores.2009.03.015.
Wallace, P. J., A. T. Anderson Jr., and A. M. Davis (1999), Gradients in H2O, CO2, and exsolved gas in a large volume silicic magma system:
Interpreting the record preserved in melt inclusions from the Bishop Tuff, J. Geophys. Res., 104, 20,097–20,122, doi:10.1029/1999JB900207.
Walsh, J. B., and R. W. Decker (1971), Surface deformation associated with volcanism, J. Geophys. Res., 76, 3291–3302, doi:10.1029/ JB076i014p03291.
Wilson, R. M. (1935), Ground surface movement at Kilauea Volcano, Hawaii Univ. Hawaii Res. Publ. 10, 56 pp.
Wright, T. L., and S. Sakai (2004), Interpretation of the Miyakejima 2000 eruption and dike emplacement using time animations of earthquakes, Bull. Earthquake Res. Inst. Univ. Tokyo, 79, 1–16.
Yamamoto, E., M. Ukawa, E. Fujita, Y. Okada, and M. Kikuchi (2001), Step‐like tilt change occurred during the caldera‐forming stage of the 2000 Miyakejima Volcanic Activity, J. Geogr., 110, 181–190. V. Famin and L. Michon, Laboratoire GéoSciences Réunion, Université de la Réunion, 15 ave. René Cassin, F‐97715 Saint Denis CEDEX 09, France. (laurent.michon@univ‐reunion.fr)
V. Ferrazzini and F. Massin, Institut de Physique du Globe de Paris, Sorbonne Paris Cité, 1 rue Jussieu, F‐75238 Paris CEDEX 05, France.
G. Roult, Seismology Department, Institut de Physique du Globe de Paris, Sorbonne Paris Cité, 1 rue Jussieu, F‐75238 Paris CEDEX 05, France.
![Figure 4. Evolution of the tilt step amplitude recorded at the MKT station [after Yamamoto et al., 2001] and of the](https://thumb-eu.123doks.com/thumbv2/123doknet/14792158.601896/10.1188.142.1046.331.545/figure-evolution-tilt-step-amplitude-recorded-station-yamamoto.webp)
![Figure 6. Deformation of Miyakejima during the 2000 caldera collapse. (a) Tilt changes along the N‐S component of the MKK tiltmeter station [after Ukawa et al., 2000]](https://thumb-eu.123doks.com/thumbv2/123doknet/14792158.601896/13.918.105.802.114.934/figure-deformation-miyakejima-caldera-collapse-changes-component-tiltmeter.webp)
