HAL Id: hal-00301255
https://hal.archives-ouvertes.fr/hal-00301255
Submitted on 9 May 2006HAL is a multi-disciplinary open access
archive for the deposit and dissemination of sci-entific research documents, whether they are pub-lished or not. The documents may come from teaching and research institutions in France or abroad, or from public or private research centers.
L’archive ouverte pluridisciplinaire HAL, est destinée au dépôt et à la diffusion de documents scientifiques de niveau recherche, publiés ou non, émanant des établissements d’enseignement et de recherche français ou étrangers, des laboratoires publics ou privés.
Effects of methane outgassing on the Black Sea
atmosphere
K. Kourtidis, I. Kioutsioukis, S. Rapsomanikis
To cite this version:
K. Kourtidis, I. Kioutsioukis, S. Rapsomanikis. Effects of methane outgassing on the Black Sea atmosphere. Atmospheric Chemistry and Physics Discussions, European Geosciences Union, 2006, 6 (3), pp.3611-3626. �hal-00301255�
ACPD
6, 3611–3626, 2006 Effects of methane outgassing on the Black Sea atmosphere K. Kourtidis et al. Title Page Abstract Introduction Conclusions References Tables Figures J I J I Back CloseFull Screen / Esc
Printer-friendly Version Interactive Discussion
Atmos. Chem. Phys. Discuss., 6, 3611–3626, 2006 www.atmos-chem-phys-discuss.net/6/3611/2006/ © Author(s) 2006. This work is licensed
under a Creative Commons License.
Atmospheric Chemistry and Physics Discussions
E
ffects of methane outgassing on the
Black Sea atmosphere
K. Kourtidis, I. Kioutsioukis, and S. Rapsomanikis
Lab. of Atmospheric Pollution and Pollution Control Engineering of Atmospheric Pollutants, Dept. of Environmental Engineering, Demokritus University of Thrace, 67100 Xanthi, Greece Received: 7 February 2006 – Accepted: 2 March 2006 – Published: 9 May 2006
ACPD
6, 3611–3626, 2006 Effects of methane outgassing on the Black Sea atmosphere K. Kourtidis et al. Title Page Abstract Introduction Conclusions References Tables Figures J I J I Back CloseFull Screen / Esc
Printer-friendly Version Interactive Discussion
Abstract
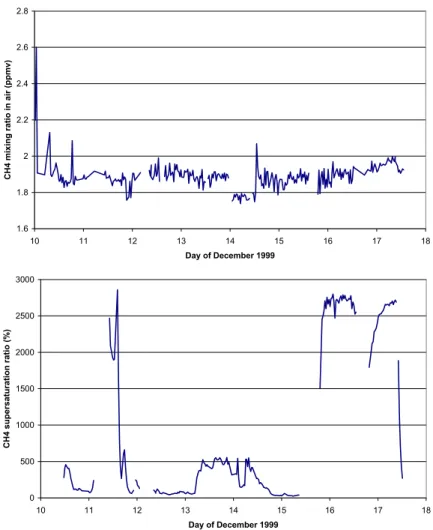
Methane in air and seawater was measured in the Eastern Black Sea during the 10–18 December 1999 BIGBLACK project cruise. The measurements allowed for the calcu-lation of supersaturation ratios and methane fluxes across the air-sea interface. CH4 mixing ratios in air were generally in the 1.8–2.0 ppmv range, while surface (4 m depth)
5
seawater concentrations varied from 5 to 100 ppmv. Above active seep areas, the water was supersaturated at around 500% with respect to the overlying atmosphere. Accord-ingly, flux densities varied greatly and were up to 4000 umol m−2 day−1. In the Sev-astopol harbour, supersaturations up to around 3000%, similar to those at the Danube Delta, were observed, while in the Istanbul harbour supersaturations could not be
de-10
termined because the very high values of water concentrations have led to detector saturation. Simple modelling shows that the observed fluxes do not have any substan-tial impact in the methane content of the Black Sea atmosphere, as they could only raise its concentrations by less than 1 ppb. On the other hand, calculations performed as part of the CRIMEA project, show that mud volcano eruptions could episodically
15
raise the methane concentrations well above their regional background for several tens of kilometres downwind.
1 Introduction
Methane is an important greenhouse gas and a precursor of tropospheric ozone. It is produced in a variety of thermogenic and biological methanogenic processes, some
20
of which occur on geologic time scales, while others on much shorter ones. As a result of these processes, large variations of atmospheric methane abundance might be expected, especially if large methane reservoirs become unstable. Such reservoirs include methane hydrates.
The Black Sea has received attention as a target of investigations on methane
be-25
cause of the large amounts of methane trapped in the anaerobic sediments and the 3612
ACPD
6, 3611–3626, 2006 Effects of methane outgassing on the Black Sea atmosphere K. Kourtidis et al. Title Page Abstract Introduction Conclusions References Tables Figures J I J I Back CloseFull Screen / Esc
Printer-friendly Version Interactive Discussion
hydrates present underneath these sediments. Under normal conditions, methane is vented from the sediments to the overlying water; some of this methane reaches unox-idised the water-air interface and subsequently escapes to the atmosphere, although most of it is consumed from bacterial activity within the water column (e.g. Durisch-Kaiser et al., 2005).
5
Some investigations of the methane flux from the Black Sea to the atmosphere have already been carried out (Amouroux et al., 2002; Schmale et al., 2005), yielding flux densities generally between 0.19–0.77 nmol m−2 s−1 (16–66 umol m−2 day−1), while above active seeps these might increase to 0.96–2.32 nmol m−2s−1(83–200 umol m−2 day−1), and above river plumes it might increase even further, up to 5.44 nmol m−2s−1
10
(470 umol m−2day−1).
To derive these fluxes, Amouroux et al. (2002) and Schmale et al. (2005) used the Liss and Merlivat (1986) and the Wanninkhof (1992) parameterisations of the depen-dency of the transfer velocity k on wind speed u, hereafter referred to as LM86 and W92, respectively. Both parameterisations are quadratic or near-quadratic; W92, for
15
example, parameterises k as a function of u as k=0.31 u210(Sc/660)−0.5, where Sc is the Schmidt number of CO2in seawater, 660 is the Scfor CO2in seawater at 20◦C and u10 is the wind speed corrected to 10 m height under neutral conditions.
Recent work, based to a large extend on measurements performed during the GasEx-1998 field experiments (McGillis et al., 2004), has resulted in other, cubic
pa-20
rameterisations, which yield better fits to the data (e.g. Hare et al., 2004, and ref-erences therein). Wanninkhof and McGillis (1999), using recent laboratory and field studies, proposed a cubic relationship between air-sea gas exchange and wind speed, k660=0.028 u310, or k=0.0283 u310(Sc/660)−0.5), which, compared with previous lations using the W92 parameterisation, resulted in a significant increase of the
calcu-25
lated oceanic global annual CO2 uptake. Fairall et al. (2000) reviewed the theoretical basis of various parameterisation schemes for bulk-to-bulk gas transfer. Since then, McGillis et al. (2001) used eddy accumulation for CO2 to determine k and showed that k can be described in their study as k660=3.3+0.026 u310, where k660is the k
nor-ACPD
6, 3611–3626, 2006 Effects of methane outgassing on the Black Sea atmosphere K. Kourtidis et al. Title Page Abstract Introduction Conclusions References Tables Figures J I J I Back CloseFull Screen / Esc
Printer-friendly Version Interactive Discussion
malised to Sc of 660 in cm hr−1 (which equals the Sc for CO2 in seawater at 20◦C). Other recent work used measurements of dual tracers during the Southern Ocean Iron Fertilisation Experiment SOFex (Wanninkhof et al., 2004), addressing the discrepan-cies between observational and model-based estimates of CO2uptake in the Southern Ocean (see also Feely et al., 2004), considered the effect of wind speed products
5
(Olsen et al., 2005) and addressed the effects of sea-state dependent wave breaking (Woolf, 2005).
In the present study, we applied LM86, W92 and additionally, the more recent pa-rameterisation of McGillis et al. (2001), hereafter referred to as MG01, to determine the flux of methane across the sea-air interface using cruise data. LM86, W92 and
10
MG01 normalise their parameterisations with respect to the Sc of CO2 in seawater at 20◦C. Schmidt numbers for methane and CO2 are rather similar, their difference being –1.7% to 2.6% in the temperature range 0 to 20◦C. Hence LM86, W92 and MG01 pa-rameterisations can be used for methane without modification and without introducing a significant error, since the uncertainty in Sc ranges from 3% to 10%, mainly due to
15
uncertainties in the diffusion coefficient. We note also here that while LM86 note 600 as the Sc of CO2 at 20◦C, W92 and MG01 note 660 as the Sc of CO2 at 20◦C. How-ever, k being a function of either (Sc/600)−0.5or (Sc/660)−0.5(Watson et al., 1991, and references therein), the error from this convention is less than 5%.
2 Experiment and methods
20
The BIGBLACK cruise took place in the waters of the Western Black Sea, in the lon-gitude range 29–32◦E and the latitude range 42–45.5◦N, onboard the Russian R/V Professor Vodianitsky.
Methane in air and seawater was measured with an automated Shimadzu GC/FID equipped with a Weiss equilibrator (Weiss, 1981). Details on the experimental setup
25
can be found in Bange (1994) and Bange et al. (1994), while more details on the function of the equilibrator, as well as a mathematical treatment of the equilibrating
ACPD
6, 3611–3626, 2006 Effects of methane outgassing on the Black Sea atmosphere K. Kourtidis et al. Title Page Abstract Introduction Conclusions References Tables Figures J I J I Back CloseFull Screen / Esc
Printer-friendly Version Interactive Discussion
processes can be found in Butler et al. (1988, 1989). Briefly, the analysis was per-formed isothermally on a mol sieve 5 ˚A column at 50◦C, with an injector temperature of 60◦C and a detector temperature of 280◦C. A 10-port valve with two sample loops was used to inject the sample, which was dried before entering the analytical system by means of a 30-cm glass tube filled with Sicapent drying agent. Sampling alternated
5
between ambient air and equilibrated air. Two CH4standards from Messer-Griesheim (of 1.57 and 1.96 ppmv methane) were used to calibrate the system during the cruise. Eight duplicate readings from alternate analyses of the two standards gave a response ratio of 1.244±0.012 (1σ), practically identical to the nominal manufacturer’s concen-tration ratio of 1.248. Hence, the first standard, of 1.96 ppmv CH4, was used
exten-10
sively throughout the cruise (two to five calibrations daily), while the second one, of 1.57 ppmv CH4 was used only during 17 December 1999. The reproducibility of the measurements, as determined from multiple standard injections during the course of each day, was around 1%.
The inlet for air analyses was around 50 m long, while the inlet from the equilibrated
15
air was around 4 m long. Multiple runs under operating conditions with the 1.96 ppmv methane standard connected to both inlets showed no significant differences that might have risen from inlet wall losses between the two inlets (i.e. the differences were within the 1% reproducibility limits).
The duplicate readings from two different sample loops provided us with the
confi-20
dence that the precision to see significant local increases in atmospheric concentra-tions due to high methane fluxes was more than adequate.
Methane supersaturations and fluxes were calculated from measurements using the methodology described in detail in Bange (1994) and Bange et al. (1994, 1996), which is based on the approach of Liss and Merlivat (1986) (LM86), for the transfer velocity
25
calculation. Fluxes were also calculated with the W92 and the MG01 parameterisa-tion. Water temperature and salinity at 4 m (the depth where the water pump inlet was located) were measured with CTD sondes during the cruise. The deviations (1σ) of these two parameters during the cruise were small (temperature: 10.68±0.29, salinity
ACPD
6, 3611–3626, 2006 Effects of methane outgassing on the Black Sea atmosphere K. Kourtidis et al. Title Page Abstract Introduction Conclusions References Tables Figures J I J I Back CloseFull Screen / Esc
Printer-friendly Version Interactive Discussion
17.6±0.34), hence their mean values were used in all calculations. Two pressure-equilibrating tubing lines in the equilibrator ensured sampling under atmospheric pres-sure, hence no pressure correction had to be applied.
We also established that the equilibration time of the seawater equilibrator (around 15 min) might have caused, in the case of rapidly fluctuating concentrations, a
smooth-5
ing of the measured seawater concentrations while sampling en route. This does not affect the measurements performed to the stations visited during the cruise (Danube fan, active seeps and Sevastopol harbour). Furthermore, the system performed without any problems for the duration of the cruise and we were able to calculate supersatura-tion ratios and fluxes of methane from the cruise area to the atmosphere.
10
The model used for calculating the dispersion of the methane plume from mud vol-cano eruptions is the 3-D airshed model ISC-AERMOD-VIEW from Lakes Environmen-tal Inc., modified to accommodate a larger grid (original grid 50 km×50 km). The model calculated the concentrations at 100×100 receptors at grid points and is based on the US EPA ISCST3 dispersion model for inert pollutants.
15
Required inputs are the wind velocity (8 m/s, 1.5 m/s for stability class A) and direc-tion (various), relative humidity (60%), temperature (288 K), pressure (1024 mb) and stability class (D, F and A). The mixing height was set to 1000 m.
3 Results and discussion
The measurements of methane in air and seawater, together with the calculated
super-20
saturation ratios, are presented in Figs. 1 and 2. The ship left the harbour of Istanbul on 9 December. Very high values of methane in air equilibrated with seawater lead to the saturation of the FID detector of the analytical system, hence inhibiting quantitative de-termination of the very high methane seawater supersaturations while in the harbour. Further, upon departure of the ship, the propeller caused sediment to enter the system;
25
hence the measurements were resumed, after extensive cleaning, on 10 December. On 10 December, the ship sampled en route as well as over an active seep area. On
ACPD
6, 3611–3626, 2006 Effects of methane outgassing on the Black Sea atmosphere K. Kourtidis et al. Title Page Abstract Introduction Conclusions References Tables Figures J I J I Back CloseFull Screen / Esc
Printer-friendly Version Interactive Discussion
11 December, the Danube fan area was sampled. On 13 December, the whole day was spent above an active seep. The ship entered the port of Sevastopol early in the morning of 16 December, where measurements continued until the afternoon of 17 December.
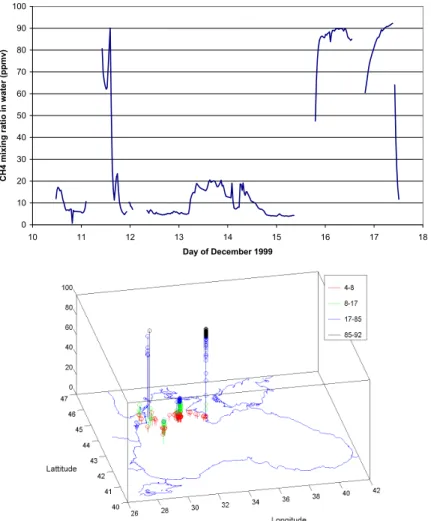
Above the two active seep areas where the ship sampled on 10 and the entire 13
5
December, methane concentrations in seawater were 8–20 ppmv, resulting in super-saturation ratios 200–600%. In the Danube fan area, where the ship sampled on 11 December, methane concentrations in seawater were up to 92 ppmv, resulting in super-saturation ratios of up to nearly 3000%, In the Port of Sevastopol, where the ship sam-pled on 16 and 17 December, methane concentrations in seawater were 50–92 ppmv,
10
resulting in supersaturation ratios 1500–3000%, higher than in the active seep areas. In the port of Istanbul, methane concentrations in seawater were even higher than in Sevastopol, but could not be quantified because the detector reached saturation.
Flux densities (Fig. 3), as already mentioned, were calculated using the methodol-ogy described in detail in Bange (1994) and Bange et al. (1994), using the
parame-15
terisations of the dependency of the transfer velocity on wind speed of LM86, W92 and MG01 (see Introduction). Lacking wind speed and salinity measurements during the ship’s stay in the port of Sevastopol, flux densities were not calculated, but they should obviously be higher than above active seeps. Quite high flux densities were also calculated for the Danube fan area. Generally, flux densities are higher than the
20
ones obtained in our group’s cruise in the same area during July 1995 (Amouroux et al., 2002). In open and shelf waters, Amouroux et al. (2002) measured flux densities 50–53 umol m−2 day−1 (calculated with W92), while the measurements reported here range between 23–280 umol m−2day−1, with a mean around 100 umol m−2day−1 (cal-culated also with W92) for open and shelf waters. However, the measurements during
25
the present study above the active seep area during the station there at 10 December fluxes were 240–716 umol m−2 day−1 and measurements above the Danube fan on 11 December were up to 3943 umol m−2 day−1(W92). At the high wind speeds of 11 and 12 December (up to 6 m/s), differences are observed between the cubic (LM86)
ACPD
6, 3611–3626, 2006 Effects of methane outgassing on the Black Sea atmosphere K. Kourtidis et al. Title Page Abstract Introduction Conclusions References Tables Figures J I J I Back CloseFull Screen / Esc
Printer-friendly Version Interactive Discussion
and the quadratic parameterisations (MG01 and W92), the latter increasing the calcu-lated wind densities by approximately a factor of two (Fig. 3), while at low wind speeds substantial differences (up to a factor of two) result also between MG01 and W92, the former being higher.
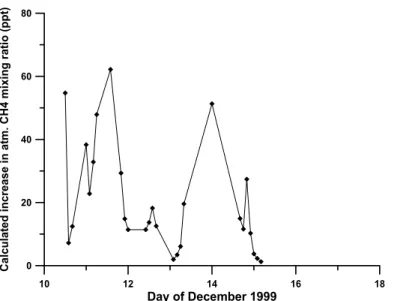
We used a simple method to estimate the effects of the above fluxes on the air
con-5
centrations of CH4: We assume a box located above the sea, with its ceiling at 1000 m, which appears a reasonable assumption for the height of the mixing atmospheric layer. The box is ventilated by the horizontal wind, for which we use the values that were measured during the BIGBLACK cruise onboard R/V Professor Vodianitsky (as mea-sured, otherwise 8 m/s). If we assume that methane is vented into the box with the flux
10
densities of Fig. 3 (LM86), and the contents of the box are vented completely out of the box in the time required for the mean wind speed to cross the box from one side to the other, with a series of simple calculations we derive that the measured flux densities would result in an increase in the atmospheric mixing ratio of methane by the amounts given in Fig. 4. Even if we use a different parameterisation, the increases would not
15
exceed a few hundreds pptv.
Clearly, under normal conditions the air-sea exchange of methane from the Black Sea has a negligible impact on the regional atmospheric background of methane, being many times smaller than the observed variability of atmospheric methane (Fig. 1b).
We now examine the case of episodic outbursts due to mud volcano eruptions.
Fol-20
lowing results from recent work on bubble-water column exchange of gases in the frame of the CRIMEA project (Daniel McGinnis, FZL-EAWAG, Switzerland; unpub-lished data), we assume in the worst case that 0.1% of the methane gas might reach the atmosphere, provided the eruption occurs at relatively shallow depths. In other words, a small fraction of methane bubbles rise all the way from the sea floor to the sea
25
surface, passes the pycnocline and then releases to the atmosphere, where it also self-ignites. We assume the release occurs from a rectangular area source 100 m×100 m, hence the emission rate in this case is 6.25 mmol m−2 s−1 (Guliyiev and Feizullayev, 1994).
ACPD
6, 3611–3626, 2006 Effects of methane outgassing on the Black Sea atmosphere K. Kourtidis et al. Title Page Abstract Introduction Conclusions References Tables Figures J I J I Back CloseFull Screen / Esc
Printer-friendly Version Interactive Discussion
Our modelling suggests (Fig. 5) that methane outbursts from mud volcanism (pro-vided some 0.1% of the methane gas reaches the atmosphere) may result in very large enhancements in the regional methane concentrations near the sea surface. For unstable and neutral conditions, the release results in raising the atmospheric methane concentration by 1–40 ppmv in the first 5 km from the release site, falling off at greater
5
distances. Under nighttime stable conditions, the enhancement can reach 600 ppmv close to the source, creating smog chamber conditions. The larger computed increases propagate also at larger distances (for 30 km downwind methane is increased by more than 7 ppmv, falling to its atmospheric mixing ratio of 1.8 ppmv after 50 km). Given that the dispersion model is linear (i.e. a doubling of the emission rate will double the
10
concentrations), if a larger proportion of the methane reaches the atmosphere, con-centrations will be proportionally larger.
Even with the modest 0.1% amount of the emitted methane reaching the atmo-sphere, some of the modelled increases are well above the sensitivity of available instrumentation, also space-borne (e.g. SCIAMACHY on ENVISAT), providing perhaps
15
a means for indirect sensing of mud volcano eruptions.
Acknowledgements. This work was funded under the BIGBLACK (EU IC15 CT96 0107) and
CRIMEA (EVK-2-CT-2002-00162) European Commission projects.
References
Amouroux D., Roberts G., Rapsomanikis, S., and Andreae, M. O.: Biogenic Gas (CH4, N2O)
20
Emission to the Atmosphere from Near-shore and Shelf Waters of the North Western Black Sea, Estuarine, Coastal and Shelf Science, 54(3), 575–587, 2002.
Bange, H. W., Bartell, U. H., Rapsomanikis, S., and Andreae, M. O.: Methane in the Baltic and North Seas and a reassessment of marine emissions of methane, Global Biogeochem. Cycles, 8, 465–480, 1994.
25
Bange, H. W.: Messungen von Lachgas (N2O) und Methan (CH4) in Europaeischen Neben-meeren, PhD Thesis, Johannes Gutenberg-Universitaet, Mainz, 1994.
ACPD
6, 3611–3626, 2006 Effects of methane outgassing on the Black Sea atmosphere K. Kourtidis et al. Title Page Abstract Introduction Conclusions References Tables Figures J I J I Back CloseFull Screen / Esc
Printer-friendly Version Interactive Discussion Bange, H. W., Rapsomanikis, S., and Andreae, M. O.: The Aegean Seaa as source of
atmo-spheric nitrous oxide and methane, Marine Chemistry, 53, 41–49, 1996.
Butler, J. H., Elkins, J. W., Brunson, C. M., Egan, K. B., Thompson, T. M., Conway, T. J., and Hall, B. D.: Trace gases in and over the West Pacific and East Indian Oceans during the El Nino-Southern Oscillation event of 1987, NOAA Data Report ERL ARL-16, Air Resources
5
Laboratory, Silver Spring, MD, USA, 1988.
Butler, J. H., Elkins, J. W., Thompson, T. M., and Egan, K. B.: Tropospheric and dissolved N2O off the West Pacific and Indian Oceans during the El Nino-Southern Oscillation event of 1987, J. Geophys. Res., 94, 14 865–14 877, 1989.
Durisch-Kaiser E., Klauser, L., Wehrli, B., and Schubert, C.: Evidence of intense archaeal and
10
bacterial methanotrophic activity in the Black Sea water column, Appl. Environ. Microbiol., 71, 8099–8106, 2005.
Fairall, C. W., Hare, J. E., Edson, J. B., and McGillis, W.: Parameterisation and micrometeoro-logical measurements of air-sea gas transfer, Boundary-Layer Meteorol., 96, 63–105, 2000. Feely, R. A., Wanninkhof, R., McGillis, W., Karr, M.-E., and Cosca, C. E.: Effects of wind
15
speed and gas exchange parameterisations on the air-sea CO2fluxes in the equatorial Pa-cific Ocean, J. Geophys. Res., 109, C08S03, doi:10.1029/2003JC001896, 2004.
Guliyiev, I. S. and Feizullayev, A. A.: Natural hydrocarbon seepages in Azerbaijan, Proc. AAPG Hedberg Research Conference, April 24–28, Vancouver, Canada, pp. 76–79, 1994.
Hare, J. E., Fairall, C. W., McGillis, W. R., Edson, J. B., Ward, B., and Wanninkhof, R.:
Eval-20
uation of the NOAA/Coupled-Ocean Atmopheric Response Experiment (NOAA/COARE) air-gas tranfer parameterization using GasEx data, J. Geophys. Res., 109, C08S11, doi:10.1029/2003JC001831, 2004.
Liss, P. S. and Merlivat, L.: Air-sea exchange rates: introduction and synthesis, in: The role of air-sea exchange in geochemical cycling, edited by: Buat-Menard, P., 113–127, Reidel, D.,
25
New York, 1986.
McGillis, W. R., Edson, J. B., Ware, J. D., Dacey, J. W. H., Hare, J. E., Fairall, C. W., and Wanninkhof, R.: Carbon dioxide flux techniques performed during GasEx-98, Marine Chem., 75, 267–280, 2001.
McGillis, W. R., Asher, W. E., Wanninkhof, R., Jessup, A. T., and Feely, R. A.:
In-30
troduction to special section: Air-sea exchange, J. Geophys. Res., 109, C08S01, doi:10.1029/2004JC002605, 2004.
Olsen A., Wanninkhof, R., Trinanes, J. A., and Johannessen, T.: The effect of wind speed
ACPD
6, 3611–3626, 2006 Effects of methane outgassing on the Black Sea atmosphere K. Kourtidis et al. Title Page Abstract Introduction Conclusions References Tables Figures J I J I Back CloseFull Screen / Esc
Printer-friendly Version Interactive Discussion products and wind speed-gas exchange relationships on interannual variability of the air-sea
CO2gas transfer velocity, Tellus, 57B, 95–106, 2005.
Schmale, O., Greinertand, J., and Rehder, G.: Methane emission from high-intensity ma-rine gas seeps in the Black Sea into the atmosphere, Geophys. Res. Lett., 32, L07609, doi:10.1029/2004GL021138, 2005.
5
Wanninkhof, R.: Relationship between wind speed and gas exchange over the ocean, J. Geo-phys. Res., 97(C5), 7373–7382, 1992.
Wanninkhof, R. and McGillis, W. R.: A cubic relationship between air-sea CO2exchange and wind speed, Geophys. Res. Lett., 26, 1889–1892, 1999.
Wanninkhof, R., Sullivan, K. F., and Top, Z.: Air-sea gas tranfer in the Southern Ocean, J.
10
Geophys. Res., 109, C08S19, doi:10.1029/2003JC001767, 2004.
Watson, A. J., Upstill-Goddard, R. C., and Liss, P. S.: Air-sea gas exchange in rough and stormy seas measured by a dual-tracer technique, Nature, 349, 45–147, 1991.
Weiss, R. F.: Determinations of carbon dioxide and methane by dual catalyst flame ionisation chromatography and nitrous oxide by electron capture chromatography, J. Chromatogr. Sci.,
15
19, 611–616, 1981.
Woolf, D. K.: Parametrization of gas transfer velocities and sea-state-dependent wave breaking, Tellus, 57B, 87–94, 2005.
ACPD
6, 3611–3626, 2006 Effects of methane outgassing on the Black Sea atmosphere K. Kourtidis et al. Title Page Abstract Introduction Conclusions References Tables Figures J I J I Back CloseFull Screen / Esc
Printer-friendly Version Interactive Discussion 1.6 1.8 2 2.2 2.4 2.6 2.8 10 11 12 13 14 15 16 17 18 Day of December 1999
CH4 mixing ratio in air (ppmv)
0 500 1000 1500 2000 2500 3000 10 11 12 13 14 15 16 17 18 Day of December 1999 CH4 supersaturation ratio (%)
Fig. 1. Methane mixing ratios (above) in air and supersaturation ratios (below) during the
BIGBLACK cruise.
ACPD
6, 3611–3626, 2006 Effects of methane outgassing on the Black Sea atmosphere K. Kourtidis et al. Title Page Abstract Introduction Conclusions References Tables Figures J I J I Back CloseFull Screen / Esc
Printer-friendly Version Interactive Discussion 0 10 20 30 40 50 60 70 80 90 100 10 11 12 13 14 15 16 17 18 Day of December 1999
CH4 mixing ratio in water (ppmv)
Fig. 2. Methane mixing ratios in water (in ppmv) during the BIGBLACK cruise plotted as a
func-tion of date (above) and as a funcfunc-tion of posifunc-tion (below). The 1:250 000 resolufunc-tion coastline is from NOAA’s National Geophysical Data Centre.
ACPD
6, 3611–3626, 2006 Effects of methane outgassing on the Black Sea atmosphere K. Kourtidis et al. Title Page Abstract Introduction Conclusions References Tables Figures J I J I Back CloseFull Screen / Esc
Printer-friendly Version Interactive Discussion 0 500 1000 1500 2000 2500 3000 3500 4000 4500 10 11 12 13 14 15 16 17 18 December 1999
Flux Density (µmol/m
2/day)
LM86 MG01 W92
Fig. 3. Flux densities calculated after LM86, W92 and MG01.
ACPD
6, 3611–3626, 2006 Effects of methane outgassing on the Black Sea atmosphere K. Kourtidis et al. Title Page Abstract Introduction Conclusions References Tables Figures J I J I Back CloseFull Screen / Esc
Printer-friendly Version Interactive Discussion 10 12 14 16 18 Day of December 1999 0 20 40 60 80 Calculat ed increase in at m. CH4 mixing ratio (ppt)
Fig. 4. Calculated increases in the atmospheric methane concentration due to the measured
ACPD
6, 3611–3626, 2006 Effects of methane outgassing on the Black Sea atmosphere K. Kourtidis et al. Title Page Abstract Introduction Conclusions References Tables Figures J I J I Back CloseFull Screen / Esc
Printer-friendly Version Interactive Discussion 0 5 10 15 20 25 30 35 40 0 5 10 15 20 25 30 35 40 45 50
Distance from Source (km)
CH4 Concentration (PPM) StabilityA StabilityD 0 50 100 150 200 250 300 350 400 450 500 550 0 5 10 15 20 25 30 35 40 45 50
Distance from Source (km)
CH4 Concentration (PPM)
StabilityF
Fig. 5. Methane plume dispersion from episodic unignited outbursts for unstable-neutral (top)
and stable (bottom) atmospheric conditions.