HAL Id: hal-01872535
https://hal.uca.fr/hal-01872535
Submitted on 15 Oct 2018
HAL is a multi-disciplinary open access archive for the deposit and dissemination of sci-entific research documents, whether they are pub-lished or not. The documents may come from teaching and research institutions in France or abroad, or from public or private research centers.
L’archive ouverte pluridisciplinaire HAL, est destinée au dépôt et à la diffusion de documents scientifiques de niveau recherche, publiés ou non, émanant des établissements d’enseignement et de recherche français ou étrangers, des laboratoires publics ou privés.
Limitations on retrieval of complex refractive index of
spherical particles from scattering measurements
Christophe Verhaege, Valery Shcherbakov, Pascal Personne
To cite this version:
Christophe Verhaege, Valery Shcherbakov, Pascal Personne. Limitations on retrieval of complex refrac-tive index of spherical particles from scattering measurements. Journal of Quantitarefrac-tive Spectroscopy and Radiative Transfer, Elsevier, 2008, 109 (14), pp.2338 - 2348. �10.1016/j.jqsrt.2008.05.009�. �hal-01872535�
Limitations on retrieval of complex refractive index of spherical
particles from scattering measurements
Christophe Verhaege*, Valery Shcherbakov, Pascal Personne
Laboratoire de Météorologie Physique, UMR/CNRS 6016, Université Blaise Pascal, 24 avenue des Landais, 63177 Aubière cedex, France
*Corresponding author:
Christophe VERHAEGE
LaMP - IUT de Montluçon - Dpt GTE Avenue A. Briand - BP 2235 03101 MONTLUCON Cedex FRANCE e-mail : [email protected] Phone : +33 4.70.02.20.73 Fax : +33 4.70.02.20.94 Others authors: Valery SHCHERBAKOV
LaMP - IUT de Montluçon - Dpt GTE Avenue A. Briand - BP 2235 03101 MONTLUCON Cedex FRANCE e-mail : [email protected] Pascal PERSONNE
LaMP - IUT de Montluçon - Dpt GMP Avenue A. Briand - BP 2235
03101 MONTLUCON Cedex FRANCE
e-mail : [email protected]
Abstract. On the base of a lookup table approach we performed sensitivity tests of
Dual-Polarization Polar Nephelometer (D2PN) data to optical and microphysical parameters of ensembles of spherical particles. Measurement errors were modeled as Gaussian random variables. It is shown that D2PN data enable to retrieve some microphysical parameters (depending on the case) along with the assessment of the complex refractive index. In the case of the low absorbing particles, measurement errors substantially reduce the sensitivity to the imaginary part of the refractive index and only the range of the imaginary part can be estimated, whereas the real part of the refractive index and the microphysical parameters can be retrieved. When the absorption of spherical particles is moderate, i.e., 104 0.5, the
microphysical parameters. In the case when the absorption of spherical particles is high, only the microphysical characteristics and the imaginary part can be retrieved. These limitations on retrieval should be valid for data of other instruments measuring the same magnitudes as D2PN with the same errors, at least for aerosols made of spherical particles.
1. INTRODUCTION
The knowledge of microphysical and optical characteristics of aerosols is of importance for modeling the radiative balance of Earth’s atmosphere, understanding the cloud life cycle, and remote sensing of tropospheric aerosols. Aerosols have been identified as a major uncertainty in predicting the global energy budget [16, section 2.4] because of major gaps in our knowledge of the composition and optical properties of these particles and their direct and indirect effects. Aerosol microphysical characteristics (parameters of the size distribution and the concentration of the aerosols sample, composition, refractive index) vary widely among various aerosol types (e.g., dust, biomass smoke, urban pollution, sea salt) and geographical regions. For example, soot particles have the refractive indices range from 1.25 [13, 11] to 2.67 [11] in the real part (n) and up to 1.34 in the imaginary part () [13, 25, 11, 3].
Nowadays, it is generally recognized that the aerosol complex index of refraction can be retrieved along with the size distribution from scattering measurements. Most of the methods are based on the Lorenz-Mie theory (see, e.g., Bohren and Huffman [2]), that is, aerosols are modeled as spherical particles. For example, Tanaka et al. [26] used the lookup table method to retrieve the refractive index and size distribution on the base of the measured parallel and perpendicular components of scattered light. Zhao et al. [32] and Zhao [33] used an inversion of measured Stokes parameters to determine the properties of ensembles of particles. Jones et al. [17] inverted the absolute intensity measurements of a 15 channels polar nephelometer to retrieve both the real part of the refractive index and the size distribution.
Barkey et al. [1] used genetic algorithms to find out the real part of refractive index on the base of nephelometer measurements.
Due to the progress in modeling of optical properties of single particles with diverse geometrical shapes, spheroid models come into play to account for aerosol particle nonsphericity. For example, the Version 2 AERONET (AErosol RObotic NETwork) retrieval [9] provides a number of aerosol parameters (i.e., size distribution, complex refractive index and partition of spherical/non-spherical particles). Nevertheless, homogeneous spherical particles remain the dominant model for aerosol inverse problems. Consequently, it is of importance to know limitations on retrieval of complex refractive index and size distribution of spherical particles from scattering measurements.
It is well known that the ensemble of parameters, which can be retrieved, and the accuracy of inversion are governed by the set of the measured magnitudes and by the measurement errors. Thus, there is no way to determine the limitations on retrievals that would be valid for any kind of scattering or remote sensing measurements. The evaluation of the retrieval accuracy and of limitations should be performed for each instrument intended for use. On the other hand, limitations appropriate to nephelometers may be regarded as some bounds for other instruments retrieving the same parameters and measuring the same magnitudes with comparable errors, for a similar spectral range.
The long term objective of the Dual-Polarization Polar Nephelometer (D2PN) designed at Laboratoire de Météorologie Physique (LaMP) is to develop a database of optical and microphysical characteristics of aerosols and to test inverse codes against it. The aim of this paper is to present results of sensitivity tests of the D2PN data to the parameters to be
retrieved, and to describe the limitations on retrievals that are appropriate to the D2PN. The experimental setup of the D2PN is outlined first. Thereafter our approach of sensitivity analysis is described. Section 4 is devoted to the main results.
2. LABORATORY DUAL-POLARIZATION POLAR NEPHELOMETER
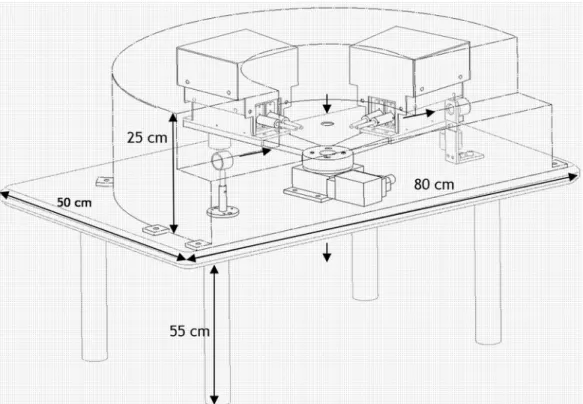
The Dual-Polarization Polar Nephelometer (D2PN) developed at the LaMP is presented on Figure 1. The sampling volume (0.67 cm3) is formed by the perpendicular
intersection of the laser beam and the particles flux of the same diameter (10 mm). The light source is a high-power (1.0 W) multimode laser diode operating at the wavelength
800 nm. The laser light passes through a depolarizer with the result that the sampling volume is illuminated by the unpolarized light (the degree of polarization is less than 1%). Measurements are performed with two identical sensors that are mounted on the rotating arm of 15 cm length and synchronously turned about the sampling volume. The polarizers are placed in front of the sensors so that the polarized components parallel I// and perpendicular
I to the scattering plane are measured. The sensors are adjusted to assure that the
intersections of their angular apertures with the sampling volume are the same and do not vary when the sensors are turned about. The angle, formed by the two sensors and the center of the sampling volume, is of 9° whatever the arm position is. During the rotation of the arm, measurements are carried out with the step of one degree. The setup is well protected by a suitable cover against light coming from outside. In order to avoid undesirable reflections, the
laser beam is dumped by a light trap on the far side of the D2PN, and the inside of the cover is coated with a material that absorbs light coming from the setup.
The measured data are quasi-continuous functions of the scattering angle , i.e., the angle between the incidence and scattering directions (see, e.g., [21, section 2.8]). Thus, two quantities I//() and I() can be obtained as function of . The parallel polarized
component I//() is measured by the first detector for the scattering angles ranging from 10°
to 160°; and the perpendicular polarized component I() is measured by the second
detector from 19° to 169°. The measured light power can range from 10 pW up to 3 µW. The accuracy of the measurements is estimated to be better than 5% when the single scattering conditions are assured and the concentration of particles is sufficiently high.
The polarized components I// [m1sr1] and I [m1sr1] are derived using the
following equation:
v
//, //,
dP
k
S
U
I
, (1)where
U
//, [V] are the amplified output voltages of the sensors; S d2 4 [m2] is thearea of the laser beam section; d 0.01[m] is the diameter of the laser beam or of the
particles flux; k 106[V/W] is the sensitivity of each sensors; P1.0[W] is the power of
the laser; 8.73 10 6 [sr]
d
area of each detector; v2d3 3 [ 3]
m is the sampling volume. The system constants,
grouped together, lead to:
//,
//,
qU
I
, (2) where 13.5[ 1 1 1] sr m V q .It is seen from Eq. (1) that the recorded by the detectors powers
P
//,
U
//,
k
are normalized by the values of the laser power P and of the solid angle d . Thus, thequantities I//() and I() are proportional to intensities (see, e.g., [15], p. 1), but are not real ones. Taking into consideration that the sampling volume is illuminated by the unpolarized light and the polarizers are placed in front of the sensors, the components I// and
I can be expressed as follows:
( ) ( )
8 ) ( 11 12 // C F F I sc ,
( ) ( )
8 ) ( 11 12 C F F I sc , (3) where C [m1]sc is the scattering coefficient, F11() and F12() [ ]
1
sr are the elements
of the scattering matrix (see, e.g., [29, 21, section 4.2]). The element F11() is called the
scattering phase function and satisfies the following normalization condition:
1 ) sin( ) ( 2 1 ) ( 4 1 0 11 4 11
F d F d . (4)The values of the unnormalized phase function can be deduced from the D2PN data by means of the formula: ) ( 4 ) ( ) ( ) ( // 11 I I C F I sc . (5) The parameter ( ) (( )) 11 12 F F
P is called the degree of linear polarization for incident unpolarized light (see, e.g., [14]) and can be computed as follows:
) ( ) ( ) ( ) ( ) ( // // I I I I P . (6)
As it is seen from Eqs. (3-6), the Dual-Polarization Polar Nephelometer is a device to measure intensity and linear polarization of light scattered by a sample of particles. The measured data can be employed for particle characterization due to potentially strong dependence of the scattering properties of spherical particles on their size parameter and refractive index (see, e.g., [21, section 9.7]). The components I// and I are proportional to
the scattering coefficient Csc. When the single scattering conditions are assured, the
coefficient Csc is proportional to the concentration of particles CV , and this enables CV to
3. SENSITIVITY ANALYSIS APPROACH
There are a number of methods to estimate the accuracy of retrievals (see, e.g., [28 section 8.5, 27 section 3.3, 23]) when an inverse problem is to solve. The comprehensive analysis of those methods is out of the scope of the present work. Here we will focus on those approaches that are commonly employed.
First of all, it should be pointed out that one deals with a nonlinear inverse problem when the value of the complex refractive index mni is to be retrieved along with the
size distribution of aerosols. This is because scattering characteristics are nonlinear functions of
n
and . Therefore, the formalism and the methods of the linear inverse problems theory can be applied only within a sufficiently small interval around an assigned value ofm
. Consequently, the analysis has to be performed on a grid of mi. The specified grid shouldoverlap the range of possible values of the aerosol refractive index and its steps have to be small enough to assure the validity of the linear approximation. In addition, much care should be given to the generalization of the obtained results.
The term “information content” is widely used in indirect sensing measurements after Twomey [28, section 8.5]. When a Fredholm integral equation of the first kind is to solve, e.g., a value of the aerosol refractive index is given and the size distribution is to be retrieved from scattering measurements, in a loose sense, the matter concerns the “number of independent pieces of information” taken to be the number of eigenvalues of a kernel-determined matrix which are greater than some assigned noise level. Such an approach allows optimization of the set of measured parameters in terms of their linear independence (see, e.g., [30]). It is
reasonable that according to that criterion the D2PN data appeared to be highly redundant with respect to the size distribution of homogeneous spheres. Nevertheless, the set of measured characteristic has not been reduced because there is no way to estimate the redundancy when the complex refractive index is to be retrieved.
Another method to outline the level of information content consists in a thorough analysis of the retrieval accuracy. If the set of measured data is not sufficiently informative, the accuracy of the inversions may not be good even if the accuracy of measurements is very high. The advantage of such an approach is that it can be applied to nonlinear inverse problems. On the other hand, it is time-consuming because the analysis has to be really comprehensive in order to consider all possible sources of errors (see, e.g., [6]). Moreover, results of the analysis depend on the method (or algorithm) and a priori constraints employed to retrieve aerosol parameters. In other words, high level of errors in retrieval of a parameter does not necessarily mean that the measured data are not sensitive to that parameter. That is why the main conclusions of the analysis of the retrieval accuracy should be confirmed by other means.
Due to the rapid progress in computer technology, i.e., largely amplified calculation speed and storage capacity, Monte Carlo-based (see, e.g., [27 section 2.4, 31, 20]) and lookup-table (see, e.g., [12]) methods are coming into increasing use to solve inverse problems. Those methods are time-consuming. In return, there is no need for linearity of an inverse problem. In addition, the data of direct modelling, which are necessary for retrievals, can be used to carry out sensitivity analysis. Recall that the measured characteristics have to be sensitive enough to variations of the parameters of interest. Otherwise the retrieved values are only a direct consequence of used a priori constraints. Thus, sensitivity tests are indispensable when the
inverse code is adapted to a new experimental set-up. In the present work, the following lookup-table approach was employed.
In our investigations, we used a software package that is based on the Lorenz-Mie theory [2]. The employed Mie code enables stable and accurate calculations of the scattering matrix for homogeneous spheres having the size parameter 2r up to 2103 in the
large range values of the complex refractive index. The scattering characteristics can be computed for any size distribution.
For the rigorous sensitivity tests, the particle volume size distribution was modelled by the lognormal distribution:
2 2 2 ) ln (ln exp 2 ln ) ( V V r r C r d r dV , (7)
where rV is the median radius,
is the standard deviation, and CV is the concentration.The quantities rV ,
and CV are the microphysical characteristics (parameters) that werementioned above. The lognormal distribution was chosen because it is often used to fit aerosol experimental data with three modes (nucleation, accumulation, and coarse) (see, e.g., [4]). We note in passing that the selection of the gamma distribution (see, e.g., [18]) does not affect the conclusions of the present work. Special attention was paid to the sensitivity of the data of the dual-polarization polar nephelometer to simultaneous variations of the complex refractive index and microphysical parameters. Thus, the input parameters aj (j1,,5) of the
V
C . As it was pointed out in Section 2, the measured components I// and I are
proportional to the concentration of particles CV . Due to that feature, the concentration can
be estimated without difficulty with the exception of strong absorbing particles (see Section 4). That is why in the following, we will discuss mainly the results that concern the retrievals of the refractive index, rV , and
, that is, the parameters that have nonlinear relationshipwith I// and I.
The grid of the input parameters aj (j1,,5) was assigned to overlap for sure the
range of possible values of aerosol (see, e.g., [7]) and warm clouds (see, e.g., [18]) characteristics, that is, the median radius rV was varied from 0.25 to 25.0
m and thestandard deviation
was assigned from 0.3 to 1.0. The tests were performed for the real part of the refractive index from 1.1 to 1.9 and the imaginary part from 10-10 to 10+1. The ranges ofthe
n
and overlap for sure the values that are appropriate for most of aerosols, as it can be seen in the Table 1 taken from d’Almeida et al. [5]. The steps of the grid were small enough to assure good accuracy of the first derivatives i aj , where i(n,,rV,,CV)) , , 1
(i N are grid scattering parameters, which correspond to the set of the quantities
that are measured by the D2PN. The dependence of i(n,,rV,,CV) on the scattering
angle is taken into account by the subscripts i.
In the following, the sensitivity of the D2PN data is analyzed in terms of root mean squared relative errors:
N i imeas meas i V V i n r C N RMS 1 2, 2 , ) , , , , ( 1
, (8)where i ,meas models D2PN measurements, hereafter called the synthetic data (or
measurements), i(n,,rV,,CV) corresponds to the data taken from the lookup table. The
relative errors are used because the components I//() and I() vary by several orders of magnitude as functions of the scattering angle .
In order to evaluate the effect of measurement errors, the two types of the synthetic data i ,meas were considered. The first one corresponds to the “error-free” conditions, i.e.,
comp i meas
i, ,
where i,comp were computed with the Mie code for assigned values of the
input parameters aj . The second type of the synthetic data considers measurements errors,
which were modeled as follows:
comp i i meas i, (1. e), , (9)
where ei is a Gaussian random variable (see, e.g., [22, section 7]) with zero mean and the
standard deviation
.As it was mentioned in Section 2, the accuracy of the measurements of the D2PN is estimated to be better than 5% when the single scattering conditions are assured and the concentration of particles is sufficiently high. In the case of low concentration, the accuracy is worse and it is estimated to be of 10%. In such a case, the D2PN data are usually averaged over 20 realizations in order to reduce the effect of random errors. In other words, 20 measurements are performed at each angle in order to have an average and a standard deviation for each point. In our simulations we modeled this case when the measurements
errors were considered. In more detail, we used value of 0.1 for the standard deviation
. TheRMS values were averaged over 20 realizations. For each realization, the Gaussian random
noise was added to the noiseless data i ,comp (Eq. 9), and the RMS value was computed
according Eq. 8.
4. RESULTS OF THE SENSITIVITY ANALYSIS
The sensitivity tests were performed for four following cases of the measured data: (i) the perpendicular I() and (ii) the parallel I//() components taken individually, (iii) the unnormalized phase function I()I()I//(), and (iv) the components I and I// taken together. Recall that the D2PN measurements are carried out with the step of one degree for the scattering angles ranging from 10° to 160° for I//() and from 19° to 169° for I(), that is, the perpendicular and parallel components are recorded at 151 values of . Consequently, the unnormalized phase function I() and the degree of linear polarization
) (
P are deduced for N 142 values of in the scattering angles range from 19° to 160°.
As it was mentioned above, the D2PN data appeared to be highly redundant with respect to the size distribution of homogeneous spheres. That is why it is reasonable that we obtained the very close results for all four cases. Therefore, only plots for the unnormalized phase function
) (
I are presented below.
The parameters of the size distribution of aerosol particles are considered to be unknown in the process of retrieval of the refractive index. That is, the sensitivity analysis was performed within 5D space of the input parameters aj (j1,,5) of the lookup table. The
results are shown on Figures from 2 to 9 as a 3D plot, i.e., as the projection of our results onto 2-D space of input parameters. When an inverse problem is nonlinear, the advantage of the sensitivity analysis approach, performed in terms of the root mean squared errors along with 3D representation, is that all minima can be seen and analyzed at the one time. This is especially convenient when graphics software enables image rotation. All secondary minima can be disclosed. It should be pointed out that 3D plots are used for the sensitivity analysis. As for inversion of the D2PN experimental data, an automated code based on the method of Dubovik et al. (see, e.g., [8]) is employed.
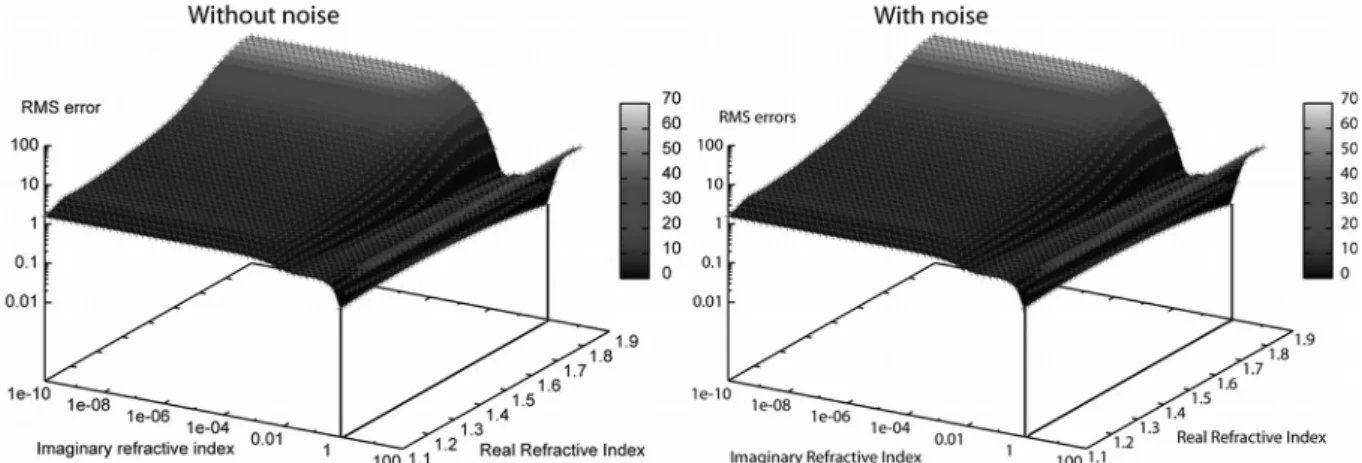
For Figures from 2 to 7, the X-axis represents the imaginary part
of the refractive index, the Y-axis is for the real partn
, and the Z-axis corresponds to the computed values ofRMS. The X- and Z-axes are plotted in the log scale. On each figure, the left panel
corresponds to the case of the error-free data, i.e., 0, and the right panel is for 0.1. Figure 2 shows the results obtained for the case of low absorbing particles. The synthetic measurements were computed for the refractive index value mmeas i
8 10 5 . 1 ,
and the parameters of the size distribution rV 0.5m, 0.5 and 106
V
C . The RMS values are plotted as 3D surface, which depends on the values of the real and imaginary parts of the variable refractive index m. The sharp minimum is exactly at m1.5108i on the left panel of Figure 2. (In this Figure and the subsequent ones, the point with RMS=0 is not shown on the left panels, i.e. the error-free cases, because RMS values are plotted in the log scale.) The minimum is at the same value of the refractive index and the same values of rV
the data of the D2PN are very sensitive to the refractive index values. Measurement errors substantially affect the sensitivity, especially, to the imaginary part of the refractive index. As it is seen on the right panel of Figure 2, there is no sharp minimum. There is the flat valley. Only the range of the imaginary part can be estimated, i.e., 104. On the other hand, at each value of 104, the minimum of RMS is at n1.5, which corresponds to the synthetic measurements. Consequently, the data of the D2PN remain sensitive to values of the real part of
m
. In other words, when the imaginary part of the refractive index is low and the errors of measurements are of 10%, the D2PN data enable to deduce the value of the real partn and the range of the imaginary part 104. The same conclusions were reached for other values of rV and
, as well as under the assumption that the measurement errors are of 5%,i.e., 0.05.
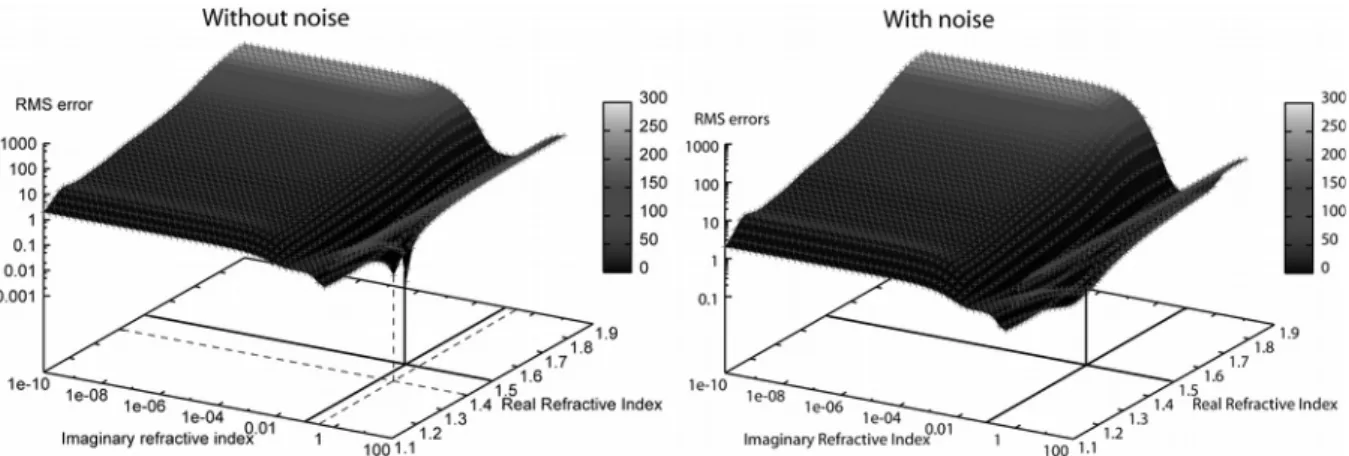
Figure 3 corresponds to the case when the absorption of particles is high, i.e., the imaginary part the refractive index is of the order of 1. Other parameters are the same. The value 1.0 was used to compute the synthetic data. For the both cases, i.e., the noiseless
and noisy data, it is seen the minimum of RMS for the imaginary part of the refractive index at
0 . 1
. The lowest value of RMS for the real part is at the edge of the domain of study (see
Figure 3, left panel). Thus, the data of the D2PN are not sensitive to the real part of the refractive index when the absorption is very high, that is, the value of
n
can not be estimated. To the contrary, measurement errors do not change the ability to retrieve the imaginary part of the refractive index which can be deduced with good accuracy.The two results above can be explained as follows. In the D2PN range of scattering angles, the phase functions of non absorbing particles strongly depend on the real part of the
refractive index [2]. The increase of the imaginary part up to 10-4, affects a little the phase
functions. In the case of the noisy data, the errors mask the variations of the phase function that are due to the increase of (up to 10-4). At the same time, the transformations of the
phase functions caused by variations of the real part overlap the effect of measurement errors. In the D2PN range of scattering angles, for strong absorbing particles, i.e., is of the order of 1, the phase functions almost do not depend on the real part n of the refractive index [2]. The phase functions are very flat due to high value of the imaginary part . Thus, the measurement errors certainly mask the effect of the real part. At the same time, the phase functions are sensitive to variations of .
Cases with the moderate absorption, i.e., the values of the imaginary part
5 . 0
104 , were studied as well. The results of our tests are shown for
i mmeas 4 10 5 . 1 , mmeas 1.5103i, m i meas 2 10 5 . 1 , and mmeas 1.5101i on Figures 4, 5, 6, and 7, respectively. The presentations of the plots are the same as in Figures 2 and 3. As it seen for the both error-free and noisy cases, the minima of the RMS values correspond to the values of the refractive index that were used for the synthetic measurements. Thus, the real and imaginary parts of the refractive index can be retrieved on the base of the D2PN data when the absorption of particles is intermediate. This is due to the fact that the variations of the phase functions of such kind of particles (104 0.5) are
quite high when
n
and
vary [2]. Consequently, for the cases with 104 0.5, thereal and imaginary parts of the refractive index can be estimated with quite good accuracy. It should be pointed out that it is exactly the same range for which Dubovik and colleagues
developed their inverse code for polydisperse spheres and/or randomly oriented oblate and prolate spheroids [8, 9].
Figure 7 can be viewed as a representative example testifying the nonlinearity of the inverse problem under consideration. On the left panel, there are two sharp minima at
i
m1.5101 and m1.40.5i. Two smooth minima are seen on the right panel at the
same values of the refractive index. Rigorous analysis of 3D plots on Figures 2 – 5 revealed a valley at about 1.0. Consequently, when an iterative algorithm (see, e.g., [8] and citations therein) is used to retrieve the refractive index special attention should be given to starting vector values in order to escape the secondary minimum.
Sensitivity tests of the same kind were performed for the real part ranged from 1.1 to 1.9, and for the imaginary part ranged from 10-8 to 1. Retrieval uncertainties as functions of
the imaginary part
of the refractive index are detailed in Table 2. Generally, the properties outlined above remain unchanged within the range of the real part 1.1 n1.9. It is reasonable that the measurement errors significantly affect the retrieval accuracy, and the accuracy depends on the value of
.In what follows, we discuss the results of sensitivity tests to the standard deviation
and the median radius rV when they are retrieved along with the complex index of refractionfrom scattering measurements. An example of such tests is shown on Figure 8. The X-axis is for the standard deviation, the Y-axis represents the real part
n
, the Z-axis corresponds to theRMS values. Figure 8 shows the case of moderate absorbing particles mmeas 1.445103i and of the measurement errors of 10%. The “true” value 0.5 of the standard deviation
can be retrieved. As for the imaginary part, it can be estimated (not shown). This is in agreement with the results of Figure 5.
Our simulations revealed that the D2PN data provide possibility to retrieve both the median volume radius rV and the real part of the refractive index. Figure 9 presents the RMS
values (Z-axis in the log scale), the radius rV (X-axis in the log scale) and the real part of the
refractive index (Y-axis). A minimum is seen for rV 1.5m and n1.44, that is, the values used to compute the synthetic measurements.
Figures 2 – 9 showed the examples of the RMS values as a function of two parameters. It follows from our simulations that the results above remain unaltered when four parameters (the microphysical characteristics
and rV , and the both parts of the refractive index) varysimultaneously. That is,
and rV can be retrieved along with the refractive index. As for
i n
m , it should be remembered that there is difference between the cases of low,
moderate and high absorbing particles (see Table 2).
The same conclusions go for retrievals of the concentration CV , that is, five
parameters
n
,
, rV and CV can be estimated simultaneously with the exception ofstrong absorbing particles, i.e., when
is of the order of 1. It turns out that in such a case there is no pronounced minimum of the RMS values as a function of CV and the imaginarypart of the refractive index. These properties can be explained using the formalism of the linear inverse problems theory. The covariance matrix of retrieval errors caused by random noise can be estimated by the expression (see, e.g., [27, section 3.2] and [10])
T -1
-1B W B
C , (10)
where B is the Jacobi matrix of the first derivatives in the near vicinity of the solution, i.e.,
j i ij a
B , W is the covariance matrix of measurement errors. The square roots of the
diagonal elements (variances) of C can be interpreted as ‘uncertainty bars’ [27, section 3.2]. If Ddet(BTW1B) is close to zero,
ii ii [ ] -1 1 -TW B B
C . It means that the parameters
j
a cannot be estimated all together.
In the D2PN range of scattering angles and for
close to 1, the value of the determinant D is very low, that is, 106 times lower than the values for particles with themoderate absorption. On the other hand, if the set of the retrieved parameters consists of ,
and rV , the values of D are of the same order of magnitude for all . Thus, theconcentration CV and the imaginary part of the refractive index affect the D2PN data just in
opposite directions in the case of strong absorbing particles.
It should be pointed out that the results above concern only measurements carried out in a limited range of scattering angles, i.e., for from 10° to 169°. The most important point is that there are no data at angles that are close to forward scattering (0°
10°). On the other hand, the eigenvector analysis (see, e.g., [28, section 8.5]) of the logarithm of phase functions, which are measured in the range of the scattering angles from 0° to 180°, revealed the following features. The main information on strong absorbing particles is contained in the interval about 0° 20°. Moreover, if this interval is available, the determinant D is sufficiently high, and microphysical parameters can be retrieved along with the assessment ofthe complex refractive index. In connection with this, the aureole CIMEL measurements (see, e.g., [19, 6]) are particularly attractive in study of fossil fuel combustion and biomass burning aerosols. We note in passing that in the case the moderate absorption particles (
5 . 0
104 ) the interval of scattering angles 90° 160° is also informative.
Our simulations, performed for the polarized perpendicular I and parallel I// components taken individually or in combination, showed that, compared to the case of the unnormalized phase function I(), the sensitivity the D2PN data increased, but not
essentially. At the same time, it is expected that measurements of I and I// will be substantial for characterization of non-spherical particles (see, e.g., [9]).
5. CONCLUSION
The lookup table approach is a useful tool to study the sensitivity of experimental data to retrieved parameters when one deals with a nonlinear inverse problem. Although that approach is time consuming, it enables rigorous evaluation of effects of all characteristics and measurement errors without linearity assumption. Moreover, all secondary minima can be disclosed and it gives ideas on starting vector values when an iterative algorithm of inversion is supposed to be used.
The data of the D2PN provide possibility to retrieve microphysical parameters of spherical aerosols, i.e., the median radius rV , the standard deviation
, and theappeared to be highly redundant with respect to the size distribution of homogeneous spheres and their refractive index. At the same time, it is expected that measurements of I and I// will be substantial for characterization of non-spherical particles.
In the case of the low absorbing particles, measurement errors substantially reduce the sensitivity of the D2PN data to the imaginary part of the refractive index. That is, only the range of the imaginary part can be estimated, whereas the real part of the refractive index and the microphysical parameters can be retrieved. When the absorption of particles is moderate, i.e., 104 0.5, the real and imaginary parts of the refractive index can be deduced along
with the microphysical parameters with quite good accuracy.
In the case when the absorption of particles is high, the data of the D2PN are not sensitive to the real part of the refractive index and retrieval errors of the concentration CV
are high. Thus, only the microphysical characteristics
, rV and the imaginary part can beretrieved with good accuracy.
In view of the fact that the D2PN set of the measured characteristics is quite large, it is reasonable that the disclosed limitations on retrieval of the complex refractive index of spherical particles from scattering measurements should be valid for data of other instruments measuring the same magnitudes as D2PN with the same errors. In our opinion, the above-mentioned limitations can be overcome with measurements extended to intervals of angles that are close to forward scattering (0°
10°).Although intensities of scattered light for spherical and non-spherical particles differ (see, e.g., [24], [9]), in our opinion the mentioned above limitations on assessment of
n
and
should be valid for non-spherical aerosols. The possibility to retrieve microphysicalcharacteristics and shape parameters of such particles needs thorough investigations. On the other hand, Dubovik et al. [9] showed that mixtures of spheroids allow rather accurate fitting of AERONET measured spectral and angular dependencies of observed intensity and polarization. Thus, it is promising to adapt the inverse method developed by Dubovik and colleagues [8, 9] to retrieve complex refractive index and size distributions of spherical aerosols and ensembles of prolate and oblate particles from D2PN data.
References
[1] Barkey B, Suzanne SE, Chung A. Genetic Algorithm Inversion of Dual Polarization Polar Nephelometer Data to Determine Aerosol Refractive Index, Aerosol Science and Technology 2007; 41:751-760.
[2] Bohren CF, Huffman DR. Absorption and scattering of light by small particles. 3rd ed.,
Wiley-Interscience, 1983.
[3] Bond TC and Bergstrom RW. Light Absorption by Carbonaceous Particles: An Investigative Review, J. Aerosol Sci. 2006; 40:27-67.
[4] Chazette P, Randriamiarisoa H, Sanak J, Couvert P, Flamant C. Optical properties of urban aerosol from airborne and ground-based in situ measurements performed during the Etude et Simulation de la Qualité de l'air en Ile de France (ESQUIF) program. J. Geophys. Res. 2005; 110:D02206.
[5] D’Almeida GA, Koepke P, Shettle EP. Atmospheric aerosols. Global climatology and radiative characteristics. Hampton Virginia: A Deepak publishing, 1991.
[6] Dubovik O, Smirnov A, Holben BN, King MD, Kaufman YJ, Eck TF, Slutsker I. Accuracy assessments of aerosol optical properties retrieved from AERONET sun and sky radiance measurements. J. Geophys. Res. 2000; 105:D8:9791–9806.
[7] Dubovik O, Holben BN, Eck TF, Smirnov A., Kaufman YJ, King MD, Tanré D, Slutsker I. Variability of absorption and optical properties of key aerosol types observed in worldwide locations. J. Atmos. Sci. 2002; 59, 590-608.
[8] Dubovik O. Optimization of Numerical Inversion in Photopolarimetric Remote Sensing. In: Videen G, Yatskiv Y, Mishchenko M, editors. Photopolarimetry in Remote Sensing. Dordrecht, Netherlands: Kluwer Academic Publishers, 2004. p. 65-106.
[9] Dubovik O, Sinyuk A, Lapyonok T, Holben BN, Mishchenko M, Yang P, Eck TF, Volten H, Muñoz O, Veihelmann B, van der Zande WJ, Leon J-F, Sorokin M, Slutsker I. Application of spheroid models to account for aerosol particle nonsphericity in remote sensing of desert dust. J. Geophys. Res. 2006; 111:D11208
[10] Eadie W, Drijard D, James F, Roos M, Sadoulet B. Statistical methods in experimental physics. Amsterdam: North-Holland, 1971.
[11] Fuller KA, Malm WC, Kreidenweis SM. Effects of mixing on extinction by carbonaceous Particles. J. Geophys. Res. 1999; 104:15941-15954.
[12] Grey WMF, North PRJ, Los SO. Computationally efficient method for retrieving aerosol optical depth from ATSR-2 and AATSR data. Appl. Opt. 2006; 45:12:2786-2795.
[13] Horvath H. Atmospheric light absorption-A Review, Atmos. Environn. 1993; 27A:293-317
[14] Hovenier JW. Measuring scattering matrices of small particles at optical wavelengths. In: Mishchenko MI, Hovenier JW, Travis LD, editors. Light scattering by nonspherical particles. San Diego: Academic Press, 355–365, 2000.
[15] Hovenier JW, Van der Mee C, Domke H. Transfer of polarized light in planetary atmospheres, Kluwer Academic Publishers, 2004.
[16] International Panel on Climate Change (IPCC), Climate Change 2007: The Physical Science Basis, Contribution of Working Group I to the Fourth Assessment Report of the IPCC, (ISBN 978 0521 88009-1), 2007.
[17] Jones MR, Leong KH, Brewster MQ, Curry BP. Inversion of Light-Scattering Measurements for Particle Size and Optical Constants: Experimental Study, Appl. Opt. 1994; 33:4025-4041.
[18] Kokhanovsky AA. Optical properties of terrestrial clouds, Earth-Science Reviews 2004; 64:189-241.
[19] Li Z, Goloub P, Blarel L, Damiri B, Podvin T, Jankowiak I. Dust optical properties retrieved from ground-based polarimetric measurements. Appl. Opt. 2007; 46:1548-1553.
[20] Ligon DA, Gillespie JB, Chen TW. Determination of aerosol parameters from light scattering data using an inverse Monte Carlo technique. Appl. Opt. 1996; 35:21:4297-4303.
[21] Mishchenko MI, Travis LD, Lacis AA. Scattering, Absorption, and Emission of Light by Small Particles. New-York, Cambridge: Univ. Press, 2002. (Available at http://www.giss.nasa.gov/~crmim/books.html)
[22] Press WH, Flannery BP, Teukolsky SA, Vetterling WT. Numerical Recipes in C: The Art of Scientific Computing. Cambridge: U. Press, 1992.
[23] Rodgers CD, Inverse Methods for Atmospheric Sounding: Theory and Practice. Series on Atmospheric Oceanic and Planetary Physics, vol. 2. Singapore: World Scientific, 2000.
[24] Rother T, Schmidt K, Wauer J, Shcherbakov V, Gayet J-F. Light scattering on Chebyshev particles of higher order. Appl. Opt. 2006; 45:23:6030-6037.
[25] Seinfeld JH, Pandis SN. Atmospheric Chemistry and Physics; from Air Pollution to Climate Change, New York: John Wiley & Sons, Inc., 1998.
[26] Tanaka M, Takamura T, Nakajima T. Refractive Index and Size Distribution of Aerosols as Estimated from Light Scattering Measurements. J. Climate Appl. Meteorol. 1983; 22:1253-1261.
[27] Tarantola A. Inverse Problem Theory and Methods for Model Parameter Estimation. SIAM, 2005.
[28] Twomey S. Introduction to Mathematics of Inversion in Remote Sensing and Indirect Measurements. Dover Publications Inc., 1977
[29] van de Hulst HC. Light Scattering by Small Particles. N.-Y.: John Wiley, Hoboken, 1957.
[30] Veselovskii I, Korenskii M, Griaznov V, Whiteman DN, McGill M, Roy G, Bissonnette L. Information content of data measured with a multiple-field-of-view lidar. Appl. Opt. 2006; 45:26:6839-6848.
[31] Zasetsky AY, Sloan JJ. Monte Carlo approach to identification of the composition of stratospheric aerosols from infrared solar occultation measurements. Appl. Opt. 2005; 44:22:4785-4790.
[32] Zhao F, Gong Z, Hu H, Tanaka M, Hayasaka T. Simultaneous Determination of the Aerosol Complex Index of Refraction and Size Distribution from Scattering Measurements of Polarized Light. Appl. Opt. 1997; 36:7992-8001.
[33] Zhao F. Determination of the Complex Index of Refraction and Size Distribution of Aerosols from Polar Nephelometer Measurements. Appl. Opt. 1999; 38:2331-2336.
Figures
Figure 1. Sketch of the laboratory polar nephelometer. Two positions of the rotating set are drawn. Large arrow is laser beam and small arrow is particles flux.
Figure 2. 3D surface plot of RMS errors vs the imaginary and the real parts of the refractive index. Left panel is the test without measurement errors, right panel is the test with measurement errors 0.1. The case of low absorbing particles m1.5108i,
6 10
V
Figure 3. Same as Figure 2, but for the case of high absorbing particles m1.51i, 6 10 V C , rV 0.5m, 0.5, 19 160.
Figure 4. Same as Figure 2, but for the case of particles with m1.5104i, 106
V
C ,
m
Figure 5. Same as Figure 2, but for the case of particles with m1.5103i, 106
V
C ,
m
rV 0.5 , 0.5, 19 160.
Figure 6. Same as Figure 2, but for the case of particles with m1.5102i, 106
V
C ,
m
rV 0.5 , 0.5, 19 160.
Figure 7. Same as Figure 2, but for the case of particles with m1.5101i, 106
V
C ,
m
Figure 8. 3D surface plot of RMS errors vs the standard deviation
and the real parts of the refractive index. Left panel is the test without measurement errors, right panel is the test with measurement errors 0.1. m1.445103i, 106 V C , rV 1.5m, 0.5, 160 19 .Figure 9. 3D surface plot of RMS errors vs the radius rV and the real parts of the refractive
index. Left panel is the test without measurement errors, right panel is the test with measurement errors 0.1. m1.445103i, 106 V C , rV 1.5m, 0.5, 160 19 .