HAL Id: hal-00328538
https://hal.archives-ouvertes.fr/hal-00328538
Submitted on 4 Oct 2007
HAL is a multi-disciplinary open access
archive for the deposit and dissemination of
sci-entific research documents, whether they are
pub-lished or not. The documents may come from
teaching and research institutions in France or
abroad, or from public or private research centers.
L’archive ouverte pluridisciplinaire HAL, est
destinée au dépôt et à la diffusion de documents
scientifiques de niveau recherche, publiés ou non,
émanant des établissements d’enseignement et de
recherche français ou étrangers, des laboratoires
publics ou privés.
by North American forest fire plumes during the
ICARTT-ITOP experiment in summer 2004
A. Petzold, B. Weinzierl, H. Huntrieser, A. Stohl, Elsa Real, J. Cozic, M.
Fiebig, J. Hendricks, A. Lauer, Kathy S. Law, et al.
To cite this version:
A. Petzold, B. Weinzierl, H. Huntrieser, A. Stohl, Elsa Real, et al.. Perturbation of the European
free troposphere aerosol by North American forest fire plumes during the ICARTT-ITOP experiment
in summer 2004. Atmospheric Chemistry and Physics, European Geosciences Union, 2007, 7 (19),
pp.5105-5127. �10.5194/acp-7-5105-2007�. �hal-00328538�
www.atmos-chem-phys.net/7/5105/2007/ © Author(s) 2007. This work is licensed under a Creative Commons License.
Chemistry
and Physics
Perturbation of the European free troposphere aerosol by North
American forest fire plumes during the ICARTT-ITOP experiment
in summer 2004
A. Petzold1, B. Weinzierl1, H. Huntrieser1, A. Stohl2, E. Real3, J. Cozic4, M. Fiebig1, J. Hendricks1, A. Lauer1, K. Law3, A. Roiger1, H. Schlager1, and E. Weingartner4
1Institut f¨ur Physik der Atmosph¨are, Deutsches Zentrum f¨ur Luft- und Raumfahrt, 82234 Wessling, Germany 2Norwegian Institute for Air Research (NILU), P.O. Box 100, 2027 Kjeller, Norway
3CNRS Service Aeronomie, Universite Pierre et Marie Curie. 4 Place Jussieu, 75252 Paris Cedex 05, France 4Laboratory of Atmospheric Chemistry, Paul Scherrer Institute, 5232 Villigen PSI, Switzerland
Received: 5 March 2007 – Published in Atmos. Chem. Phys. Discuss.: 10 April 2007 Revised: 7 September 2007 – Accepted: 16 September 2007 – Published: 4 October 2007
Abstract. During the ICARTT-ITOP Experiment in
sum-mer 2004 plumes from large wildfires in North Asum-merica were transported to Central Europe at 3–8 km altitude above sea level (a.s.l.). These plumes were studied with the DLR (Deutsches Zentrum fuer Luft- und Raumfahrt) re-search aircraft Falcon which was equipped with an exten-sive set of in situ aerosol and trace gas instruments. Anal-yses by the Lagrangian dispersion model FLEXPART pro-vided source regions, transport times and horizontal extent of the fire plumes. Results from the general circulation model ECHAM/MADE and data from previous aerosol stud-ies over Central Europe provided reference vertical profiles of black carbon (BC) mass concentrations for year 2000 con-ditions with forest fire activities below the long-term average. Smoke plume observations yielded a BC mass fraction of to-tal aerosol mass with respect to PM 2.5 of 2–8%. The ratio of BC mass to excess CO was 3–7.5 mg BC (g CO)−1. Even after up to 10 days of atmospheric transport, both characteris-tic properties were of the same order as for fresh emissions. This suggests an efficient lifting of BC from forest fires to higher altitudes with only minor scavenging removal of par-ticulate matter. Maximum aerosol absorption coefficient val-ues were 7–8 Mm−1which is about two orders of magnitude above the average European free tropospheric background value. Forest fire aerosol size distributions were charac-terised by a strong internally mixed accumulation mode cen-tred at modal diameters of 0.25–0.30 µm with an average dis-tribution width of 1.30. Nucleation and small Aitken mode particles were almost completely depleted.
Correspondence to: A. Petzold
(andreas.petzold@dlr.de)
1 Introduction
The global climate forcing by black carbon (BC) is still un-certain in magnitude. Estimates range from 0.1 to 0.5 W m−2 (Sato et al., 2003). One important source of uncertainties is the limited knowledge on BC source strengths and removal mechanisms. In particular, the long-range transport of BC from boreal or temperate forest fires suffers from a lack of knowledge on the removal and transformation processes of particles during transport. It is, however, widely accepted that long-range transport is one of the most important factors which controls the spatial and temporal variability of aerosol properties and atmospheric particle load from regional to continental scales across the entire tropospheric column. Al-though a large fraction of the aerosol remains in the con-tinental or marine boundary layer (CBL, MBL), particularly forest fire plumes may be lifted into the free troposphere (FT) or even into the upper troposphere/lowermost stratosphere (UT/LS) by pyro-convection or radiatively-driven convec-tion (Fromm et al., 2000, 2005; Jost et al., 2004; Damoah et al., 2006) and transported over long distances (Clarke et al., 2007) up to a hemispheric scale (Damoah et al., 2004; Mattis et al., 2003; M¨uller et al., 2005).
According to van der Werf et al. (2004, 2006), the boreal fire activities over North America were very strong in 1998 and 2004 and very weak in 2000 and 2001. For the 1998 burning season, Spichtinger et al. (2004) investigated the ef-fect of the fire emissions by means of the Lagrangian particle dispersion model FLEXPART (Stohl et al., 2005) and prod-ucts from spaceborne sensors like the TOMS aerosol index and GOME data. They report distinct anomalies in CO over Europe while the modification of the tropospheric aerosol
away from the source regions was not investigated in this study. The impact of wildfire emissions in Russia and East-ern Europe in 2002 on the PM2.5 aerosol load over Finland was discussed by Niemi et al. (2005). The authors reported an increase of particle number concentrations in the diame-ter range 90–500 nm, but a decrease of Aitken and nucleation mode particles with Dp<90 nm.
Transport processes and particle properties of the North American forest fire plumes from August 1998 were in-tensely studied by several groups. Forster et al. (2001) fo-cused on transport processes and reported pronounced haze layers and considerably enhanced CO mixing ratios above Europe after an average transport time of ∼=7 days from the source regions in Alaska and Canada. As part of the German Lindenberg Aerosol Characterisation Experiment LACE 98, Petzold et al. (2002) and Fiebig et al. (2002) studied a bo-real forest fire smoke plume, which was transported from the Northwest Territories, Canada, to Central Europe within about 6 days. They observed a pronounced accumulation mode at 340 nm in diameter, and absorption coefficients (λ=550 nm) of up to 20 Mm−1. In a succeeding study, Fiebig et al. (2003) demonstrated that aerosol ageing pro-cesses during transport may increase the solar radiative forc-ing of the plume by 20–40%. Similar investigations were also conducted for black carbon from biomass burning emis-sions over the Pacific (Clarke et al., 2001), and in the outflow of Southeast Asia (e.g., Clarke et al., 2004). In a very recent publication Clarke et al. (2007) report results from forest fire plumes studies over the Atlantic Ocean during the ICARTT experiment.
Observations and modelling efforts have demonstrated that long-range and even hemispheric-scale transport of for-est fire smoke plumes frequently occurs in the atmosphere. It influences atmosphere’s chemical composition, modifies the aerosol properties, and may cause significant effects on the radiative transport through the atmosphere and thus on climate. For instance, the smoke can lead to a significant cooling at the surface (Robock, 1991). Although BC from extratropical biomass burning contributes only 2.9% to the global annual BC emissions (Streets et al., 2004) its effects on atmospheric radiative properties can be significant from regional (Hsu et al., 1999; Stohl et al., 2006) to almost hemi-spheric (Fiebig et al., 2003; this paper) scales. Additional to these direct radiative effects, BC from industrial sources as well as from forest fires may suppress rainfall and modify the hydrological cycle (e.g., Rosenfeld, 2000; Andreae et al., 2004). For the quantification of the radiative forcing due to aerosols, for the assessment of heterogeneous processes with respect to atmospheric chemical composition changes, and for the validation of aerosol products from space-borne sen-sors such as aerosol optical depth, information on the effects of transformation and mixing processes on forest fire aerosol properties during long-range transport is urgently needed.
The fire season of summer 2004 set a new record of 2.7 million hectare burnt in Alaska and 3.1 million hectare burnt
in Canada (Stohl et al., 2006; Pfister et al., 2006) which is more than 10 times as much as the long-term average. For the boreal regions of North America, van der Werf et al. (2006) estimated an annually averaged carbon emission of 90 Tg C (particulate plus gaseous carbonaceous compounds) which is close to the maximum value of 93 Tg C yr−1for the 1998 fire season in North America. The long-range trans-port of particles emitted during the fire season 2004 signif-icantly modified the aerosol loading of the free troposphere (Damoah et al., 2006) and enhanced UT/LS (upper tropo-sphere/lowermost stratosphere) aerosol extinction by a factor of four relative to conditions almost unperturbed by strong fire plumes. During this burning season the station Bar-row, Alaska, which is approximately 1000 km away from the source, was affected by several smoke plumes with one leading to an aerosol absorption coefficient of 32 Mm−1and an estimated aerosol optical depth (AOD) of 4–5 (Stohl et al., 2006). However, forest fire smoke plumes affect atmo-spheric conditions not only by adding particulate matter but also by modifying atmospheric chemistry. Measurements in one smoke plume in summer 2004 showed an ozone increase of 17 ppbv over 5 days together with a significant decrease in CO (Real et al., 2007). Following Pfister et al. (2006), the fires increased the ozone burden near the surface over Alaska and Canada during summer 2004 by about 7–9% and over Europe by about 2–3%.
As a fortunate coincidence in summer 2004 the experiment on the Intercontinental Transport of Ozone and Precursors (ITOP) was conducted over Europe. ITOP formed the Eu-ropean part of the International Consortium on Atmospheric Research on Transport and Transformation (ICARTT) exper-iment with its main emphasis on pollutant outflow from the US East coast towards the Atlantic Ocean. As part of the ICARTT-ITOP field study, the IGAC Lagrangian 2K4 exper-iment was performed with its aim of making several sam-plings in pollutant plumes transported across the North At-lantic. Airborne in situ measurements on aerosols and trace gases were performed by means of the German Falcon 20 E-5 research aircraft at the European west coast. Whereas dur-ing the LACE 98 study in 1998, one sdur-ingle North American forest fire plume was sampled by lucky coincidence, in the course of the ICARTT-ITOP 2004 study systematic investi-gations of forest fire plume properties were possible. As one of the most important improvements compared to the 1998 studies an extensive combination of aerosol and trace gas in-struments was operated on board of the Falcon so that for the 2004 plumes aerosol microphysics, aerosol optics, ex-cess CO, NOy, and O3 data are available. In addition to the airborne in-situ data, data from two long-term monitor-ing ground sites in Central Europe (Hohenpeissenberg Ob-servatory: 989 m a.s.l., 47◦48′N, 11◦0′E; Jungfraujoch Ob-servatory: 3580 m a.s.l., 46◦33′N, 7◦59′E) were used to in-vestigate the influence of the forest fire smoke plumes on the aerosol properties in the FT and CBL of Central Europe and to estimate the conditions of the European FT aerosol in the
absence of strong forest fire plumes which defined a kind of reference “background” state. Model results using the ECHAM/MADE global climate model (Lauer et al., 2005) added a further view on the European BC background con-ditions. FLEXPART data (Stohl et al., 2005) were used to identify fire plumes and to estimate their transport times.
The observations of summer 2004 smoke plumes are pre-sented and discussed in this paper. From the extensive data set, we quantify the perturbation of free tropospheric aerosol above Europe by forest fire smoke plumes from North Amer-ica. Particular emphasis is put on the BC load, aerosol size distributions and optical properties, and particle removal pro-cesses during long-range transport. Modifications of aerosol properties during transport are discussed on the basis of re-cent emission data on chemical species (Martins et al., 1996; Andreae and Merlet, 2001) and particle microphysical and optical properties for fresh and aged smoke plumes (Reid et al., 2005a, b; Dentener et al., 2006). Effects of the Sum-mer 2004 forest fire smoke plumes on photochemistry are discussed by Real et al. (2007).
2 Methods
2.1 The ITOP study – research flights
From 19 July to 3 August 2004 a set of research flights was conducted in the framework of the ICARTT-ITOP study. The German Falcon 20 E-5 research aircraft was operating from the airport of Creil (49◦15.6′N, 2◦31′E) north of Paris in
France. Measurement flights were performed near the Eu-ropean west coast probing the entire tropospheric column from the boundary layer to the upper free troposphere at about 11 km a.s.l. Figure 1 gives an overview over all per-formed research flights. The symbols indicate forest fire smoke plume encounters. Additional to the Falcon operation bases Oberpfaffenhofen (OP) and Creil, the mountain obser-vatories Jungfraujoch (JFJ) in the Swiss Alps and Hohenpeis-senberg (HP) in Bavaria, Germany, are marked. Table 1 sum-marises information on the conducted research flights. The areas in which forest fore smoke plumes were traversed are given as average latitude/longitude coordinates of the plume profile.
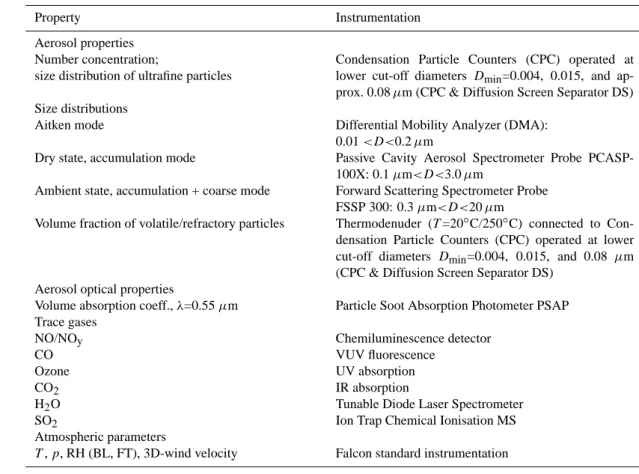
On board of the DLR research aircraft Falcon, a compre-hensive set of instruments was operated for the in situ mea-surement of aerosol microphysical properties and trace gas mixing ratios, see Table 2 for details. In summary, the aerosol instrumentation consisted of six Condensation Particle Coun-ters (CPC) set to different lower cut-off diameCoun-ters (Schr¨oder and Str¨om, 1997), Diffusion Screen Separators (Feldpausch et al., 2006), one Differential Mobility Analyser (DMA), one thermodenuder with two channels set to 20◦C and 250◦C (e.g., Engler et al., 2006), two optical particle counters of types Passive Cavity Aerosol Spectrometer Probe (PCASP 100X) and Forward Scattering Spectrometer Probe (FSSP
-15 -10 -5 0 5 10 15 20 35 40 45 50 55 60 HP JFJ Creil OP la ti tu d e , d e g N longitude , deg E
Fig. 1. Map of ITOP flights and measurement sites:
Oberpfaffen-hofen (home base DLR Falcon), OP; Creil (operation base ITOP); Hohenpeissenberg, HP; Jungfraujoch JFJ; open diamonds represent forest fire smoke plume encounters. Performed flights are grouped according to 19 July (dashed), 22–23 July (solid), 25 July, and 26, 30, and 31 July (short dashed).
300), and one Particle Soot Absorption Photometer (PSAP; Bond et al., 1999).
The combination of CPC and Diffusion Screen Separators with a DMA instrument and several optical particle spec-trometers covered the entire size range from smallest parti-cles in the nucleation mode (Dp<0.01 µm) to coarse mode
particles in the far super-micron size range. The probed size range included optically active background Aitken and ac-cumulation mode particles (0.05 µm<Dp<1–2 µm), coarse
mode dust or sea salt particles (Dp>1 µm) and particle sizes
relevant for particle formation processes (Dp<0.02 µm).
The non-volatile fraction in the sub-micron aerosol and the aerosol absorption coefficient were measured as well. Trace gas data relevant for this study were CO and H2O. Particu-larly CO is a very valuable tracer for smoke plumes emitted from fires. The terminus excess CO (1CO) describes the CO above an average “unperturbed” profile. This enhanced CO above the “unperturbed” value is associated to fire plumes. The method for the determination of 1CO is described in the Appendix.
The use of volumetric units and aerosol modes throughout the paper requires explanation. If number or mass concen-trations or aerosol absorption coefficients refer to standard temperature and pressure conditions STP (273 K, 1013 hPa), they are given as particles per standard cm3 (scm−3), µg per standard m3 (µg sm−3), and absorption per standard Mm (sMm−1, 10−6sm−1). These concentration data cor-respond to mixing ratios which do not depend on the re-spective pressure and temperature during the measurement. Otherwise concentration data refer to ambient conditions. The aerosol population is subdivided intro nucleation mode
Table 1. Research flights performed during the ITOP core phase.
Mission ID Date UTC FF smoke plumes Location of FF encounters 040719A 19 July 2004 09:23–10:47 no 040722A 22 July 2004 09:40 – 10:57 4–9 km 48.66◦N 42.42◦N 0.37◦E 9.83◦W 040722B 22 July 2004 15:05–17:03 3–7 km 42.93◦N 43.48◦N 48.48◦N 8.35◦W 7.96◦W 2.73◦W 040723A 23 July 2004 12:11–16:02 3–6 km 48.70◦N 48.39◦N 0.89◦E 0.38◦E 040725A 25 July 2004 13:37–16:40 3–5 km 49.92◦N 2.12◦E 040725B 25 July 2004 17:42–19:53 3–5 km 49.36◦N 1.24◦E 040726A 26 July 2004 15:07–18:50 3–4 km 49.41◦N 5.06◦W 040730A 30 July 2004 15:00–18:35 3–8 km 49.00◦N 49.33◦N 0.54◦E 0.87◦E 040731A 31 July 2004 12:07–13:55 no
Table 2. Instrumentation on board the research aircraft Falcon during ITOP 2004.
Property Instrumentation
Aerosol properties Number concentration;
size distribution of ultrafine particles
Condensation Particle Counters (CPC) operated at lower cut-off diameters Dmin=0.004, 0.015, and
ap-prox. 0.08 µm (CPC & Diffusion Screen Separator DS) Size distributions
Aitken mode Differential Mobility Analyzer (DMA):
0.01 <D<0.2 µm
Dry state, accumulation mode Passive Cavity Aerosol Spectrometer Probe PCASP-100X: 0.1 µm<D<3.0 µm
Ambient state, accumulation + coarse mode Forward Scattering Spectrometer Probe FSSP 300: 0.3 µm<D<20 µm
Volume fraction of volatile/refractory particles Thermodenuder (T =20◦C/250◦C) connected to Con-densation Particle Counters (CPC) operated at lower cut-off diameters Dmin=0.004, 0.015, and 0.08 µm
(CPC & Diffusion Screen Separator DS) Aerosol optical properties
Volume absorption coeff., λ=0.55 µm Particle Soot Absorption Photometer PSAP Trace gases
NO/NOy Chemiluminescence detector
CO VUV fluorescence
Ozone UV absorption
CO2 IR absorption
H2O Tunable Diode Laser Spectrometer
SO2 Ion Trap Chemical Ionisation MS
Atmospheric parameters
T, p, RH (BL, FT), 3D-wind velocity Falcon standard instrumentation
particles NUC with Dp<14 nm, Aitken mode particles AITK
with 14 nm<Dp<100 nm, and accumulation mode particles
ACC with 0.1 µm<Dp<3.0 µm. Details of the data analysis
procedure are given in the Appendix.
2.2 The ITOP study – mountain observatories
Long-term information on the aerosol loading over Cen-tral Europe in summer 2004 was obtained from two ground sites. At the GAW (Global Atmosphere Watch
Program of WMO) observatories Jungfraujoch (http:// gaw.web.psi.ch/), operated by Paul Scherrer Institute PSI (CH) and Hohenpeissenberg (http://www.dwd.de/de/FundE/ Observator/MOHP/MOHP.htm), operated by the German Weather Service DWD, aerosol absorption is measured con-tinuously by means of a Multi-Angle Absorption Photometer (MAAP) (Petzold and Sch¨onlinner, 2004) which provides re-liable absorption coefficient data (Sheridan et al., 2005; Pet-zold et al., 2005). The MAAP is operated on Jungfraujoch since March 2003 and on Hohenpeissenberg since spring 2004. The aerosol absorption coefficient σap at a
wave-length λ=550 nm can be converted to an equivalent BC mass concentration BCe using a mass-specific absorption
cross-section of 8 m2g−1 (Bond and Bergstrom, 2006). The ter-minology equivalent BC follows a recommendation by An-dreae and Gelencser (2006), since this BC value is derived from optical measurements and requires the assumption of a certain mass-specific absorption cross-section. As is dis-cussed by Andreae and Gelencser (2006) and by Bond and Bergstrom (2006), the value for the mass-specific absorption cross-section may vary between 8 and 10 m2g−1for fresh and aged carbonaceous particles, respectively. BCe values
may be lowered by a factor of 1.25 if a mass-specific ab-sorption cross-section of 10 m2g−1is used for an internally mixed and aged aerosol (Andreae and Gelencser, 2006; Bond and Bergstrom, 2006).
The high-alpine station Jungfraujoch is the scientific ob-servatory at highest elevation (3580 m a.s.l.) within Europe, probing European background free tropospheric air in fall and winter while in summer air from the CBL can be lifted up to the Jungfraujoch observatory by means of convection (Baltensperger et al., 1997; Nyeki et al., 2000). Hohenpeis-senberg at an elevation of 989 m a.s.l. is situated in the CBL almost all over the year. Within the GAW network it is de-fined as one Central European background site. The time series of σap and BCe measured at the mountain
observa-tories are used in the following (1) for estimating the free tropospheric background values for σapand BCe, and (2) for
answering the question how far the North American forest fire smoke plumes penetrated into the European continental boundary layer.
2.3 The Lagrangian Dispersion Model FLEXPART
For investigating the smoke plume transport processes, we used both forward and backward simulations with the La-grangian particle dispersion model FLEXPART (Stohl et al., 1998, 2005). As the model simulations have already been described in detail by Stohl et al. (2006), only a brief de-scription is given here. FLEXPART releases so-called tracer particles at emission sources and calculates their trajecto-ries using the mean winds interpolated from the meteorolog-ical input field plus random motions representing turbulence. Moist convective transport is considered. For the boreal for-est fires, an emission inventory was constructed from daily
MODIS fire hot spot detection and daily fire reports. This inventory was then used to calculate a passive (no deposition processes, no chemistry) carbon monoxide (CO) tracer for-ward in time, which was converted into a BC tracer by using emission ratios between CO and BC taken from Andreae and Merlet (2001).
In addition, we ran FLEXPART backward in time (see Stohl et al., 2003, for a description) from a large number of short segments along the Falcon flight track. The resulting potential emission sensitivity function can be interpreted in a similar way as traditional back trajectory calculations but is based on a full dispersion model, including parameterised turbulent and convective transport. Together with the emis-sion inventory, it can also be used to estimate the spatial dis-tribution of emissions contributing to the measured BC along the flight track.
2.4 The Aerosol-Climate Model ECHAM/MADE
To gain information on the vertical distribution of BC over Central Europe for years with normal to low fire activ-ities in North America an Siberia, we used the aerosol-climate model ECHAM/MADE. The coupled model system ECHAM/MADE consists of two main components, the gen-eral circulation model (GCM) ECHAM4 and the aerosol dy-namics model MADE. Details on the model system and tech-niques used can be found in (Lauer et al., 2005) and the references therein. The ECHAM4 GCM (R¨ockner et al., 1996) is a spectral model. The horizontal resolution applied in this study is T30, which corresponds to a Gaussian grid of about 3.75◦×3.75◦ (longitude by latitude). The
atmo-sphere is divided into 19 vertical layers from the surface up to 10 hPa (∼30 km) using a hybrid σ -p coordinate system. ECHAM4 uses a semi-Lagrangian advection scheme (Rasch et al., 1990). The ECHAM version applied in this study in-cludes two major upgrades compared to the standard version of the GCM: extended cloud microphysics (Lohmann et al., 1999) and an aerosol module describing the mass concentra-tions of several aerosol species (Feichter et al., 1996). This aerosol module is used to drive the cloud and the radiation scheme of the GCM.
Aerosol dynamics are represented by the submodule MADE (Ackermann et al., 1998) which describes the aerosol size-distribution by the sum of three log-normally distributed modes, the Aitken (typically smaller than 0.07 µm), accumu-lation (about 0.07–1 µm) and coarse mode (particles larger than 1 µm). All particles are assumed to be internally mixed. Aerosol components considered are SO4, NH4, NO3, BC, organic matter (OM), sea salt, mineral dust, and aerosol liq-uid water in the two sub-micron modes. The coarse mode consists of mineral dust, sea salt, and aerosol liquid wa-ter. In addition to the mass concentration of the individual aerosol components, particle number concentration and the median particle diameter of each mode are calculated ex-plicitly, taking into account coagulation, nucleation and
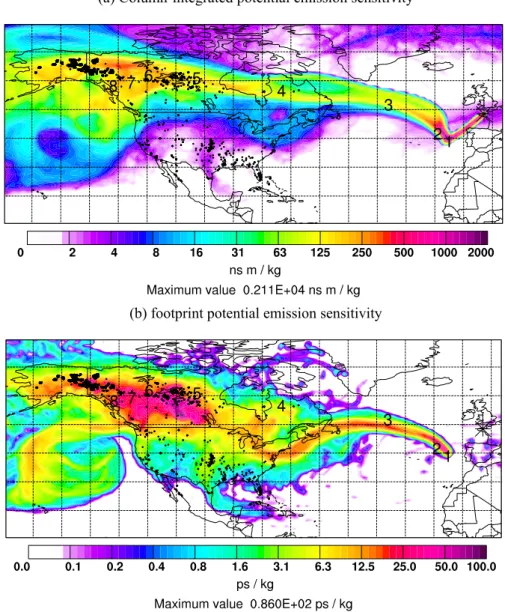
con-(a) Column-integrated potential emission sensitivity 1214
(b) footprint potential emission sensitivity 1217
Figure 2. Retroplume results from the backward simulation for flight 040722B from 16:22:02 to
Fig. 2. Retroplume results from the backward simulation for flight 040722B from 16:22:02 to 16:23:18 UTC. Shown are (a) the
column-integrated PES and (b) the footprint PES. Dots identify fire hot spots detected by MODIS, numbers along the plume refer to transport times in days since emission.
densation of sulphuric acid vapour, size-dependent wet and dry deposition, emission of primary particles, aerosol chem-istry, gas/aerosol partitioning, and cloud processing. In the MADE version applied here, the geometric standard devia-tion (GSD) of the modal size distribudevia-tions is kept constant using GSD=1.7 for the Aitken mode, GSD=2.0 for the accu-mulation mode, and GSD=2.2 for the coarse mode.
Recent analyses of total carbon emissions from boreal wildland fires showed that year 2000 emissions were 22% below average emissions for the period 1992–2003 (Kasis-chke et al., 2005; van der Werf et al., 2006). Referring to the period from 1997 to 2004, emissions from large-scale
wild-land burning in boreal areas were highest in 1998 and 2004, and lowest in 2000 and 2001 (van der Werf et al., 2006). Year 2000 can therefore considered a reference year with normal to low boreal fire emissions. The ECHAM/MADE runs used year 2000 emissions for biomass burning (BC, particulate or-ganic matter POM, SO2)and follow the AeroCom recom-mendations (Dentener et al., 2006). This emission data set includes large-scale wildfire emissions which are based on the studies of van der Werf et al. (2004) on the continental-scale partitioning of wildfire emissions for the period from 1997 to 2001.
3 Results
3.1 The smoke plume from 22–23 July 2004
During two flights on 22 July from Creil (France) to Santi-ago (Spain) and back and on July 23 from Creil to the English Channel and back, an aerosol plume emitted from strong bo-real forest fires in Alaska was probed at altitudes between 3 and 6 km a.s.l., see also Fig. 1. FLEXPART backward analy-ses are used to estimate the contribution of smoke aerosols to the observed plume. The results suggest a dominant fraction of forest fire aerosol in the sample. For a short sequence of the encountered smoke plume, its source region is shown in Fig. 2 in terms of a column-integrated potential emission sen-sitivity from a FLEXPART backward simulation for the anal-ysed Falcon flight track with superimposed MODIS fire hot spot locations. The value of the potential emission sensitivity function (PES; Stohl et al., 2003) in a particular grid cell in units of s kg−1is proportional to the plume residence time in that cell. It is a measure for the simulated mixing ratio at the receptor that a source of unit strength in the respective grid cell would produce. The footprint PES corresponds to a layer extending from 0–100 m above ground. The PES integrated over the entire atmospheric column (Fig. 2a) illustrates the pathway of the polluted air mass. The footprint PES plot (Fig. 2b) suggests that the vast majority of emissions con-tributing to the plume probed by the Falcon on 22 July were released from fires in Alaska and Northwest Canada about 5–8 days prior to measurement. Upstream the fire regions no significant contributing source is found. The source region does not differ significantly, if other sequences of the plume encounter are analysed.
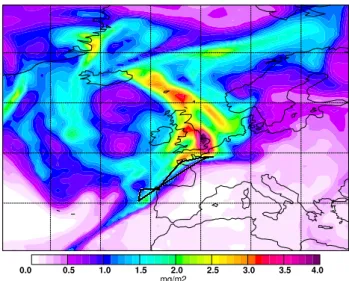
Figure 3 gives an overview map of the plume event of 22 July based on a FLEXPART forward simulation. We used a constant ratio of BC/1CO=5.2 mg BC (g 1CO)−1for boreal fire emission conditions (Andreae and Merlet, 2001) in order to illustrate the BC columnar loads across the smoke plume event. All biomass burning emissions over North America were taken into account for this simulation, and particles were carried in the model for 30 days. It can be taken from Fig. 3, that the Falcon plume encounters at the northern did not probe the core of the plume.
Forward trajectories and BC monitoring data from the mountain sites indicate that a part of this plume crossed the high-alpine research station Jungfraujoch about 36 h after be-ing probed by the Falcon. In contrast, no plume signatures were observed in the BC record of the CBL background ob-servatory Hohenpeissenberg. It can be concluded that north of the Alps the plume was transported in the free troposphere over Central Europe without significant downward mixing.
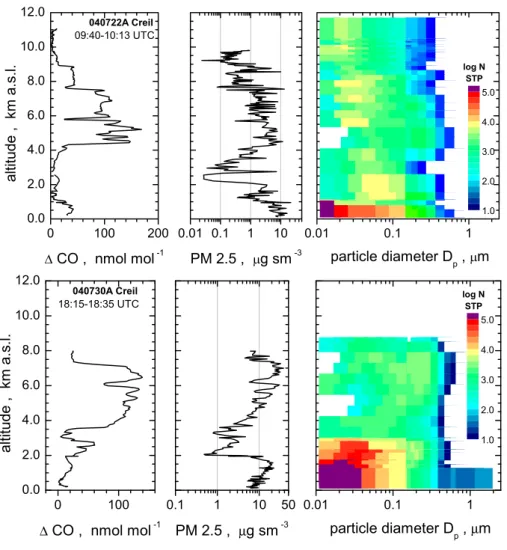
Figure 4 demonstrates two examples of the complex struc-ture of vertical aerosol profiles encountered during these long-range transport events. Plume ages inferred from FLEXPART are 7–9 days for the plume at 22 July and 4–6 days for the plume at 30 July. The profiles contain 1CO,
Fig. 3. Integral BC columnar load calculated from FLEXPART
analyses for 22 July 2004, 12:00 UTC; the Falcon flight tracks for flights 040722A and 040722B are shown by the black solid lines.
PM 2.5 mass concentration and aerosol size distributions from combined DMA and PCASP data. In both cases, the polluted CBL reaches up to an altitude of 2.0 km and is dom-inated by high PM 2.5 mass concentrations and high number densities in the NUC mode. From 4.0 km to approx. 8.0 km altitude, a clearly layered structure is observed which can be attributed to forest fire smoke plumes. All polluted layers in the FT are characterised by PM 2.5 values of similar magni-tude as in the CBL. Size distributions of the forest fire aerosol are dominated by a strong ACC mode while the NUC mode is almost entirely depleted. Such an absence of the NUC mode is here identified as one of the key properties characterising the aerosol in boreal forest fire plumes after 1–2 weeks of atmospheric transport. Details of the size distribution will be discussed later.
3.2 3.2 The European free troposphere for periods of nor-mal fire activity
An assessment of the perturbation of the FT aerosol above Europe by North American forest fire smoke plumes requires comparison data for a FT aerosol for periods without strong forest fire activities in the northern hemisphere. The ex-pected range of BC mass concentrations in the free and upper free troposphere is <1–10 ng m−3(Hendricks et al., 2004). The PSAP with its detection limit of approx. 0.1 sMm−1is not capable of measuring such low BCe levels with a time
resolution required for airborne studies. The recently intro-duced SP-2 instrument (Baumgardner et al., 2004) based on the technique of laser-induced incandescence may be appli-cable to this type of measurement. First intercomparison studies in the laboratory (Slowik et al., 2006) and airborne measurements (Schwarz et al., 2006) yield promising results.
0.0 2.0 4.0 6.0 8.0 10.0 12.0 0 100 0.01 0.1 1 log N STP 1.0 2.0 3.0 4.0 5.0 0.1 1 10 50 040730A Creil 18:15-18:35 UTC PM 2.5 , µg sm -3 a lt it u d e , k m a .s .l .
∆ CO , nmol mol -1 particle diameter Dp , µm
Fig. 4. Profiles of excess CO (left), particulate matter mass concentration for standard conditions PM 2.5 (mid), and particle size distribution
for standard conditions (right) for Creil on 22 July (ascent) and on 30 July (descent).
However, the instrument is not yet widely in use. The ver-tical profile of the aerosol absorption coefficient and the BC mass concentration for periods without strong fire activities have thus to be estimated by a different approach.
During various field studies conducted by DLR Institute of Atmospheric Physics in Central Europe in the years 2000 to 2002 (Minikin et al., 2003), the vertical distribution of non-volatile particles was measured for summer (UFA/EXPORT data) and late fall to winter (SCAVEX data) conditions. The field experiment UFA/EXPORT was conducted in July and August 2000 over Central Europe with flights from Switzer-land to Czech Republic and from Northern Italy to Northern Germany. Flights during the SCAVEX experiment took place from Oberpfaffenhofen in November 2002 in the vicinity of the Alps. Both experiments extended over three weeks and provided data from 20–25 flights hours. The vertical profiles of aerosol number concentrations were calculated by statisti-cal methods as median, 10-percentile and 90-percentile
val-ues for cloud-free flight sequences. No further separations according to meteorological conditions were made.
The presented extrapolation approach for a vertical profile of BC mass concentration at “clean” conditions with normal fire activities makes use of the fact that BC is part of the non-volatile aerosol fraction of the atmospheric aerosol. The only necessary key assumption for the FT and the UT/LS is that the BC mass concentrations vary with altitude sim-ilar to the number concentration of non-volatile particles, i.e., BCe/Nnonvol=constant. This key assumption is reason-able for the well-aged free tropospheric aerosol. It does of course not hold for the CBL where continuous input of non-volatile particles from surface sources is active. The FT background concentration of BCe can be extracted from
long-term records of BCe at the Jungfraujoch observatory
which is situated in the European FT during winter. Late fall to winter vertical profiles of Nnonvol from SCAVEX are combined with Jungfraujoch winter time data to get an
esti-mate for BCe/Nnonvol. The vertical profiles of Nnonvolfrom UFA/EXPORT representing Central European summer con-ditions are then combined with the constant ratio BCe/Nnonvol for the extrapolation of the BC mass concentration profile over Europe for summer conditions.
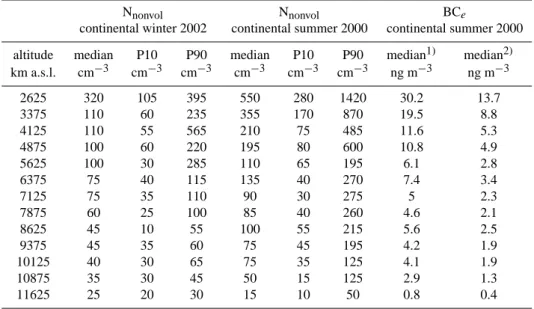
Analysing three winter time series (winter seasons 2003/2004, 2004/2005, and 2005/2006) of Jungfraujoch data, a minimum 24 h average BC mass concentration of 2.7 ng m−3and a 10-percentile value of 6.0 ng m−3are ob-tained. From airborne data for late fall to winter conditions the median Nnonvolvalue at the same altitude as the Jungfrau-joch observatory elevation of 3580 m a.s.l. is 110 cm−3 with 10-percentile and 90-percentile values of 60 cm−3and 235 cm−3. Table 3 summarises median number concentra-tions for the relevant altitude ranges of FT (5–7 km) and UT/LS (9–11 km) and the statistical analysis of the data used from field experiments and from the Jungfraujoch observa-tory.
For the determination of the FT value for BCe/Nnonvolthe 10-percentile value of the BC concentration at Jungfraujoch is assumed to be more robust than the minimum mass con-centration which may represent a unique event. Combin-ing the 10-percentile value for BCe of 6.0 ng m−3 with a
median value for Nnonvol of 110 cm−3 at the Jungfraujoch elevation results in BCe/Nnonvol=5.5×10−17g BC per non-volatile particle. Using the minimum BCe value, a ratio
BCe/Nnonvol=2.5×10−17g BC per non-volatile particle is ob-tained. These two ratios are used for the conversion of mea-sured vertical profiles of Nnonvol into profiles of BCe. The
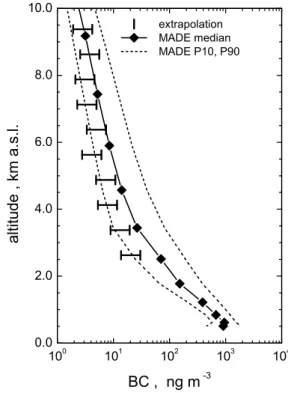
BC mass concentrations obtained by this approach are also compiled in Table 3 for Central European summer and win-ter conditions. The detailed profile data are summarised in Table 4 and plotted in Fig. 5.
Estimated BC mass concentrations span over a range of 3–6 ng m−3at FT (5–7 km a.s.l.) and 1–4 ng m−3at UT (9–11 km a.s.l.) altitude. The obtained BCe values are in
reasonable agreement with values estimated from SP-2 ob-servations (Schwarz et al., 2006) and with results from re-cent model studies (Hendricks et al., 2004). Hendricks et al. (2004) report a range of 0.1–10 ng m−3 for BC mass concentrations in the global UTLS region and >1 ng m−3 at northern midlatitudes, while Schwarz et al. (2006) mea-sured ≤2 ng m−3at approx. 6 km a.s.l. and <1 ng m−3at 10 km a.s.l. over Texas in November 2004.
As a final step, the BC mass concentration profile obtained from ECHAM/MADE for July/August 2000 over Cen-tral Europe (model grid section: 5.6◦E–13.1◦E, 44.5◦N–
52.0◦N) is compared to the profile estimated from FT field
data over Central Europe in July/August 2000. The result is shown in Fig. 5. The data from the extrapolation approach are shown as intervals per altitude. The bounding values are calculated from the minimum BCe(lower bound) and the
10-percentile BCe(upper bound) values for the determination of
the BC mass per non-volatile particle. Both BC profiles agree reasonably well at FT and UT altitudes. This gives rise to
0.0 2.0 4.0 6.0 8.0 10.0 100 101 102 103 104 extrapolation MADE median MADE P10, P90 a lt it u d e , k m a .s .l . BC , ng m -3
Fig. 5. Vertical profiles of the black carbon mass concentration (BC)
for unperturbed Central European summer conditions: lines and symbols refer to 10-percentile, 90-percentile, and median values from ECHAM/MADE for Central Europe in July/August 2000, hor-izontal bars indicate the BC mass concentration extrapolated from Jungfraujoch data and vertical profiles of non-volatile particles over Central Europe in July/August 2000.
the assumption that the vertical distribution of BCeas shown
in Fig. 5 is a valuable reference case for the assessment of the FT perturbations caused by the summer 2004 forest fire smoke plumes.
3.3 The vertical distribution of aerosols and trace gases during ITOP
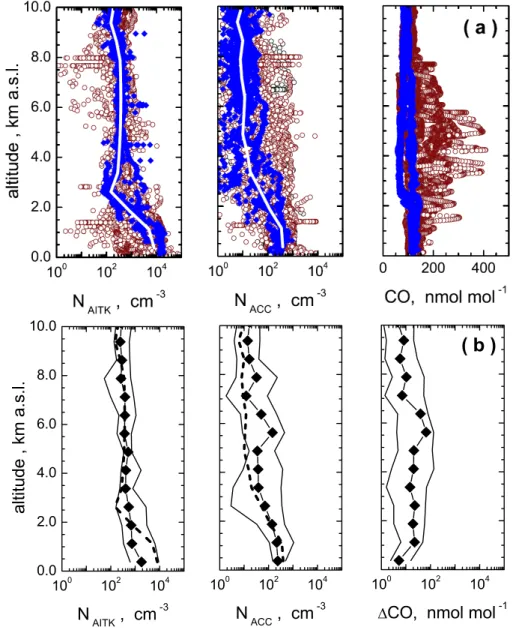
The vertical distribution of aerosol modes and CO during ITOP in summer 2004 is plotted in Fig. 6. In Fig. 6a all cloud-free aerosol data measured during ITOP are shown as 5 s averages. CO data are given with 1 s time resolu-tion. Brown symbols represent flights with forest fire smoke plume encounters while blue symbols refer to those flights without smoke plume encounters. In-cloud sequences are excluded since liquid water clouds may disturb the measure-ment of particle number concentrations. The white solid lines represent the median number concentrations for con-ditions without fire smoke plumes. The statistical analysis of the same data set is plotted in Fig. 6b as median, 10-percentile and 90-10-percentile vertical profiles. In contrast to Fig. 6a, the CO volume mixing ratio is represented as 1CO. Median number concentration profiles for conditions without fire smoke plumes are added as broken lines.
Table 3. Number concentration (N) of non-volatile particles in the upper free troposphere (UT) of the northern hemisphere (NH) and at the
level of the Jungfraujoch (JFJ) observatory, derived from vertical aerosol profiles, equivalent black carbon mass concentrations BCeat JFJ
and extrapolated to UT concentration levels; P10 and P90 refer to 10-percentile and 90-percentile values. Summer June–Aug Winter Dec–Feb Jungfraujoch, 3.5 km a.s.l. 24 h average BCe, ng m−3 Maximum 500 370 P90 278 89 Median 114 18.5 P10 32.6 6.0 Minimum 5.9 2.7 European FT/UT1) JFJ altitude, 3.5 km Nnonvol, cm−3, median (P10, P90) BCe, ng m−3, median (P10, P90) 350 (170–870) 19.2 (9.4–47.9) 110 (60–235) 6.0 (3.3–12.9) Free Troposphere, 5–7 km Nnonvol, cm−3 BCe, ng m−3 80–140 4.4–6.12) 60–100 3.3–5.52) Upper Troposphere, 9–11 km Nnonvol, cm−3 BCe, ng m−3 50–80 2.8–4.42) 25–40 1.4–2.22)
1)Summer data originate from the study UFA/EXPORT in July and August 2000, winter data originate from the study SCAVEX in November
2002 (Minikin et al., 2003).
2)Extrapolation uses a ratio of BC
e/Nnonvol=5.5×10−17g particle−1, based on Nnonvol(JFJ winter)=110 cm−3and BCe(P10)=6.0 ng m−3
of JFJ data.
Table 4. Vertical profile data for the free troposphere (FT) number concentration of non-volatile particles Nnonvoland equivalent BC mass
concentration BCe, derived from field data; reported data are median, 10-percentile (P10) and 90-percentile (P90) values of the analysed data
set; altitude bands are averaged over 750 m thickness.
Nnonvol Nnonvol BCe
continental winter 2002 continental summer 2000 continental summer 2000 altitude median P10 P90 median P10 P90 median1) median2) km a.s.l. cm−3 cm−3 cm−3 cm−3 cm−3 cm−3 ng m−3 ng m−3 2625 320 105 395 550 280 1420 30.2 13.7 3375 110 60 235 355 170 870 19.5 8.8 4125 110 55 565 210 75 485 11.6 5.3 4875 100 60 220 195 80 600 10.8 4.9 5625 100 30 285 110 65 195 6.1 2.8 6375 75 40 115 135 40 270 7.4 3.4 7125 75 35 110 90 30 275 5 2.3 7875 60 25 100 85 40 260 4.6 2.1 8625 45 10 55 100 55 215 5.6 2.5 9375 45 35 60 75 45 195 4.2 1.9 10125 40 30 65 75 35 125 4.1 1.9 10875 35 30 45 50 15 125 2.9 1.3 11625 25 20 30 15 10 50 0.8 0.4 1)BC
e/Nnonvol=5.5×10−17 g BC per non-volatile particle. 2)BC
Fig. 6. Vertical profiles of aerosol number concentrations and CO mixing ratios measured during ITOP: (a) Number concentrations of Aitken
(AITK), and accumulation (ACC) modes, and CO; flights with (without) smoke plume encounters are shown in brown (blue). (b) Median number concentrations of AITK and ACC modes, and excess CO (1CO); symbols represent median values, solid lines correspond to P10 and P90 values. White lines in (a) and dotted lines in (b) refer to the median profiles of AITK and ACC for flights without smoke plume encounters.
Significant differences between smoke plume profiles and non-smoke plume profiles occur in the altitude band between 3.0 and 8.0 km a.s.l. for 1CO, and for the ACC mode. For the ACC mode, the “unperturbed” median values is close to the 10-percentile value of the profiles influenced by smoke plumes, i.e., the deviation is statistically significant. In the case of 1CO, the deviation is not that strong, but the “unper-turbed” median value is still smaller than the 25-percentile value of the profiles influenced by smoke plumes. For the AITK mode no significant difference is found.
Thus, forest fire smoke plumes seem to have only a mi-nor impact on the AITK mode aerosol of the FT. For the ACC mode aerosol and 1CO the situation is different. A statistically significant enhancement of number concentra-tions compared to the data for non-smoke plume condiconcentra-tions is found for the altitude range of 5–6 km a.s.l. where the median values for non-smoke plume conditions are close to P10 values of smoke plume conditions. The increase in me-dian ACC mode number concentrations is of the order of one magnitude (factor 5–15). An almost similar distribution with altitude is found for 1CO where the largest values also occur at 5–6 km a.s.l.
0.0 2.0 4.0 6.0 8.0 10.0 12.0 0.01 0.1 1 10 σ ap
(@550) , Mm
-1a
lt
it
u
d
e
,
k
m
a
.s
.l
.
ITOP 2004 marine 0.01 0.1 1 10 LACE 1998 continental average σap σap < LOD FF max σap mountain site ECHAM 2000 σ ap(@550) , Mm
-1Fig. 7. Vertical profile of the aerosol absorption coefficient σapat λ=550 nm from constant-altitude averaged airborne data (open symbols),
forest fire smoke plume maximum airborne data (filled symbols), and data from mountain sites (circles): Jungfraujoch (3580 m a.s.l, av-erage winter; avav-erage summer), Zugspitze (2980 m a.s.l., summer 2000), Kleiner Feldberg (825 m a.s.l., fall 2000) and Hohenpeissenberg (998 m a.s.l., summer 2004). Filled symbols with drop lines identify levels where the PSAP was below its detection limit of 0.1 sMm−1. Data of the left panel refer to year 2004 ITOP measurements, data of the right panel refer to years 1998 (LACE 98) and 2000 (mountain sites). Solid and dashed lines refer to median and 10-percentile as well as 90-percentile values from ECHAM/MADE for continental Europe in July/August 2000 which were converted to σapvalues using a mass-specific absorption cross section of 8 m2g−1.
By far the largest perturbation of the FT aerosol is ob-served for the aerosol absorption coefficient σap. As is
dis-cussed in detail in the data analysis section, the PSAP ab-sorption coefficient data were interpreted only for constant-altitude flight sequences which sum up to more than 50 con-stant altitude levels during ITOP. The left panel of Fig. 7 summarises all σap data inferred from PSAP measurements.
Small symbols with drop lines correspond to levels with
σap being below the detection limit of the PSAP. We set
σap,min=0.1 sMm−1(see Appendix). The conversion of stan-dard to ambient conditions used measured pressure and tem-perature data. The error bars for levels with σap>σap,min rep-resent one standard deviation of the variability of σapfor the
analysed flight leg. Full symbols refer to 95-percentile val-ues for the respective flight legs. The σap values measured
at Jungfraujoch observatory during the forest fire plume en-counter and averaged over the period of May–July 2004 are added to Fig. 7. The values fit well into the picture of air-borne observations.
In the altitude range from 4 to 7 km, the forest fire smoke plumes enhance σap by a factor of 100 compared to year
2000 conditions simulated by ECHAM/MADE. Again, a mass specific absorption cross-section of 8 m 2 g−1 was used for the conversion of BC mass concentration to aerosol absorption. Inside the smoke plumes σap reaches
maxi-mum values of similar magnitude as have been measured in the urban pollution outflow from the greater Paris area
during the ITOP observation phase. The polluted CBL val-ues are also shown in the left panel of Fig. 7. On the other hand, polluted CBL values of σap are in good
agree-ment with the values calculated from ECHAM/MADE so that the model source terms for local pollution seem to match the observations. As expected data measured in the clean MBL deviate significantly from the ECAHM/MADE results for Central Europe towards smaller values. The data col-lected during the LACE 98 experiment (Petzold et al., 2002) south-east of Berlin, Germany, and from several mountain sites as Jungfraujoch, Zugspitze and Hohenpeissenberg sup-port the ECHAM/MADE: on the right panel of Fig. 7, FT data agree with the background vertical distribution from ECHAM/MADE, while the forest fire smoke plume observed during LACE 98 is of similar intensity as the plumes encoun-tered during ITOP in summer 2004. This in turn means that such strong forest fire smoke plume events as observed in 2004 are not that uncommon.
3.4 Forest fire aerosol properties
Table 5 compiles a sub-set of the analysed constant-altitude sequences which contains all flight sequences with forest fire smoke encounters, all free-tropospheric flight legs at clean and almost unperturbed conditions and a representative set of flight legs inside the polluted CBL near Creil. Forest fire smoke plumes were also encountered during ascent or
Table 5. Properties of probed atmospheric layers inferred from constant-altitude flight sequences1)for forest fire smoke plumes (FF), clean or almost unpolluted free troposphere (FT) and polluted continental boundary layer (CBL) levels.
Layer ID Start Time, Stop Time, Altitude, qv, g H2O 1CO, σap, Mm−1 BCe, PM 2.5, BCe/CO, BCe/PM 2.5,
UTC s of day UTC s of day km a.s.l. (kg air)−1 nmol mol−1 (550 nm) ng sm−3 µg sm−3 mg BC (g CO)−1 % FF peak data 040722aL5 11:39:15 11:40:25 3830 0.82 179 8.1 1609 21 7.5 7.7 040722aL6 11:41:35 11:42:45 3828 0.56 181 6.2 1238 21 5.7 5.9 040722bL4 16:20:20 16:24:20 5730 0.19 212 3.2 782 34 3.1 2.3 040722bL5 16:24:30 16:27:02 5731 0.17 158 3.5 837 27 4.4 3.1 040723aL42) 12:58:20 12:59:50 4795 1.04 185 7.7 1659 39 7.4 4.3 040723aL52) 13:01:40 13:03:35 4794 1.08 190 7.0 1505 39 6.9 3.9 040723aL62) 13:05:20 13:06:00 5418 1.56 146 4.9 1134 39 6.4 2.9 FT average data 040719aL2 10:23:45 10:31:20 4492 0.44 21 <0.1 n.d. 040722aL7 11:48:15 11:49:25 1938 4.32 6 0.3 44 0.8 5.6 040722bL2 15:58:20 16:01:40 4159 0.27 35 <0.1 n.d. 5 040722bL3 16:05:40 16:10:40 1953 5.02 22 0.8 132 1.4 4.9 040723aL2 12:44:35 12:47:50 2915 3.98 14 0.5 85 9 4.9 040723aL7 13:22:20 13:42:10 8240 0.274 33 <0.1 n.d. 5 040725aL2 15:05:50 15:11:00 8522 0.206 1 <0.1 n.d. 040725bL2 18:30:00 18:34:10 4788 2.13 6 <0.1 n.d. 040725bL5 18:50:10 18:51:32 8602 0.25 10 <0.1 n.d. 040726aL1 15:19:10 16:15:00 5007 1.79 25 <0.1 n.d. CBL average data 040722bL6 16:50:20 16:52:40 1950 9.9 19 2.8 456 17.5 19.9 040722bL7 16:55:00 16:56:40 1626 10.1 32 4.2 662 18 16.9 040722bL8 16:56:40 17:02:50 830 10.61 27 5.8 853 18 26.2 040723aL0 15:55:50 16:03:45 698 9.8 35 4.5 654 20 15.6 Emission3) 5.2±2.5 4.3±2.5
1)The compiled data represent a sub-set of all 54 constant-altitude flight legs probed during ITOP, all forest fire smoke plumes are
rep-resented, FT and BL levels are shown exemplary; equivalent black carbon BCeis calculated from σapusing a mass-specific absorption
cross-section of 8 m2g−1; PM 2.5 is calculated from number size distributions assuming a density of 1400 kg m−3and spherical particle shape; a value of 10 m2g−1reduces the ratio BCe/PM 2.5 by 20%; n.d. → not detected.
2)Lagrangian forest fire plume case with DC 8 (18 July) and BAe 146 (20 July) (Methven et al., 2006). 3)Data taken from Andreae and Merlet (2001).
descent of the aircraft. Since for those levels with varying pressure, the absorption coefficient is not available, these se-quences are not considered here. However, size distributions measured during these smoke plume profiles are added to Ta-ble 6.
3.4.1 Microphysical properties
The properties of forest fire smoke particles can be repre-sented in a multi-dimensional parameter space. The key parameter combinations investigated here are (1) the num-ber concentration of Aitken mode vs. numnum-ber concentra-tion of accumulaconcentra-tion mode, (2) the mixing state of Aitken mode vs. accumulation mode expressed as the fraction of particles containing non-volatile cores for each mode, (3) 1CO vs. [Nnonvol AITK/NAITK]×[NACC/NTOTAL], with [Nnonvol AITK/NAITK]×[NACC/NTOTAL]→1 for an internally mixed aerosol which is dominated by the ACC mode, and (4) the thermodynamic properties of the forest fire smoke plumes expressed as specific humidity qvand equivalent
po-tential temperature θe.
Figure 8 shows the distribution of parameter combina-tions for all aerosol populacombina-tions observed during ITOP in the “clean” FT and UT (filled grey symbols) and for the peak forest fire smoke plumes (black symbols). The forest fire smoke aerosol represents an extreme case for each investi-gated aerosol microphysical parameter combination when all ITOP data are considered:
– Figure 8, top left panel: Forest fire smoke par-ticles cluster along the 1:1 line with respect to (NNUC+NAITK)vs. NACC, while the bulk data set satis-fies (NNUC+NAITK)≥10×NACC, i.e., forest fire particles are enriched in the accumulation mode while nucleation and Aitken mode are depleted (top left panel).
– Figure 8, bottom left panel: Aged forest fire
parti-cles cluster at fNonvol,AITK∼=1 and fNonvol,ACC∼=1. Al-most all particles contain a non-volatile core even in the Aitken mode size range with non-volatile fractions close to unity, i.e., all particles are entirely internally mixed.
Table 6. Size distribution parameters number concentration N, count median diameter CMD, geometric standard deviation GSD of
accumu-lation and coarse mode forest fire aerosols; data refer to ITOP and LACE 98 observations and near-source size distributions recommended for global climate models (Dentener et al, 2006; Reid et al., 2005b); plume age τ from FLEXPART analyses is added for the ITOP cases.
Type of aerosol N, cm−3 CMD, µm GSD Reference
North American Flaming (Einfeld et al., 1991)
Mode 1 10000 0.118 1.6 Fresh emissions
Mode 2 2.5 1.20 1.8
Mode 3 0.7 3.0 1.8
North American Smoldering (Einfeld et al., 1991)
Mode 1 2681 0.180 1.5 Fresh emissions
Mode 2 4 1.20 2
Mode 3 1.7 3.30 1.8
North American Young (Radke et al., 1991)
Mode 1 70000 0.010 1.87
Mode 2 160 000 0.150 1.62
Mode 3 1.95 1.20 1.85
North American Young (Reid et al., 2005a)
Fine mode 0.16±0.03 1.7±0.1
North American Aged (Reid et al., 2005a)
Fine mode 0.20±0.03 1.55±0.2
LACE 98 aged lower layer (Fiebig et al., 2003)
Mode 1 410±60 0.057±0.01 2.0±0.3
Mode 2 250±100 0.34±0.03 1.35±0.1
Mode 3 0.7±1.0 0.9±0.7 1.9±0.5
LACE 98 aged upper layer (Fiebig et al., 2003)
Mode 1 400±50 0.050±0.01 2.0±0.3
Mode 2 220±60 0.23±0.02 1.45±0.1
Mode 3 1.0±1.0 1.0±0.3 1.7±0.3
040722AL5L6 this study, τ =6–9 d
Mode 1, STP 1600 0.065 1.60 Mode 2, STP 750 0.26±0.02 1.30±0.05 Mode 3, STP 15 0.35 1.80 040722BL4L5 this study, τ =6–9 d Mode 1, STP 950 0.080 1.60 Mode 2, STP 900 0.27±0.02 1.31±0.05 Mode 3, STP 15 0.6 1.90
040723AL4L6 this study, τ =7–10 d
Mode 1, STP 900 0.090 1.40
Mode 2, STP 800 0.30±0.02 1.30±0.05
Mode 3, STP 16 0.6 1.90
040725B profile this study, τ =6–9 d
Mode 1, STP 890 0.078 1.56
Mode 2, STP 350 0.26 1.31
Mode 3, STP 6 0.47 1.75
040726A this study, τ =10–13 d
Mode 1, STP 1800 0.065 1.64
Mode 2, STP 500 0.27 1.32
Mode 3, STP 14 0.47 1.82
040730A profile this study, τ =4–6 d
Mode 1, STP 1300 0.085 1.90
Mode 2, STP 850 0.23±0.02 1.39±0.05
270 280 290 300 310 320 330 340 100 101 102 103 104 105 100 101 102 103 104 105 FT (> 2 km a.s.l.) FF smoke (FLEXPART) N N U C + N A IT K , s c m -3 N ACC , scm -3 1E-40 1E-3 0.01 0.1 1 50 100 150 200 250 300 ∆ C O , n m o l m o l -1 f
Nonvol AITK x [ N ACC / N TOTAL ]
0.0 0.5 1.0 0.0 0.5 1.0 f Nonvol, ACC f N o n v o l, A IT K
1E-5 1E-4 1E-3 0.01 0.1
forest fire peaks median qv-θe profile saturation line specific humidity q v e q . p o te n ti a l te m p . θ e , K
Fig. 8. Properties of forest fire aerosols compared to the entire ITOP FT aerosol data set; top left: number concentration of nucleation (NUC)
and Aitken (AITK) mode vs. accumulation mode (ACC); bottom left: non-volatile fraction of Aitken mode vs. accumulation mode; top right: excess CO (1CO) vs. fraction of non-volatile AITK particles times number fraction of ACC mode; bottom right: thermodynamic properties of aerosol layers. Free troposphere (FT) data (2–8 km) outside of smoke plumes are neglected since no clear separation from air masses inside of smoke plumes was possible.
– Figure 8, top right panel: Smoke plume char-acteristics like a dominant ACC mode with NACC∼=NNUC+NAITK combined with an internal mixture with fNonVol,AITK∼=fNonVol,ACC∼=1 are always associated with high values of 1CO.
– Figure 8, bottom right panel: When plotting all
mea-sured 5s averaged data in a parameter space spanned by specific humidity qv and equivalent potential
tem-perature θe, the forest fire aerosol peak data line up at
the lower bound of the qv data set (Fig. 8 bottom right
panel). The solid line in the bottom right panel of Fig. 8 represents the median θe−qv line for all flights
analo-gous to the median aerosol profiles shown in Figs. 6a and b. Forest fire plumes occur in air that is much drier and colder than the median profile of ITOP observa-tions. Data points with higher 1CO likely have lower
qv since these represent plumes that have experienced
less mixing across the Atlantic.
3.4.2 BC fraction of PM 2.5
Following a detailed report on the chemical composition of North American boreal forest fire particles from the SCAR-C (Smoke, SCAR-Cloud and Radiation) experiment, BSCAR-C contributes 5% (smoldering) to 10% (flaming) by mass for fresh (<1 day) smoke aerosol (Martin et al., 1996). Total carbon con-tributes between 50 and 100% to total particulate matter. For temperate wildfires, BC and total carbon (organic plus black carbon) contribute 4–10% and 50–90%, respectively, to PM 2.5 mass (Andreae and Merlet, 2001; Reid et al., 2005a).
During our studies, no chemical data of the smoke par-ticles were collected. An estimated of the BCe fraction of
total mass is obtained from an analysis of the measured par-ticle size distributions. PM 2.5 mass concentrations are cal-culated from the parameterised particle size distributions as-suming spherical particles of density of 1400 g m−3(Reid et al., 2005a). The results are added to Table 5. The BC mass concentration is reduced by 20% if a mass-specific absorp-tion cross-secabsorp-tion of 10 m2g−1instead of 8 m2g−1is used
10-3 10-2 10-1 100 101 10-2 10-1 100 101 102 103 104 10-3 10-2 10-1 100 101 particle diameter D p , µm 040730A (18:16:45-18:17:55) CPC DMA PCASP (c) 10-3 10-2 10-1 100 101 particle diameter Dp , µm 040722B (16:20:36-16:23:46) CPC DMA PCASP FT BGD (b) d N / d l o g D p , s c m -3 particle diameter D p , µm 040722A (11:38:15-11:44:25) CPC DMA PCASP FT BGD (a)
Fig. 9. Composite size distributions in forest fire smoke plumes determined from data of Condensation Particle Counters (CPC), a Differential
Mobility Anylaser (DMA), and a Passive Cavity Aerosol Spectrometer Probe (PCASP); mission ID and UTC are given in each plot. Solid lines represent multi-modal log-normal size distributions fitted to the measured data, while the dashed line represents a respective size distribution in the clean UT for the data from 22 July.
for the calculation of BCe from σap. BC contributes 2–4%
to PM 2.5 mass, except for the two plumes encountered on Flight 040722A, where BC contributes 6–8%. For the ITOP fire smoke plumes which reached Europe on 22–23 July, the BCefraction of PM 2.5 is at the lower boundary of values
re-ported for emission conditions. In a very recent publication on the properties of forest fire smoke plumes measured dur-ing ICARTT 2004 by the US teams on board of the NASA DC8, Clarke et al. (2007) report an average BC mass frac-tion of approx. 3% for aged forest fire smoke particles. Their observations which are based on the chemical analysis of par-ticle samples are in very good agreement with our estimates from size distribution data.
3.4.3 Size distributions and optical properties
Figure 9 shows examples of dry size distributions measured during various ITOP forest fire smoke plume encounters on 22 July and 30 July 2004. The size distributions originate from the combined analysis of CPC, DMA and PCASP 100X instrument data. Because the air masses were very dry (rela-tive humidity <20%) no hygroscopic shift was applied to the size distributions. The plumes probed on 22 July were the densest forest fire plume encountered during ITOP with an age of 7–9 days estimated from FLEXPART analyses. The plume probed on 30 July represents a younger plume of an approximate age of 4–6 days after emission. Unfortunately, only size distribution data exist since the plume on 30 July was traversed during decent to the airport of Creil, see also Fig. 4. In all cases key features of the size distributions are the complete depletion of nucleation mode particles, an
al-most depleted small Aitken mode and an enhanced accumu-lation mode compared to the FT background aerosol outside of smoke plumes. An example of a representative FT back-ground size distribution is shown as dashed lines in Fig. 9.
Table 6 compiles the parameters of multi-modal log-normal size distributions fitted to measured composite size distributions. Size distribution parameters recommended for the use in global climate models by AeroCom (Dentener et al., 2006) or reported in a recent review paper (Reid et al., 2005a, b) are added for comparison. Two remarkable dif-ferences between ITOP smoke particles and literature data require attention: (1) Radke et al. (1991) and Einfeld et al. (1991) propose a weak coarse mode centred at 1.2–3.3 µm for the representation of smoke particles from temperate for-est fires, such a mode is not observed in the ITOP cases after one week of atmospheric transport. (2) The accumulation mode observed during ITOP and LACE 98 is located in the diameter range from 0.2 to 0.34 µm while size distributions proposed for the use in in climate models show accumulation modes in the size range from 0.12 to 0.20 µm.
Since BC only contributes <10% to the total mass, the absorption of visible light by forest fire smoke particles is weak with a characteristic single scattering albedo of 0.83– 0.90 at λ=550 nm (Martins et al., 1996; Reid et al., 2005b). The ITOP forest fire aerosol probed on 23 July shows a BCe
mass fraction of 4% (Table 5), resulting in a single scatter-ing albedo of 0.914 (@440 nm) to 0.895 (@600 nm). Opti-cal properties were Opti-calculated by Mie theory for a refractive index of 1.55+0.02i and the size distribution 040722AL5L6 from Table 6 (Real et al., 2007). These values fit well into the range of single scattering albedo values determined for
for-est fire particles. Observed absorption coefficients (@550) range from 3 to 8 Mm−1which is of the order as the values observed for polluted urban outflow from the Paris area.
4 Discussion
In the previous section, the properties of aged forest fire smoke layers were described in detail from the observations during ITOP in summer 2004. Although the presented mea-surements are not the first ones reporting on aerosol proper-ties in smoke plumes after long-range transport (e.g., Petzold et al., 2002; Niemi et al., 2005; Reid et al., 2005a; M¨uller et al., 2005), they add new aspects to the topic. For the first time, smoke plumes of various age were investigated during one field study. This permits a good comparability of obser-vations. The measured set of parameters included absorption coefficient data, size distribution information covering the entire range of particle sized from <10 nm to the super-µm range, and information on the mixing state for several parti-cle size fractions. Combining these extensive aerosol micro-physical data with trace gas data particularly for excess CO, several important scientific questions can be tackled. First conclusions drawn from the observations are discussed in this section. They emphasise the BC export efficiency from the source regions and the aerosol transformation processes during atmospheric transport.
The first question of relevance arising is: How efficient is carbonaceous matter transported from fire regions in North American boreal forests to Europe? Following Park et al. (2005), the ratio [BCe/1CO]farfield observed in the far field to [BCe/1CO]sourcedetermined near the source can be interpreted as a measure for the efficiency of the atmospheric export of BC from a source region. Wet removal processes mainly influence the particle phase (BC) while 1CO remains almost unaffected. Park et al. report a significant decrease in the ratio [BCe/1CO]farfield×[BCe/1CO]−source1 with altitude for anthropogenic BC in Asian outflow. The interpretation suggests that the removal of BC during uplifting reduces the efficiency of the transport of BC to altitudes which are rele-vant for intercontinental transport.
Figure 10 shows the observed emission ratios [BCe/1CO]farfield for forest fire smoke plumes. The values are plotted as average values over the analysed flight-sequences and as peak values in the strongest parts of the plumes together with the emission value from Andreae and Merlet (2001). Almost all values observed during ITOP fall into the range of uncertainty spanned by the Andreae and Merlet data. The only plumes showing [BCe/1CO]farfield<[BCe/1CO]source are 040722bL4 and 040723aL6. Interpreting the ratio [BCe/1CO]farfield×[BCe/1CO]−source1 as an export efficiency, the majority of plumes is exported with 90% efficiency. Efficiencies of 30% and 50% can be attributed to plumes 040722bL4 and 040723aL6. Assuming a mass-specific
Fig. 10. Ratio of equivalent BCeper excess CO; the emission value
is taken from Andreae and Merlet (2001), open symbols represent layer-averaged values measured during ITOP, filled refer to maxi-mum values inside a plume.
absorption cross-section of 10 m2g−1 instead of 8 m2g−1, the export efficiencies are >70% for the bulk of the investi-gated plumes, and 24% and 40%, respectively, for plumes 040722bL4 and 040723aL6. Concluding, removal of BC from boreal forest fires during transport seems to play only a minor role for the investigated cases. More than 34 of the emitted BC has entered the region for intercontinental transport at higher altitudes.
This interpretation is supported by the present knowledge on injection heights of boreal forest fire plumes. Lavou´e et al. (2000) estimate an injection height of ≥6000 m for boreal forest fires depending on the frontal fire intensity. The Aero-Com emission data set (Dentener et al., 2006) assumes that 40% of Canadian boreal fire plumes are injected at heights of 3000–6000 m a.s.l.. In recent studies of the summer 2004 fires, (Leung et al., 2006; Morris et al., 2006) injection heights of 3000–6000 m a.s.l. are reported from model and trajectory data analyses. The vertical distribution of injection heights for boreal forest fire plumes is given by Turquety et al. (2006, 2007) as 40% BL, 35% MT (600–400 hPa), and 25% UT (400–200 hPa).
The smoke plumes may reach FT altitudes without major removal of particles by precipitation, which results in a high export efficiency for boreal forest fire smoke plumes. For smoky clouds over the Amazon, Andreae et al. (2004) pro-posed that the high concentration of potential CCN creates a high concentration of small cloud droplets and prohibits
1.1 1.2 1.3 1.4 1.5 1.6 1.7 1.8 1.9 0.05 0.10 0.15 0.20 0.25 0.30 0.35 0.40 6 d > 10 d 1 h ITOP Reid, Fiebig AeroCom Martins AeroCom LR C M D f ro m l o g n o rm a l fi tt in g , µ m
GSD from lognormal fitting
Fig. 11. Count median diameter (CMD) of the size distribution of
boreal forest fire smoke aerosol as a function of the geometric stan-dard deviation (GSD) of the distribution; data are taken from Reid et al. (2005a), Fiebig et al. (2003), the AeroCom data set (Dentener et al., 2006), this study, and Martins et al. (1996) for fresh aerosol. The dashed line AeroCom LR corresponds to the regression analysis for the AeroCom data set with CMD=(837.27–426.51×GSD)/1000 (Dentener et al., 2006).
precipitation. Particles are kept in the air and can enter the long-range transport altitude regime where the particles are released as aerosol after the cloud droplets have been evap-orated. Combined with the injection of plumes at higher al-titudes, a similar process may explain the high export effi-ciency for boreal forest fire plumes.
Plume dilution may shed light on the horizontal and verti-cal spreading of the plume during atmospheric transport. For the particular flight sequences 040723aL4 to 040723aL6 La-grangian match conditions are fulfilled with respect to flights of NASA DC8 on 18 July and BAe 146 FAAM aircraft on 20 July (Methven et al., 2006). Assuming an average CO mix-ing ratio in the FT of 90 nmol mol−1, the measured CO mix-ing ratios of 448.7 nmol mol−1 (DC 8), 415.4 nmol mol−1 (BAe-146) and 242.5 nmol mol−1 (Falcon) suggest plume dilutions by a factor of 1.1 from 18–20 July and by a fac-tor of 2.1 from 20–23 July. Trajecfac-tory calculations by Real et al. (2007) show a reduction of CO from 450 nmol mol−1 on 18 July to 250 nmol mol−1 on 22 July which suggests a plume dilution factor of 1.8. Plume dilution by a factor of 2.0±0.2 over a period of 4 days demonstrates that the plumes move across the North Atlantic in a very confined mode.
Another key question focuses on the transformation of smoke aerosols during long-range transport. After 1–2 weeks of atmospheric transport, the observed size distributions dif-fer significantly from the values recommended for the use in global climate models (Dentener et al., 2006) which consist of particles of larger sizes but with lower number concen-trations than observed during ITIOP. However, the observed size distributions fit well into the picture of size
distribu-tion modificadistribu-tion processes in fire plumes. Figure 11 com-piles the size distribution parameters count median diame-ter (CMD) and geometric standard deviation (GSD) for fresh and aged boreal forest fire aerosols. Dentener et al. (2006) re-ported a linear relation between CMD and GSD for wildfire aerosols. Our data extend the data set to plume ages beyond one week showing, that the modification of size distributions is still active.
As is discussed by Hinds (1999), coagulation will nar-row size distributions with time by enhanced coagulation of smaller particles with larger particles. With the absence of gaseous precursors, particle nucleation is inhibited resulting in a suppressed supply of nucleation mode particles to the co-agulation process. The net result is an increase of the modal diameter and a narrowing of the size distribution of the ACC mode. Hinds points out that a self-preserving size distribu-tion which describes a steady state of the aerosol is charac-terised by GSD values of 1.32–1.34. This picture is in close agreement with our analyses. Furthermore, similar obser-vations are reported by M¨uller et al. (2007) who analysed lidar observations of well-aged forest fire plumes. They con-cluded that the effective diameter of the smoke particles in-creases until an approximate plume age of 10–15 days. Then, a steady state of the aerosol size distribution is reached.
5 Conclusions
During the 2004 ICARTT-ITOP study an extensive set of ob-servations was collected for boreal forest fire smoke plumes after transport from North America to Europe. The presented data analysis shows that BC from forest fires can be trans-ported very efficiently on intercontinental scales. Physico-chemical properties of aged particles such as BCe/1CO fall
into the range of uncertainty spanned by the respective values for fresh emissions. The BC export efficiencies are >70– 90% for the bulk of the investigated plumes. Only for two cases, these efficiencies are <50%. The forest fire aerosol is characterised by a strong accumulation mode, an almost de-pleted nucleation mode, and by an entirely internal mixture even for Aitken mode particles. Very dry air masses (low specific humidity) turned out to be typical for the forest fire plumes observed. While the median diameter of the accumu-lation mode growths with plume age, the size distribution be-comes narrower (GSD decreases). This behaviour of the size distribution is typical for coagulation in an aerosol without ongoing particle nucleation. This finding also agrees with recently published lidar observations (M¨uller et al., 2007). The BC transported in such plumes increases the aerosol ab-sorption coefficient by about two orders of magnitude above the European free troposphere background level. The impact of such strong fire plumes on optical and radiative properties of the free troposphere aerosol above Europe is subject of ongoing work.