HAL Id: hal-01653329
https://hal.archives-ouvertes.fr/hal-01653329
Submitted on 1 Dec 2017
HAL is a multi-disciplinary open access
archive for the deposit and dissemination of
sci-entific research documents, whether they are
pub-lished or not. The documents may come from
teaching and research institutions in France or
abroad, or from public or private research centers.
L’archive ouverte pluridisciplinaire HAL, est
destinée au dépôt et à la diffusion de documents
scientifiques de niveau recherche, publiés ou non,
émanant des établissements d’enseignement et de
recherche français ou étrangers, des laboratoires
publics ou privés.
Rainbow boxes: A new technique for overlapping set
visualization and two applications in the biomedical
domain
Jean-Baptiste Lamy, Hélène Berthelot, Coralie Capron, Madeleine Favre
To cite this version:
Jean-Baptiste Lamy, Hélène Berthelot, Coralie Capron, Madeleine Favre. Rainbow boxes: A new
technique for overlapping set visualization and two applications in the biomedical domain. Journal
of Visual Languages and Computing, Elsevier, 2017, 43, pp.71 - 82. �10.1016/j.jvlc.2017.09.003�.
�hal-01653329�
Rainbow boxes: a new technique for overlapping set visualization and two applications in
the biomedical domain
IJean-Baptiste Lamya,∗, Hélène Berthelota, Coralie Caprona, Madeleine Favreb
aLIMICS, Université Paris 13, Sorbonne Paris Cité, 93017 Bobigny, France, INSERM UMRS 1142, UPMC Université Paris 6, Sorbonne Universités, Paris, France bDept. of primary care, Université Paris Descartes, Société de Formation Thérapeutique du Généraliste (SFTG), Paris, France
Abstract
Overlapping set visualization is a well-known problem in information visualization. This problem considers elements and sets containing all or part of the elements, a given element possibly belonging to more than one set. A typical example is the properties of the 20 amino-acids. A more complex application is the visual comparison of the contraindications or the adverse effects of several similar drugs. The knowledge involved is voluminous, each drug has many contraindications and adverse effects, some of them are shared with other drugs. Another real-life application is the visualization of gene annotation, each gene product being annotated with several annotation terms indicating the associated biological processes, molecular functions and cellular components.
In this paper, we present rainbow boxes, a novel technique for visualizing overlapping sets, and its application to the presentation of the properties of amino-acids, the comparison of drug properties, and the visualization of gene annotation. This technique requires solving a combinatorial optimization problem; we propose a specific heuristic and we evaluate and compare it to general optimization algorithms. We also describe a user study comparing rainbow boxes to tables and showing that the former allowed physicians to find information significantly faster. Finally, we discuss the limits and the perspectives of rainbow boxes.
Keywords: Overlapping set visualization, Information visualization, Knowledge visualization, User study, Drug properties, Gene annotation
1. Introduction
Overlapping set visualization is a well-known field in infor-mation visualization [1]. Several elements are considered, as well as sets containing all or part of these elements. The sets are overlapping, i.e. a given element can belong to more than one set. The objective of the visualization is to show clearly which elements belong to a given set, which sets include a given element but also to help answer more complex questions, for in-stance involving the intersection or disjointness of several sets, and to elicit new insights, such as finding similarities between elements or sets.
A typical and simple example of overlapping sets is the “amino-acid properties” problem. There are 20 amino-acids (e.g. Alanine, Proline) often abbreviated by their 3-letter codes (Ala, Pro) or by their 1-letter code (A, P). Several amino-acids share some physical or chemical properties, such as their small size, the presence of an aromatic cycle or a positive electric
IThis work was supported by the French drug agency (ANSM, Agence
Na-tionale de Sécurité du Médicament et des produits de santé) through the VIIIP project [grant number AAP-2012-013].
∗
Corresponding author
This is an author file of the article published in Journal of Visual Languages and Computing, DOI: 10.1016/j.jvlc.2017.09.003 ; it is available under Creative Commons Attribution Non-Commercial No Derivatives License.
Email addresses: [email protected](Jean-Baptiste Lamy), [email protected](Hélène Berthelot), [email protected](Coralie Capron), [email protected](Madeleine Favre)
charge. A given amino-acid can have zero, one or several prop-erties (e.g. Histidine has both an aromatic cycle and a positive charge). Thus the amino-acids can be considered as elements and the properties as overlapping sets of these elements. About 10 such properties are usually considered. In addition, prop-erties are not independent from each other: for example, it is obvious that all tiny acids are also small, and amino-acids with an aromatic cycle cannot be small (because the aro-matic cycle is a big chemical structure). A good visualiza-tion is expected to show clearly which are the properties of a given amino-acid and which amino-acids share a given prop-erty, but also to facilitate the discovery of new knowledge about the amino-acids (e.g. Tyrosine and Tryptophan share the same properties and thus they possibly exhibit similar biological be-haviors) and their properties (e.g. the relation between the small and aromatic properties detailed above).
More complex, real-life, overlapping set visualization prob-lems exist. A first example is the comparison of drug prop-erties. Drugs have many properties such as indications, con-traindications, interactions, adverse effects, etc. A contraindi-cation is a situation in which a given drug should be avoided (relative contraindication) or cannot be prescribed (absolute contraindication). The situation usually corresponds to a dis-ease (e.g. “this drug is contraindicated with diabetes”) or a pa-tient characteristic (e.g. “this drug is contraindicated for chil-dren”). An adverse effect is an undesired effect caused by a given drug (e.g. vomiting). Adverse effects are characterized by the seriousness of the effect and its frequency.
Drug properties are listed in official textual documents called summary of product characteristics (SPCs) and then gathered into drug databases. The user interfaces of these databases al-low a physician to consult the properties of a single drug, but not to compare several drugs with the same indication. The VIIIP (Integrated Visualization of Information about Pharma-ceutical Innovation, founded by the French drug agency) re-search project aims at facilitating the comparison of new drugs with the older similar drugs, and proposing visual interface for this task. However, the clear and concise presentation of the properties of a single drug is already difficult, and thus the vi-sual comparison of the properties of 2-10 drugs is a real chal-lenge. The comparison of drug properties can be expressed as an overlapping set visualization: drugs can be considered as el-ements, and their properties (e.g. contraindications or adverse effects) as sets including all drugs sharing the property1. For example, we might consider the set of drugs contraindicated with hypertension, or the set of drugs causing nausea (a com-mon adverse effect).
A second complex example is the visualization of gene anno-tation. Gene annotation consists of associating one or more an-notation terms to each gene products (usually proteins). One of the major resource for annotating genes is Gene Ontology (GO) [2]. GO includes three categories of annotation terms: cellu-lar components (e.g. cytoplasm, nucleus), molecucellu-lar functions (e.g. catalysis) and biological processes (e.g. lipid metabolism, cellular death). These terms are organized using hierarchical re-lations (is-a, part-of) and non-hierarchical relation (regulates). The GO database also includes the list of known gene products for many species, and the terms associated with each gene uct. The visualization of the annotation of a set of gene prod-ucts, for example a given family of protein, is difficult. This problem can be expressed as an overlapping set visualization: genes can be considered as elements, and annotation terms as setsincluding all genes associated with the term. For example, we might consider the set of gene products located in the cyto-plasm or the set of genes participating in the lipid metabolism.
The objective of this paper is (1) to present rainbow boxes, a novel technique for visualizing overlapping sets that we devel-oped initially for comparing drug properties, (2) to describe the user study we performed for evaluating this technique, and (3) to propose and evaluate a heuristic for solving the combinatorial optimization problem behind rainbow boxes. Rainbow boxes aim at presenting relatively small datasets, typically involving 2-25 elements and 5-100 sets, and at helping the discovery of classes of similar elements or sets.
The rest of the paper is organized as follows. Section 2 presents the state of the art in overlapping set visualization. Section 3 describes rainbow boxes on the simple amino-acid example. Section 4 describes the use of rainbow boxes for com-paring drug properties. Section 5 describes the application of
1Actually, overlapping set visualization is a symmetric problem. Thus, in
this situation, one might consider the drugs as the sets and the properties as the elements as well. However, in the rest of the paper, we will consider the drugs as the elements, because the proposed visualization technique, rainbow boxes, works better with fewer elements than sets.
rainbow boxes to the visualization of gene annotation. Section 6 describes a user study that has been conducted to evaluate rain-bow boxes in the drug comparison application. Section 7 evalu-ates the heuristic we propose for optimizing rainbow boxes and compares the heuristics with other algorithms. Finally, section 8 discusses the results and proposes perspectives.
2. Related works
Alsakallah et al. recently reviewed the various methods pro-posed for overlapping set visualization [1]. They distinguished 6 approaches: (1) Euler / Venn diagrams and their variants, (2) overlays on a map, (3) node-link diagrams, (4) matrix-based techniques, (5) aggregation-matrix-based techniques, and (6) scatterplot-based techniques.
Here, we propose a classification in four main different ap-proaches, grouping together Alsakallah’s category 1, 2 and 6 since they all use the position of elements for indicating the sets they belong to. Figure 1 shows an example of each approach on the amino-acid dataset.
The tabular approach uses a table or a matrix-derived view (Figure 1, top left). It relies on the ability of the human vision to distinguish horizontal and vertical lines, better than other lines [3]. The elements are shown in rows and the sets in columns, or vice versa.
The graph-based approach displays elements and sets as nodes, and the memberships are shown as edges linking ele-ments to the sets they belong to. An example is the node-link diagram in Jigsaw [4], which relies on a bipartite graph. Many algorithms exist for arranging the nodes [5]; however, graphs are often difficult to read when representing overlapping sets (this is the case for the amino-acid dataset, Figure 1, bottom left).
The positional approach shows the elements, and their po-sitions indicate the sets they belong to. Three sub-approaches can be distinguished. (1) Euler and Venn diagrams represent elements by dots and sets by closed curves containing all the dots that correspond to the elements in the set. In biology, a Venn diagram is traditionally used for representing amino-acid properties (Figure 1, bottom right). Euler and Venn diagrams become more and more complex when the number of sets in-creases above four. Additionally, it is difficult to generate auto-matically Euler / Venn diagrams, although not impossible [6]. A variant uses lines instead of closed curves [7]. (2) Map-based techniques represent geographic datasets as overlays on a map. (3) Scatterplot-based techniques represent only the ele-ments (sets are not visible) and eleele-ments belonging to the same (or similar) sets are placed together. They compute the distance between each pair of elements, based on their set memberships, and then project the elements on a two-dimensional plot. A well-known example is Principle Component Analysis (PCA).
The faceted approach represents only the sets; the elements are not shown individually but aggregated data is shown. These techniques target huge datasets. An example is Radial Sets [8] (Figure 1, top right). This technique represents sets as segments
Small Tin
y
Hydrophobic Aliphatic Aromatic Polar Positi
v e Ne g ati v e Ala X X X Arg X X Asn X X Asp X X X Cys X X X X Glu X X Gln X Gly X X X His X X X X Ile X X Leu X X Lys X X Met X Phe X X Pro X Ser X X X Thr X X X Trp X X X Tyr X X X Val X X X Negative Aliphatic Positive Tiny Aromatic Small Essential Hydrophobic Polar Ile Leu Val Met His Try Tyr Phe Lys Arg Asp Glu Gln Thr Ala Cys Gly Ser Pro Asn Small Hydrophobic Polar Aliphatic Essential Negative Positive Tiny Aromatic
Figure 1: Visualization of amino-acid properties using four different approaches: tabular approach (top left), faceted approach (radial sets, top right), graph-based approach (generated with Protégé and OntoGraph, bottom left) and positional approach (Venn diagram, bottom right).
Figure 3: Colorless version of the rainbow boxes showing 10 properties of the 20 amino-acids.
of a circle. Each segment includes a histogram indicating the number of elements in the set that belong to zero, one, two,..., nother sets. An arc joins each pair of segments, and the weight of the arc is proportional to the number of cooccurrence, i.e. the number of elements belonging to the two sets. Interactivity allows the user to select a group of elements, and to see how they spread over the various sets (in Figure 1, top right, the elements in the aliphatic set have been selected).
3. Rainbow boxes 3.1. General principles
Rainbow boxes are a new technique for overlapping set visu-alization, inspired by the tabular approaches. It aims at visual-izing relatively small datasets in detail.
Figure 2 shows rainbow boxes displaying the amino-acid properties. In rainbow boxes, the elements are displayed in columns. Each set is displayed as a rectangular box covering all the columns corresponding to the elements in the set; the label of the set is shown inside the box. Sets that are identical (i.e. they include the same elements) are grouped in a single box. When necessary, holes are present in a box (e.g. at the right of the small box in Figure 2). The elements are ordered so as to limit the number of holes as much as possible, using an al-gorithm described thereafter. Our main hypothesis was that, in most situations, the number of holes could be maintained very low, provided the right element order is found. Wider boxes are placed at the bottom (global width is considered, including holes). Finally, the boxes are stacked at the bottom like blocks in a “Tetris” game, i.e. several boxes can be side by side as long as they do not occupy the same columns.
By default, rainbow boxes do not use colors to add extra in-formation but rather to facilitate the reading and make the vi-sualization more appealing. Colors are attributed as following: each element receives a different color, ranging from red (left-most element) to violet (right-(left-most element) across the whole spectrum. The color of a box is the mean (in RGB coordinates) of the colors of the elements it contains. Consequently, a set including a single element has the same, bright, color as the el-ement, while bigger sets with many elements tend to be grayish. Nevertheless, colors can also be manually specified for each (element, set) pair, in order to convey additional information (we will see an example later on drug adverse effects). Boxes can also include hatches for representing partial membership:
for instance, in Figure 2, semi-essential amino-acids (i.e. Tyr, Cys and Gly) are represented with hatches in the essential box. When colors are not available, e.g. for black and white print-ing or for color-blind persons, shades of gray can be used in-stead of colors. In this case, each column header is displayed in light gray, and the color of a box is a shade of gray, proportional to the number of elements in the set divided by the total num-ber of elements. Consequently, boxes with a single element are in the lightest gray and boxes including all elements are in the darkest one. Figure 3 shows the amino-acid properties using colorless rainbow boxes.
Rainbow boxes show set memberships of elements, but also allow users to find new relations and similarities between ele-ments or sets. For example, in Figure 2, set inclusions are easy to see, e.g. all tiny amino-acids are also small (since the small box covers all columns covered by the tiny box) as well as set disjointness, e.g. aromatic amino-acids are not small (the aro-maticand small boxes have no common column). Additionally, it is striking that essential amino-acids are almost the same ones as hydrophobic amino-acids (the two boxes spread over almost the same columns and thus have similar colors).
Interactivity can be added to rainbow boxes by showing popup bubbles with extra information when the mouse is over column headers or boxes, and by allowing the user to select two distinct elements to obtain a 1 vs 1 comparison.
3.2. Design of the rainbow boxes technique
In this section, we try to describe how we designed the rain-bow boxes technique. How new visualization techniques are designed is often not reported, however we consider that this might help the design of future techniques.
We started from a simple table visualizing the overlapping sets, such as the one displayed in Figure 1, but with elements in columns and sets in rows. We noticed that the table included a lot of empty spaces (i.e. cells with not X). Therefore we tried to optimize space. Then, the design of the rainbow boxes tech-nique followed an iterative and exploratory process (Figure 4).
The following actions were considered: (a) reordering the rows or the columns of the table (steps 2 and 4), (b) applying some general design principle for improving the visualization, inspired by the literature [9], such as grouping in a single vi-sual object the items that go together (step 3), reducing empty space (step 5), and adding color for making the visualization more attractive and usable (step 6). After each step, we asked ourselves the following questions: “how could the visualization
Figure 4: The 6 steps of the design of the rainbow boxes technique. Set 3 Set 2 A B C Set 3 B A C Set 2 Set 3 Set 1 A B C Set 2 Set 1 Set 1
Figure 5: Optimization of rainbow boxes: non-optimal column order (left), non-optimal box order (middle), optimal column and box orders (right).
be improved?” and “which design principle could be applied now?”.
3.3. Optimization problems
For drawing optimal rainbow boxes, two aspects must be op-timized: the column order (horizontal), for limiting the number of holes, and the box order (vertical), for reducing the amount of vertical space required (see examples in Figure 5).
3.3.1. Column ordering
For drawing optimal rainbow boxes with the smallest pos-sible number of holes, the column/element order must be op-timized. Testing all possible orders would be problematic, be-cause the number of possible orders is n! (i.e. factorial n) where nis the number of elements, and thus it increases greatly with n. The complexity of this problem is O(n!). For the amino-acid example, there are 20! ≈ 2.43x10¹⁸ possible orders. To
solve this problem in a satisfying time, we propose a heuristic for computing a (near-to-)optimal element order in a short time. It first generates a small set of candidate orders, and then tests all these candidate orders for finding the best one (i.e. the one leading to the fewest and shortest holes in the rainbow boxes). On the amino-acid example, it tested 204 candidate orders.
The heuristic for generating candidate orders is shown in Al-gorithm 1. A candidate order is constructed progressively, start-ing with e0, the element belongstart-ing to the highest number of sets, and thus the most “difficult” element to place (i.e. the one that is the most susceptible to create holes, since its column will contain the highest number of boxes). Then, remnant elements are added one by one at the beginning or the end of the order being constructed. The element to insert and its position (at the beginning or at the end) is determined by computing a score for each possible insertion and choosing the insertion with the highest score. The score takes into account (a) the number of sets that include both the element to insert and the actual first (if inserting at the beginning) or last (if inserting at the end) element in the order being constructed, and (b) the number of sets that do not include the element to insert and any element already placed in the order being constructed. Part (a) favors the insertion of an element that belongs to the same sets as its future neighbor. Part (b) favors the insertion of an element that does not belong to a set that is not yet present in the order be-ing constructed, i.e. it avoids beginnbe-ing a new box too early. Whenever several best choices are possible for choosing e0 or the next insertion, all possibilities are considered, thus produc-ing several candidate orders.
3.3.2. Box ordering
Boxes are ordered according to their size (global size includ-ing holes), with larger boxes placed below smaller ones. When-ever sWhen-everal boxes have the same size, our algorithm tests all possible orders and keep the order leading to the rainbow boxes requiring the smallest amount of vertical space.
3.4. Implementation
We implemented a module for generating rainbow boxes in Python 3. It produces HTML pages with CSS and some
Algorithm 1 The heuristic algorithm for computing candidate near-to-optimal element orders (candidate_orders). elements is a set including all elements, and sets a set including all sets.
candidate_first_elements= { e0 for each element e0 in elements belonging to the highest number of set in sets } orders_being_constructed= { tuple (e0) for each element e0 in candidate_first_elements }
candidate_orders= { } (empty set) while orders_being_constructed , { }:
order= Get and remove one tuple from orders_being_constructed remnants = elements \ order
possible_insertions= { (e, "beginning") for each e in remnants }S { (e, "end") for each e in remnants } for each couple (e, position) in possible_insertions with the highest insertion_score(e, position, order):
if position is "beginning": new_order = (e, order) else if position is "end": new_order = (order, e)
if elements \ new_order = { }: Add new_order into candidate_orders else: Add new_order into orders_being_constructed
function insertion_score(element, position, order):
if position is "beginning": neighbor = First element of order else if position is "end": neighbor = Last element of order score= 0
for each set x in sets, such as (element ∈ x) and (neighbor ∈ x): score = score + 2 for each set y in sets, such as (element < y) and (orderT y = { }): score = score + 1 return score
JavaScript. This module can be downloaded2 as a Free
Soft-ware (licensed under GNU LGPL v3), including the examples shown in this paper.
4. Application to the comparison of drug properties In this section, we describe the application of rainbow boxes to the visualization of two categories of drug properties: con-traindications and adverse effects (a third category, interactions, has also been studied, but is very similar to contraindications in terms of visualization and thus it is not described here). 4.1. Comparison of contraindications
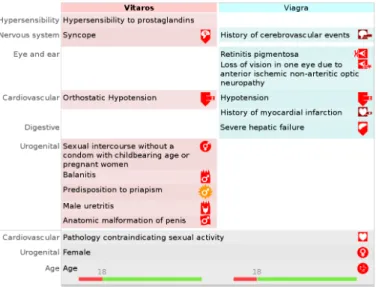
Figure 6 shows the contraindications of 8 drugs for erectile dysfunction, using rainbow boxes. The basic rainbow boxes de-scribed in section 3 have been enriched with: (a) headers show-ing pharmaceutical classes of drugs, above the column labels, e.g.“Prostaglandin E1” for Vitaros®, (b) hatches for indicating
unadvised situations, i.e. non-absolute contraindications, for example severe renal failure for Cialis®, (c) per-cell widgets,
for providing additional information on a given contraindica-tion for a specific drug, such as the “(non-controlled)” label for the “arterial hypertension” contraindication of Cialis® or the
colored bars in the “Age” box, (d) VCM icons on the right of the boxes.
The VCM (Visualization of Concepts in Medicine) iconic language [10] provides icons for representing the main medi-cal concepts, including patient conditions and disorders. VCM includes a set of graphical primitives (colors, shapes and pic-tograms) and a graphical grammar to combine them for creat-ing icons. VCM represents a clinical condition by an icon with
2http://bitbucket.org/jibalamy/rainbowbox (consulted 12/05/2017)
a color, a basic shape with zero, one or more shape modifiers and a central pictogram. The color indicates the temporal as-pect of the icon: red for current states of the patient, orange for risk of future states, and brown for past states. The basic shape is a circle for physiological states or a square for patho-logical states. The central pictogram indicates the anatomico-functional location (e.g. endocrine system) or the patient char-acteristic (e.g. pregnancy) involved; special pictograms are available for a few specific disorders associated with a specific anatomico-functional location (e.g. diabetes for endocrine sys-tem). Shapes modifiers can be added to specify (a) a general pathological processes (e.g. inflammation or tumor), and (b) a “transverse” anatomical structure that can be present in many anatomico-functional locations (e.g. blood vessels, which are present in most organs).
Rainbow boxes in Figure 6 show the contraindications of the 8 drugs, but also allow the discovery of several findings and similarities between drugs , such as: “Muse®is the drug closest
to Vitaros®, in terms of contraindications”, “Levitra®has more
contraindications than Viagra®”, “predisposition to priapism is
a contraindication associated with all prostaglandin E1 drugs” or “the two pharmaceutical classes, prostaglandin E1 and phos-phodiesterase type 5 inhibitors, have very different contraindi-cations ”.
Interactivity has also been added to the visualization: by clicking on columns, the user can display a 1 vs 1 compari-son limited to two drugs (Figure 7), made of three parts: on the top-left and top-right corners, contraindications specific to the first and the second drugs, respectively, on the bottom, traindications shared by the two drugs. In each part, the con-traindications are also sorted by System Organ Class (SOCs, e.g.cardiovascular system).
Figure 6: Rainbow boxes displaying the 79 contraindications (26 distinct) of 8 drugs for erectile dysfunction. The drugs are shown in columns and the contraindi-cations in rectangular horizontal boxes (possibly with holes) covering the columns corresponding to the drugs sharing the contraindicontraindi-cations.
Figure 7: 1 vs 1 comparison of the contraindications of Vitaros®with those of
Viagra®.
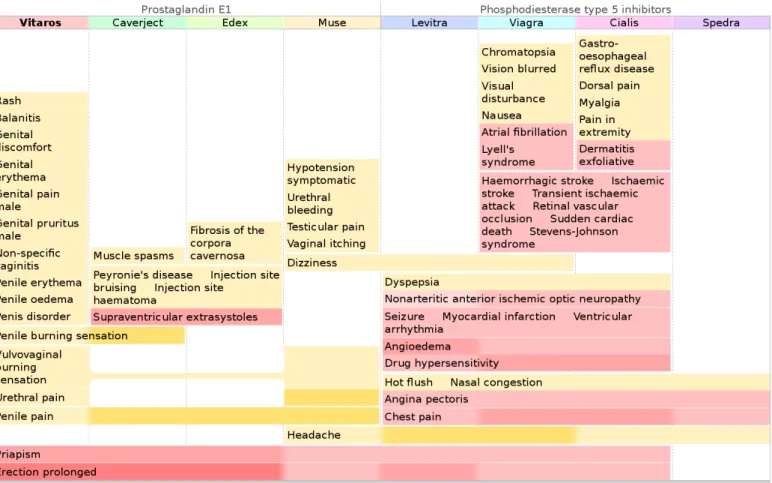
4.2. Comparison of adverse effects
Figure 8 shows an example of rainbow boxes comparing adverse effects on the same eight drugs. Adverse effects are more complex to visualize than contraindications, since they are characterized by two additional attributes: seriousness and frequency. Seriousness is a boolean and for frequency, 5 values are considered: very rare, rare, infrequent, frequent and very
frequent. To reduce the number of adverse effects, only serious and/or frequent and very frequent effects have been considered. The two attributes have been represented by the use of cus-tom colors on each cell. The hue indicates the seriousness (red: serious, orange: not serious) and the saturation indicates the frequency (more saturated colors corresponding to more fre-quent effects). Some boxes can have different colors in vari-ous columns, e.g. the “Penile pain” box is less saturated for Vitaros® because this effect occurs less frequently than with
the other prostaglandin E1 drugs.
Figure 8 allows users to easily find several statements, such as: “Vitaros® has a lot of non-serious adverse effects”,
“Viagra®has many serious adverse effects, most of them being shared with Cialis®”, or “Spedra®is the drug with the fewest adverse effects”. Notice that the order of the drugs differs between Figure 6 and 8, because drugs sharing contraindica-tions are not the same as drugs sharing adverse effects (this is a known phenomenon is pharmacology). We kept the same col-ors for column headers than in Figure 6, in order to help relating the drugs between the two Figures.
4.3. Implementation
We implemented the system in Python 3, using the previously mentioned Python module for generating rainbow boxes. An-other Python program was responsible for gathering drug prop-erties. It allowed either to enter drug properties manually or to extract them automatically from the French Thériaque drug database or from the SPCs (currently implemented for adverse
Figure 8: Rainbow boxes displaying 116 adverse effects (56 distinct) of 8 drugs for erectile dysfunction. Custom colors are used for indicating seriousness (red and orange hue) and frequency (saturation).
effects only) using Natural Language Processing (NLP) meth-ods [11]. The contraindications were coded in ICD-10 (Inter-national Classification of Disease, 10threlease) and adverse
ef-fects in MedDRA (Medical Dictionary for Regulatory Activi-ties). PyMedTermino [12] was used for managing the two med-ical terminologies. Drug properties were stored in a formal on-tology [13] in OWL/XML.
An English translation of the full webpage for Vitaros®,
in-cluding rainbow boxes but also additional comparative tables with simpler drug properties such as price or dose regimen, is available online3.
5. Application to the visualization of gene annotation In this section, we describe the application of rainbow boxes to the comparison of gene annotation of the gene products in a given protein family. Proteins were considered as elements and thus displayed in columns, and annotation terms were consid-ered as sets and shown in the boxes. In addition, custom colors were added to the boxes, for indicating the categories of GO annotation terms: light green for cellular components, light red for molecular functions and light blue for biological processes.
3http://www.lesfleursdunormal.fr/static/viiip_proto/html/
page_medicament_he_60731732_Vitaros_en.html (consulted 12/05/2017)
Datasets were extracted from Gene Ontology (GO) using SQL queries through the MySQL interface available online. PyMedTermino [12] has been used for managing annotation terms and taxonomic entities, and rainbow boxes were gener-ated using the previously mentioned Python module.
Figure 9 shows the datasets for histones, a protein family, in the Homo sapiens species. Histones are proteins bound to the DNA; they are responsible for winding the DNA and they also play a role in gene regulation. Five main types of histones exist: H1, H2A, H2B, H3, H4. They are further classified in subtypes H1.0, H1.1, etc.
In Figure 9, the 12 histones were ordered using the previ-ously described heuristic algorithm. It is interesting to note that the resulting order, i.e. the one that minimizes the number of holes, actually groups together each of the five main types of histones: for example, the 6 H1 histones are next to each other. This means that the classification of histones corresponds well to gene annotation.
Several statements can be deduced from the visualization. For example, DNA binding (chemical function), chromosome, nucleosome and nucleus (cellular components) are the annota-tion terms common to all histones. Chromatin DNA binding (chemical function) is specific to and characteristic of histones H1. Histone H4 is the one with the most annotations, in par-ticular biological processes in blue; it is the histone with the
Figure 9: Examples of rainbo w box es presenting gene annotation data for histones (12 elements, 68 sets, 209 membership relations). The box color indicates the cate gory of GO annotation terms: cellular components (light green), molecular functions (light red) and biological processes (light blue).
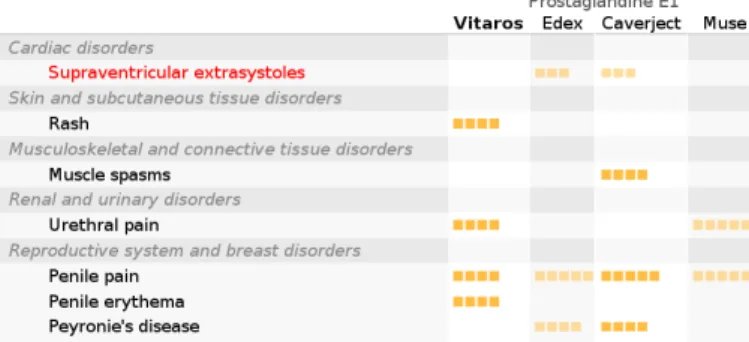
Figure 10: An excerpt of a dynamic table displaying adverse effects of drugs for erectile dysfunction.
most biological effects and/or it has been more studied than the others. Finally, since the green and red boxes are larger and po-sitioned lower than the blue ones, the cellular component and molecular function terms are common to several histones, while the biological process terms are more specific to given subtypes of histones.
6. User study 6.1. Study design
During a user study, rainbow boxes were evaluated in the drug property application, and compared to tables. Tables were matrices with drugs in columns and contraindications or ad-verse effects in rows (Figure 10). Various colored symbols were used for representing contraindications, unadvised conditions, and the frequency and seriousness of adverse effects. In addi-tion, tables were dynamic and interactive: they allowed the user to show the properties of a single drug, to compare the proper-ties of two drugs or to show all properproper-ties for all drugs.
The user study followed a crossover experimental design. 3 drug sets were manually extracted, each drug set included 2 comparisons (contraindications, adverse effects) and each com-parison was visualized using the 2 approaches (dynamic table, rainbow boxes). This produced 12 (= 3x2x2) documents. 12 single-choice questions were written and validated by medi-cal experts (2 questions for each comparison). Each question was associated with a set of 2-8 possible answers, with only one right answer and the others being wrong. Each question involved at least two drugs and the right answer can be deter-mined using the corresponding comparison, e.g. “Is Vitaros® better than Edex® for patients with a penile implant? (Yes / No)” or “Which drug has the highest number of serious car-diac adverse effects? (Vitaros®/ Caverject®/ etc, 8 candidate responses)”.
Physicians were recruited and briefly introduced to dynamic tables and rainbow boxes (about 15 minutes). They had to an-swer each question on a computer, using the associated docu-ment, either dynamic table or rainbow boxes. The question and the possible answers were displayed first (see first screenshot in Figure 11). The physician read the question and the allowed answers, and then he clicked on a link to display to document (second screenshot in Figure 11). He read the document, found the response and clicked on the appropriate answer.
Physicians were divided in 2 groups; for a given comparison, the first group has to respond to the first question with dynamic table and to the second question with rainbow boxes, while it was the contrary for the second group. When the candidate re-sponses were drug names, they were ordered in the same order as in the visualization. The questions were ordered so as the two questions based on the same comparison were not next to each other, and two “warm-up” questions were added at the be-ginning but their results were not taken into account.
During the test, we measured the correctness of the answers and the response time (i.e. time between the click on the link for displaying the document and the click on the answer). After, we measured the perceived usability through a SUS (System Usability Scale) questionnaire [14]. Data were analyzed with R software version 3.2.3. A general discussion was conducted with the physicians after the test.
6.2. Results
22 physicians were recruited (12 males, 10 females, mean of age: 54.6 years). They were interested in drug comparisons and very enthusiastic. 9 physicians preferred tables and 7 rainbow boxes (6 had no preference). The SUS score was 72.0 for tables and 66.9 with rainbow boxes, this difference is not significant (p-value 0.25, Wilcoxon test).
99 answers out of 132 (75%) were correct with tables versus 103 out of 132 (78%) with rainbow boxes, this difference is not significant (p-value 0.66, Pearson’s Chi-squared test with Yates’ continuity correction). Mean response time was 39.0 seconds with tables versus 29.7 seconds with rainbow boxes, this difference is significant at risk α = 5% (p-value 0.011, Welch Two Sample t-test performed on log(response time) for normalizing distributions).
During the discussion, physicians told us that they were used to tables but that rainbow boxes were difficult to understand at the beginning. They found that both would be good at answer-ing different types of questions in their everyday life. They considered tables better for using during consultation, when the physician has a particular patient in mind. On the contrary, they found rainbow boxes better for continuing education, when the physician needs a global overview of the available drugs.
7. Evaluation and comparison of the heuristic 7.1. Evaluation of the column ordering heuristic
In order to evaluate the column ordering heuristic proposed in Algorithm 1, we generated 100 random datasets and com-puted the order using two algorithms: the heuristic and a “brute-force” algorithm that tests all possible orders. Due to the fac-torial complexity of the problem, the random datasets included only 8 elements, 12 properties and 50 random membership re-lations.
On the 100 random datasets, the heuristic produced a mean of 6.8 holes, and the “brute force” algorithm a mean of 6.6 holes. The heuristic produced the optimal solution in 78% of the runs. The “brute force” algorithm tested 8! = 40320 solutions for each dataset, while the heuristic tested a mean of 22.9 solutions.
Figure 11: Screenshots of the graphical interface for the user study (top: before the physician displayed the document, bottom: after). Texts were translated from French.
Amino-acid dataset (Figure 2) Histone dataset (Figure 9)
Algorithm # holes # tested # holes # tested
Heuristic (Algorithm 1) 4 204 6 6 PCA 14 1 26 1 UPGMA 5 524,288 8 2,048 NJ 5 786,432 6 3,072 GA (*) 6.9 10,000 6.5 10,000 ABC (*) 7.8 10,000 6.8 10,000 ACO (*) 4.8 10,000 6.3 10,000
Table 1: Resulting obtained using various column ordering algorithms on two datasets. For each algorithm and dataset pair, the table gives the number of holes and the number of candidate orders tested (lower is better for both). (*) These algorithms does not provide the same result if they are run several times; thus the results shown are the means of 50 runs.
7.2. Comparison with other algorithms
For optimizing the order of the elements in rainbow boxes, we compared several methods with the heuristic given in Algo-rithm 1. We tested: (a) Principal Component Analysis (PCA): each set was considered as a dimension and each element as a point in that space. For a given dimension, the point coordi-nate was 1 if the element belongs to the corresponding set and to 0 otherwise. Then the first PCA’s resulting dimension was used to order the elements. (b) Tree building algorithms (Un-weighted Pair Group Method with Arithmetic mean, UPGMA, and Neighbor-Joining, NJ): a tree was built from the dataset and then it was flattened. However, the children of a node are not ordered in a tree, thus all possibilities must be tested, which often leads to a high number of candidate orders to test. (c) General all-purpose nature-inspired metaheuristics, includ-ing Genetic Algorithms (GA) [15], Artificial Bee Colony (ABC) [16] and Ant Colony Optimization (ACO) [17]: GA were tested because they are known for their great adaptability to various problems. We used the random-key technique proposed by
Sny-der et al. [18] for performing combinatorial optimization with GA. We tested ABC because we already implemented the al-gorithm for another project, and we adapted the random-key technique to ABC. Finally, we tested ACO because the rainbow box ordering problem is a combinatorial optimization problem and ACO is known to be very efficient on such problems (such as the traveling salesman problem). More precisely, we used the MAX-MIN Ant System (MMAS) [19].
Table 1 shows the number of holes obtained with the vari-ous algorithms on two datasets presented in this paper (corre-sponding to Figures 2 and 9), and the number of candidate or-ders tested by each algorithm. Several runs were performed for algorithms involving randomness (GA, ABC and ACO). The results clearly show that the proposed heuristic outperforms all the other algorithms. In addition, PCA, tree building algorithms and metaheuristics never led to a better result (i.e. a smaller number of holes) than the proposed heuristic for any dataset.
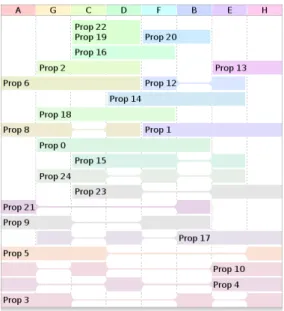
Figure 12: Rainbow boxes representing a random dataset of similar size than the one in Figure 6.
8. Discussion
8.1. Rainbow boxes visualization technique
Alsallaks et al. [1] described various tasks expected for over-lapping set visualization: 7 tasks related to elements, 14 related to sets and 5 related to element attributes. Rainbow boxes can support many of these tasks, including basic element tasks (A1-3), set tasks related to inclusion (B2-(A1-3), exclusion (B4), inter-section (B5-8) and similarity (B11).
We hypothesized that, in many real situations, the number of holes in rainbow boxes could be maintained very low, provided the right element order is found. This hypothesis has been con-firmed in the three examples described in this paper (amino-acid properties, drug comparison, gene annotation). Actually, amino acids, drugs and proteins exhibit an important “class-effect”, e.g.drugs tend to share common properties, determined by their chemical structures, pharmacological mechanisms or adminis-tration routes. On the contrary, when tested on randomly gener-ated data of similar size than the drug applications (same num-ber of elements, sets, and element-set memnum-berships), rainbow boxes lead to complex and hard-to-read visualizations (Figure 12).
The smallest dataset that leads to a hole includes 3 sets and 3 elements, as follows: {e1, e2}, {e2, e3}, {e3, e1}. Bigger datasets
with similar “circular” structure also lead to a hole, so this for-mula can be generalized to n ≥ 3 sets and elements: {e1, e2},
{e2, e3}, ..., {en−1, en}, {en, e1}. More complex datasets including
several occurrence of this formula lead to one or more holes. We observed that in some situations the holes can “collapse”, i.e.two holes can be placed next to each other, thus resulting in a single larger hole. Random datasets, such as the one of Figure 12, include hundreds of occurrence of the previous formula.
More generally, no holes are present if a “tree structure” ex-ists between the sets, i.e. if the sets are defined by recursively partitioning the set including all elements. However, some
datasets that do not strictly adhere to this rule can still lead to no hole. As a consequence, rainbow boxes are probably better-suited for visualizing elements for which underlying classes of similar elements exist (these classes can be already known or still to discover).
In our three examples, the information visualized is actu-ally knowledge rather than just information, as defined by Nake [20], i.e. it is information that can be reused in another context. For example, the drug properties are determined experimentally during clinical trials on a group of patients, and then these prop-erties are considered for prescribing the drug to another patient (who has not participated in the trial). In that sense, rainbow boxes can be seen as a knowledge visualization technique. Our intuition is that knowledge is usually structured and well-categorized. It typically exhibits an important “class-effect” and partition structure, similar to the one mentioned in the pre-vious paragraphs. Therefore, visualizing knowledge with rain-bow boxes might lead to fewer holes than visualizing data.
Different color assignment schemes were used to assign a color to each set. We proposed a default rule that assigns a color to each element, and blend these colors to obtain the set color. We also proposed rainbow boxes with customized colors, in or-der to take advantage of color as a retinal variable for convey-ing additional information (e.g. the frequency and seriousness of adverse effects or the category of GO annotation terms). The default color assignment rule provides little additional informa-tion, but often makes the visualization more appealing (com-pared to a colorless visualization). In addition, it represents the more general sets in grayer colors. While it is theoretically possible to combine both color assignment schemes, this would lead to grayish custom colors for large sets. This would impair the reading of the custom colors (e.g. in Figure 9, the green box at the bottom would be gray, and thus the user cannot under-stand that the box include cellular component terms).
8.2. Ordering algorithm
For optimizing the order of elements, several methods were tried, but the results were not as good as the proposed heuris-tic. This is probably because the heuristic has been designed specifically for the rainbow box ordering problem, while the other tested methods were based on algorithms designed for other purposes (scatterplot for ACP, tree building for UPGMA and NJ) or on general metaheuristics (GA, ABC, ACO). Future works should consider the use of a hybrid system combining a problem-specific heuristic (as the one we proposed) with a gen-eral metaheuristic. For instance, such a system may use ACO on a search space limited to the candidate solutions considered by the problem-specific heuristic.
For optimizing box vertical ordering, the algorithm we used tested all possibilities and it could theoretically test a huge num-ber of possible orders (although we did not encounter this prob-lem in practice). Writing a heuristic for box ordering would be a solution.
8.3. Application to the comparison of drug properties
Rainbow boxes were initially developed for the comparison of drug properties. Very few systems have been proposed for
visualizing the properties of several drugs together, and all of them relied on simple matrices for displaying drug properties. Wroe et al. [21] proposed DOPAMINE, a spreadsheet-like matrix-based tool, but this approach was limited and mostly aimed toward reviewing and authoring drug properties. Iordatii et al. [22] proposed a similar approach for comparing the con-traindications and the adverse effects of a new drug to a refer-ence drug. They used tabular matrices enriched by colors. Drug Fact Boxes [23] offer some comparative drug information, but limited to a few drugs and targeting patients rather than physi-cians.
Duke et al. [24] designed an original system for viewing the adverse effects of several drugs. The effects are “summed” together; this system is interesting for analyzing the risk associ-ated with a drug order including several drugs, but is not aimed at the comparison of similar drugs. Finally, GraphSAW [25] is a graph-based tool for visualizing drug-drug and drug-enzyme interactions and their relations with drugs adverse effects.
In our study, the drug properties were manually extracted by an expert. The comparison of drug properties would benefit from the automatic extraction of these properties from official texts or drug databases, however, our preliminary works in this direction showed that the automatic extraction is difficult and often inaccurate [11].
8.4. Application to the visualization of gene annotation Rainbow boxes were applied successfully to the visualization of gene annotation, automatically extracted from GO.
Overlapping sets visualization is a “symmetric” problem, in which the elements and the sets can be swapped. For example, we considered a protein as an element, and an annotation term as the set of proteins annotated with this term. But we could also consider an annotation term as an element, and a protein as the set of annotation terms that annotate this protein. This was the point of view we initially adopted, but it led to less inter-esting and readable visualizations. Thus, we tried the opposite approach, with better results.
The visualization could be improved by considering the is-a and part-of relations that exist between GO terms. In our first experiments, the inheritance was taken into account when creat-ing the boxes. However, the rainbow boxes were more complex and difficult to read, and we dropped inheritance relations.
In the literature, treemaps have been proposed for visualizing the GO terms associated with a set of genes determined with microarrays [26]. In future works, we may apply rainbow boxes to the visualization of microarrays or NGS (Next-Generation Sequencing) data, or functional analysis in bioinformatics. 8.5. User study
User study showed no significant difference in accuracy, a shorter response time with rainbow boxes, but a slightly lower perceived usability (SUS score 72.0 vs 66.9). These results are not necessarily contradictory: SUS measures perceived usabil-ity but it is known that user satisfaction is not always corre-lated with real effectiveness and efficiency [27]. The lower SUS score for rainbow boxes might be explained by the fact that
physicians were already used to tables but were entirely new to rainbow boxes. It is well-known that usability studies often yield poor results on radically new interfaces [28]. In addition, some of the physicians spontaneously suggested that their age (mean: 54.6 years) might also explain that they had difficulties with new computer interfaces.
During the user study, rainbow boxes were compared to dy-namic tables. Tables were chosen as a reference because it seemed the simplest and most “obvious” way for presenting drug properties to the authors but also in the literature [21, 22]. Dynamic tables were an interactive improvement of plain ta-bles. A comparison with plain non-dynamic tables would prob-ably lead to an even bigger difference in response time.
Rainbow boxes were initially aimed at education, e.g. for teaching the properties of the various drugs and drug classes, and for presenting information about a new drug and compar-ing it with older drugs in the same indications. But some physi-cians also suggested their use during prescription, for compar-ing available drugs.
8.6. Perspectives
Rainbow boxes could be improved and developed further in two directions. The first one is the visualization of huge datasets. Currently, rainbow boxes are limited to 2-25 ele-ments, this limit corresponds to the number of columns and the capability of the column ordering heuristic. Two solutions can be proposed to exceed this limit. First, the heuristic could be improved, for example by associating a metaheuristic with the proposed heuristic, as proposed previously. Second, using clus-tering, it might be possible to group similar elements together into 2-25 clusters, and then to visualize these clusters. This would allow a much higher number of elements.
The second direction is ontology visualization. This field of research consists of visualizing a formal ontology; most ap-proaches relying on trees or graphs [29, 30]. In terms of on-tology, overlapping sets correspond to multiple instantiation, i.e.elements are instances and sets are classes, and an instance can belong to more than one class. However, many other re-lations exist in ontologies, such as is-a hierarchical rere-lations between two classes (similar to inclusion relations existing be-tween sets). Some of these relations can be already known (e.g. on the amino-acid example, it is already known that the set of tiny amino-acids is included in the set of small amino-acids) and could thus be represented in the visualization, typically by incorporating the tiny box inside the small box. Similarly, the visualization of excluding relations (for example between the positive and the negative sets) could be improved by placing the corresponding boxes at the same vertical position.
Many qualitative data, in many knowledge domains, can be considered as overlapping sets. Thus rainbow boxes could find many other applications, especially for visualizing knowl-edge about several items that are organized in classes of sim-ilar items. Potential application domains include bibliometry, bioinformatics, search engines, species classification and tax-onomies, ontology visualization, knowledge domain visualiza-tion, etc.
9. Conclusion
In this article, we presented rainbow boxes, a novel technique for visualizing overlapping sets, and its applications to the com-parison of drug properties and to the visualization of gene an-notation for protein families. We also described a user study showing that rainbow boxes allowed physicians to find a given information significantly faster than with tables, but also that they may need training before using this new tool. Rainbow boxes are particularly efficient for visualizing the similarities between known or yet-to-discover classes of elements or sets, and they could potentially be applied to many other domains.
References
[1] B. Alsallakh, L. Micallef, W. Aigner, H. Hauser, S. Miksch, P. Rodgers, Visualizing Sets and Set-typed Data: State-of-the-Art and Future Chal-lenges, in: Eurographics Conference on Visualization (EuroVis), 2014. [2] The Gene Ontology Consortium, The Gene Ontology project in 2008,
Nucleic Acids Res 36 (Database issue) (2008) D440–4.
[3] Ware C, Visual thinking for design, Morgan Kaufmann, Burlington, USA, 2008, Ch. Structuring two-dimensional space.
[4] J. Stasko, C. Görg, Z. Liu, K. Singhal, Jigsaw: Supporting Investiga-tive Analysis through InteracInvestiga-tive Visualization, Information visualization (IVS) 7 (2) (2008) 118–132.
[5] Tamassia R (Ed.), Handbook of graph drawing and visualization, CRC Press, 2013.
[6] P. Simonetto, D. Auber, D. Archambault, Fully Automatic Visualisation of Overlapping Sets, in: Eurographics/ IEEE-VGTC Symposium on Vi-sualization, Vol. 28, 2009.
[7] B. Alper, N. H. Riche, G. Ramos, M. Czerwinski, Design study of Line-Sets, a novel set visualization technique, in: IEEE transactions on visual-ization and computer graphics, Vol. 17, 2011, pp. 2259–2267.
[8] B. Alsallakh, W. Aigner, S. Miksch, H. Hauser, Radial Sets: Interactive Visual Analysis of Large Overlapping Sets, in: IEEE Transactions on Visualization and Computer Graphics (Proceedings Information Visual-ization 2013), Vol. 19, 2013, pp. 2496–2505.
[9] Ware C, Visual thinking for design, Morgan Kaufmann, Burlington, USA, 2008.
[10] J. B. Lamy, C. Duclos, A. Bar-Hen, P. Ouvrard, A. Venot, An iconic lan-guage for the graphical representation of medical concepts, BMC Medical Informatics and Decision Making 8 (2008) 16.
[11] J. B. Lamy, A. Ugon, H. Berthelot, Automatic extraction of drug adverse effects from product characteristics (SPCs): A text versus table compari-son, Stud Health Technol Inform 228 (2016) 339–343.
[12] J. B. Lamy, A. Venot, C. Duclos, PyMedTermino: an open-source generic API for advanced terminology services, Stud Health Technol Inform 210 (2015) 924–928.
[13] S. Schulz, L. Jansen, Formal ontologies in biomedical knowledge repre-sentation, Yearb Med Inform 8 (2013) 132–46.
[14] A. Bangor, P. Kortum, J. Miller, Determining what individual SUS score mean: adding an adjective rating scale, J Usability Stud 4 (2009) 114– 123.
[15] Darrell W, A genetic algorithm tutorial, Statistics and Computing 4 (1994) 65–85.
[16] Karaboga D, An idea based on honey bee swarm for numerical optimiza-tion, Technical report.
[17] M. Dorigo, M. Birattari, T. Stutzle, Ant Colony Optimization - Artificial ants as a computational intelligence technique, IEEE Comput. Intell. Mag 1 (2006) 28–39.
[18] L. V. Snyder, M. S. Daskin, A random-key genetic algorithm for the gen-eralized traveling salesman problem, European Journal of Operational Research 174 (1) (2015) 38–53.
[19] T. Stützle, H. H. Hoos, MAX-MIN Ant System, Future Generation Com-puter Systems 16 (9) (2000) 889–914.
[20] Nake F, Data, Information, and Knowledge, in: Liu, K. and Clarke, R.J. and Andersen, P.B. and Stamper, R.K. (Ed.), Organizational Semiotics:
Evolving a Science of Information Systems, Vol. 41-50, Kluwer, Mon-tréal, Québec, Canada, 2001.
[21] C. Wroe, W. Solomon, A. Rector, J. Rogers, DOPAMINE: a tool for vi-sualizing clinical properties of generic drugs, in: Proceedings of the Fifth Workshop on Intelligent Data Analysis in Medicine and Pharmacology (IDAMAP), Vol. 61-65, 2000.
[22] M. Iordatii, A. Venot, C. Duclos, Design and evaluation of a software for the objective and easy-to-read presentation of new drug properties to physicians, BMC medical informatics and decision making 15 (2015) 42. [23] L. M. Schwartz, S. Woloshin, H. G. Welch, The Drug Facts Box: Improv-ing the communication of prescription drug information, Ann Intern Med. 150 (2009) 516–27.
[24] J. D. Duke, X. Li, S. J. Grannis, Data visualization speeds review of po-tential adverse drug events in patients on multiple medications, J Biomed Inform 43 (2) (2009) 326–331.
[25] A. Shoshi, T. Hoppe, B. Kormeier, V. Ogultarhan, R. Hofestädt, Graph-SAW: A web-based system for graphical analysis of drug interactions and side effects using pharmaceutical and molecular data, BMC medical in-formatics and decision making 15 (1) (2015) 139.
[26] E. H. Baehrecke, N. Dang, K. Babaria, B. Shneiderman, Visualization and analysis of microarray and gene ontology data with treemaps, BMC bioinformatics 5 (2004) 84.
[27] E. Frøkjær, M. Hertzum, K. Hornbæk, Measuring Usability: Are Effec-tiveness, Efficiency, and Satisfaction Really Correlated?, in: Proceedings of the ACM CHI 2000 Conference on Human Factors in Computing Sys-tems, The Hague, The Netherlands, 2000, pp. 345–352.
[28] S. Greenberg, B. Buxton, Usability evaluation considered harmful (some of the time), in: CHI 2008 Proceedings, Vol. 111-120, 2008.
[29] A. Katifori, C. Halatsis, Ontology visualization methods - A survey, ACM Computing Surveys 39 (4) (2007) 10.
[30] M. Dudás, O. Zamazal, V. Svátek, Lecture Notes in Computer Science, Vol. 8876, 2014, Ch. Roadmapping and navigating in the ontology visu-alization landscape, pp. 137–152.