HAL Id: hal-01562972
https://hal.archives-ouvertes.fr/hal-01562972
Submitted on 17 Jul 2017
HAL is a multi-disciplinary open access
archive for the deposit and dissemination of
sci-entific research documents, whether they are
pub-lished or not. The documents may come from
teaching and research institutions in France or
abroad, or from public or private research centers.
L’archive ouverte pluridisciplinaire HAL, est
destinée au dépôt et à la diffusion de documents
scientifiques de niveau recherche, publiés ou non,
émanant des établissements d’enseignement et de
recherche français ou étrangers, des laboratoires
publics ou privés.
Translating visually the reasoning of a perceptron: the
weighted rainbow boxes technique and an application in
antibiotherapy
Jean-Baptiste Lamy, Rosy Tsopra
To cite this version:
Jean-Baptiste Lamy, Rosy Tsopra. Translating visually the reasoning of a perceptron: the weighted
rainbow boxes technique and an application in antibiotherapy. 21st International Conference
Infor-mation Visualisation (IV 2017), Jul 2017, Londres, United Kingdom. �hal-01562972�
Translating visually the reasoning of a perceptron: the weighted rainbow boxes
technique and an application in antibiotherapy
Jean-Baptiste Lamy, Rosy Tsopra
LIMICS, Université Paris 13 - Sorbonne Paris Cité, UPMC Université Paris 6, Sorbonne Universités, INSERM UMRS 1142, Bobigny, France
Email: jean-baptiste.lamy@univ-paris13.fr rosytsopra@gmail.com
Figure 1. Weighted rainbow boxes showing the antibiotics available for treating cystitis in adults with risk of complication, and the disadvantages of each drug. The 10 available antibiotic drugs are displayed in columns, and the 6 disadvantages they may present are represented by rectangular red boxes. Each box covers the columns corresponding to the antibiotics having the disadvantage, and antibiotics were ordered so as to limited “holes” in the boxes. Here, a single hole is present (in the “ceftriaxone” column). The height of a box is proportional to the importance of the corresponding disadvantage, allowing the computation of a score for each drug, by visually summing the height of the boxes stacked in the drug’s column. Here, lower score means better antibiotics, thus nitrofurantoin is the best treatment.
Abstract—In this paper, we propose a technique for translat-ing visually the reasontranslat-ing of a perceptron. The artificial neuron, or perceptron, is a simplified model of a biological neuron. It can achieve simple reasoning and solve linearly separable problems. Despite its limited reasoning power, it is enough to deal with several real-life problems. The proposed technique is based on rainbow boxes, a technique for overlapping set visualization, which has been applied to the input vectors of the perceptron. We extended this technique, leading to weighted rainbow boxes. It can visualize several input vectors and output values for a single perceptron. We applied this approach to decision support in antibiotherapy, for the determination of the most appropriate antibiotic in urinary infections, by taking into account the properties of each drug (e.g. efficacy, risk of adverse effects, etc). Finally, a user study with 11 physicians showed that most of them found the visualization interesting and easy to read.
Keywords-perceptron; overlapping set visualization; antibio-therapy; user study
I. INTRODUCTION
The artificial neuron, also called perceptron, is a sim-plified model of a biological neuron, and it is the base unit for artificial neural networks (ANN) [1]. A perceptron has n inputs I and produces one output O (see example at the top of Figure 3). A weight wi is associated with
each input Ii. As a processing unit, the perceptron computes
the weighted sum of its inputs, by multiplying the value of each input by its weight and summing them, and then it applies on the result the activation function f. A typical activation function is a threshold function (returning 1 if x is above the threshold, and 0 otherwise) or a sigmoid function. Consequently, the output can be computed with the following formula: O = f (I1×w1+I2×w2+...+In×wn).
A single perceptron can achieve simple reasoning and solve linearly separable problems. On the contrary, more complex problems require several perceptrons. Although it is limited in terms of reasoning power, a single perceptron is enough to deal with some real-life problems. An example is the application of a lexicographic order or the computation of a (linear) score, e.g. “if input I1is true, increase the score
by w1, if input I2 is true, increase the score by w2,...”. For
example, in antibiotherapy, the physician has to choose an antibiotic drug to prescribe. R Tsopra et al. [2] have shown that the most appropriate antibiotic can be determined by considering several antibiotic properties and then ranking the antibiotics according to their properties, considered in a lexicographic order.
Figure 2. Rainbow boxes displaying 8 properties of the 20 amino-acids.
produce an output but they do not explain to a Human user whythe result is the obtained one. The visualization of the reasoning of a perceptron, i.e. the representation of the input values, the output value and the relation between them, is a solution to this problem. If we consider a perceptron with Boolean inputs, the representation of several input vectors can be seen as an overlapping set visualization problem (in which the elements are the input vectors, and the sets are the sets of input vectors for which a given input value is true).
In this work, our objective was to improve rainbow boxes, a visualization techniques for overlapping sets [3], for the visualization of the input and output values of a perceptron, and for translating visually its reasoning. The paper describes the resulting techniques, called weighted rainbow boxes, and a medical applications in antibiotherapy. The rest of the paper is organized as follows. Section II presents related works on the visualization of ANN and overlapping sets. Section III describes the extensions we pro-pose to rainbow boxes. Section IV describes an application in antibiotherapy. Section V describes a small user study on this application. Section VI discusses the proposed technique and its application. Finally, section VII concludes the paper with perspectives.
II. RELATED WORKS
A. Visualization of artificial neural networks
Several aspects of an ANN can be visualized: the topology of the network, the weight associated with each connection, the input and output vectors, and the evolution of the learning (which is a time-related feature, considering, for example, the evolution of the weights or of the error surface). The visualization tools proposed in the literature address one or more of these four aspects.
The weights can be visualized with Hinton diagrams [4]. The topology of the network is usually represented as an ori-ented graph. In addition to the topology, the Bond diagram displays the weights using colored arrows on the arc [5]. Specific tools have also been developed for visualizing the topology of networks in the Human brain (i.e. connectomics) [6]. When considering a single neuron, the input vectors and the output are usually represented using a hyperplane. The (single) output is represented by a color ranging from black to white. Two or three inputs are considered, with
one dimension for each. Thus, the hyperplane is a line (for two inputs) or a plane (three inputs). For more inputs, the visualization of the hyperplane is problematic. This approach has been extended to networks made of several neurons, using several hyperplanes organized in a matrix [7].
Learning has led to more complex visualizations. Lascaux [8] displays the topology of the network and represents each neuron by a square cell, showing its current state. It can show the activation of neurons, but also the backward-propagation of error signals during learning. Another approach consisted in applying principal component analysis to the weights [9]. In conclusion, only one of the proposed approaches, the hyperplane, allows reproducing visually the reasoning of an ANN, but it is limited to 2-3 inputs.
B. Visualization of overlapping sets
Overlapping set visualization considers several elements, as well as sets containing all or part of these elements. The sets are overlapping: a given element can belong to more than one set. A typical simple example is the “amino-acid properties” problem. There are 20 amino-acids, which share physical or chemical properties. Amino-acids can be consid-ered as elements and properties as overlapping sets of these elements. B Alsakallah et al. recently reviewed the various methods proposed for overlapping set visualization [10] and distinguished 6 categories: Euler / Venn diagrams, overlays on a map, graphs and node-link diagrams, matrix-based techniques (rainbow boxes fit in this category), aggregation-based techniques, and scatterplot-aggregation-based techniques.
Last year, we proposed a new technique: rainbow boxes [3]. It targets small structured datasets (Figure 2). It displays the elements to be compared in columns, and the sets in labeled rectangular boxes that cover all the columns corresponding to the elements in the set. Larger boxes are placed at the bottom and two boxes can be side-by-side as long as they do not cover the same columns. A box can have holes, if the elements in the set are not displayed in consecutive columns. The technique is based on two hypothesis: (1) it exists an optimal order of the columns with a small number of holes (or even none at all) and (2) it is possible to find this order. Hypothesis 1 is application domain-dependent but seems to be valid in several situations. For hypothesis 2, the problem complexity is factorial. We proposed a heuristic algorithm to find, in a satisfying time, a near-optimal column order minimizing the number of holes.
Figure 3. An example of a perceptron (top) with 3 inputs, and its visual representation using weighted rainbow boxes, for the four following (I1, I2, I3) input vectors: (0, 1, 1), (1, 1, 1), (0, 0, 1) and (0, 0, 0) (bottom).
III. WEIGHTED RAINBOW BOXES
Weighted rainbow boxesextend rainbow boxes by adding per-set weights, represented graphically by an additional visual variable: the vertical size of the boxes. The weight of a set is represented by the height of the corresponding box. Figure 3 shows an example of weighted rainbow boxes. Let’s consider a category of perceptron, with (a) Boolean inputs (the false and true values being represented by 0 and 1, respectively), (b) a Boolean or positive real output, (c) strictly positive weights, (d) no bias (if really needed, the bias could still be added as the weight of an additional input which is always true), and (e) one of the two following activation functions: the threshold function fthres if the
output is Boolean, and the no-op function fnoopif the output
is a real, defined as follows (t being a fixed parameter): fthres(x) = 1 if x > t, 0 otherwise
fnoop(x) = x
The visual representation of the input vectors of a per-ceptron can be seen as an overlapping set visualization problem: each input vector is an element (i.e. a column in the rainbow boxes), and for each input Ii, we can define
the set (i.e. the box) of input vectors for which Ii is true.
These sets are overlapping, because a given input vector can belong to more than one set, if the input vector contains several true values. Consequently, weighted rainbow boxes can be used to visualize the input vectors as overlapping sets, using the weight of the inputs of the perceptron. Standard rainbow boxes use arbitrary “rainbow” colors; for visualizing a perceptron, we propose to use a single hue and a saturation proportional to the weight (as in Figure 3).
The boxes are stacked vertically and their height is propor-tional to the weights of the perceptron, consequently the total height of the stacked boxes corresponds to the weighted sum of the input values of the perceptron. Thus, it is very easy
to compute visually this sum. If the activation function is fnoop, the sum corresponds directly to the output value of the
perceptron for the represented input vector (see Oxin Figure
3). If the activation function is fthres, the threshold can be
represented visually by a horizontal line, whose Y coordinate corresponds to the value of the parameter t. It is easy to determine visually if the weighted sum of the input values is higher or lower than the threshold value, i.e. if the stacked boxes are higher than the threshold line or not. Therefore, weighted rainbow boxes can at the same time provide an overview of the dataset (i.e. the input vectors), display the weights of each input and allow the visual computation of the output value for each input vector.
Gaps and holes can complicate the visual computation of the output value, because in these cases the boxes are not tightly stacked. However, in practice we observed that, at least when a single hole or gap is involved, it does not prevent the visual comparison of the output values, although it can make it more difficult.
IV. APPLICATION IN ANTIBIOTHERAPY
Doctors frequently prescribe non-optimal antibiotics, de-spite the associated risks: complications for the patient and emergence of bacteria resistance [11], [12]. In primary care, the antibiotic choice should take into account 6 antibiotic properties we identified in previous studies [2], [13]: the level of efficacy, the complexity of the administration pro-tocol, the risk of emergence of bacteria resistance, the risk of adverse effects, the extent of the bacteria spectrum and the preciosity of the antibiotic class. However, in clinical practice, it is difficult for GPs to choose the best antibiotic to prescribe in a specific indication because: (i) they are not aware of all the properties of all antibiotics, (ii) the value of these properties may evolve quickly [14], (iii) they have to take a decision in a few minutes [15] whereas they don’t have any tool for comparing antibiotics. Helping GPs to compare antibiotics could improve antibiotic prescriptions. A. Knowledge base
We considered the 6 properties and 7 indications in uri-nary infections: cystitis in adults with risk of complications, cystitis in children, cystitis in normal situation (i.e. adults without risk of complications), prostatitis, pyelonephritis in adults with risk of complications, pyelonephritis in chil-dren, pyelonephritis in normal situation. We designed a knowledge base containing the values of each property for each antibiotic in each indication (the values of some prop-erty is indication-dependent). Since the medical reasoning of experts is based on the progressive exclusion of the worst antibiotics, we considered properties in their “negative form”, each property becoming a potential disadvantage: I1
moderate efficacy, I2complex protocol, I3risk of emergence
of resistance, I4risk of adverse effects, I5 broad spectrum,
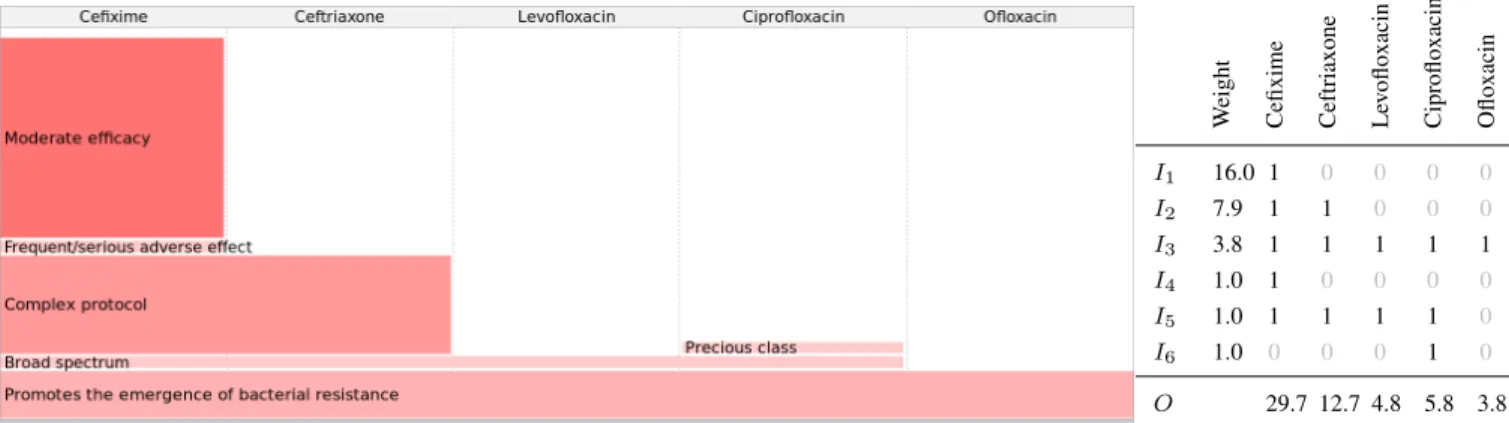
W eight Cefixime Ceftriaxone Le v ofloxacin Ciprofloxacin Ofloxacin I1 16.0 1 0 0 0 0 I2 7.9 1 1 0 0 0 I3 3.8 1 1 1 1 1 I4 1.0 1 0 0 0 0 I5 1.0 1 1 1 1 0 I6 1.0 0 0 0 1 0 O 29.7 12.7 4.8 5.8 3.8 Figure 4. Weighted rainbow boxes showing the available antibiotics and their disadvantages in the pyelonephritis indication. The table on the right shows the inputs and their weights (determined in section IV.B), and for each drug, the values of the input vector and the output.
input of the perceptron). Each disadvantage is Boolean: either it is present (true) or not (false). The knowledge base was formalized using OWL (Ontology Web Language); it belongs to the ALIF family of description logics. The OwlReady ontology-oriented programming tool [16] was used for accessing the ontology.
B. Reasoning
For determining the optimal antibiotics for a given indi-cation, experts start with the list of available antibiotics (i.e. potentially efficient in the indication), and then exclude all antibiotics presenting the most important disadvantage (i.e. moderate efficacy). If several antibiotics remains, experts then proceed similarly with the second most important disadvantage, and so on, until the optimal antibiotics are found. Thus, the best antibiotics can be retrieved by ranking the available antibiotics according to disadvantages, in the following lexicographic order: consider I1 (efficacy) first,
then I2 (protocol), then I3 (resistance) and finally I4
(ad-verse effect), I5 (spectrum) and I6 (precious class) with an
equal weight for each.
This reasoning corresponds to a single perceptron with 6 inputs (one per disadvantage), one input vector for each antibiotic (i.e. a vector of Boolean values indicating the disadvantages of the antibiotic) and one output, the ranking
Figure 5. Perceptron for the antibiotherapy application.
score (lower score being better). The perceptron remains the same for the various indications, but with different input vectors (depending on the antibiotics available for the indication and the values of the properties for the antibiotics with regards to the indication). We translated the lexicographic order between the disadvantages into the following four domain constraints on the weights:
w1> w2+ w3+ w4+ w5+ w6
w2> w3+ w4+ w5+ w6
w3> w4+ w5+ w6
w4= w5= w6
Additional visual constraints were added: (1) the mini-mum weight is 1.0 in order to display the label inside the boxes, (2) the total sum of the weights Σwi should be kept
as minimal as possible to limit the height of the interface, (3) the various weights should be different enough to allow an easy visual distinction between them. Weights were defined manually. Figure 5 shows the resulting perceptron, able to compute a ranking score for antibiotics.
C. Visualization
We used weighted rainbow boxes for visualizing the perceptron and the datasets for the 7 indications. Figures 4 and 1 show examples for pyelonephritis and for cystitis with risk of complications, with respectively 5 and 10 antibiotics. Each antibiotic is an element, displayed in a column, and each disadvantage is a set containing all antibiotics having the disadvantage, and displayed as a box. We colored the boxes in red colors, because they represent the disadvantages of the antibiotics and the red color is usually associated with negative opinion in occidental cultures. The height of each box is proportional to the importance of the corresponding disadvantage, e.g. the “moderate efficacy” box has the higher height. By summing visually the box heights in a given column, it is possible to compute a score; lower scores correspond to better antibiotics for the given indication. Thus it is easy to find visually the antibiotics with the fewest and less important disadvantages, i.e. the lowest scores. It
corresponds to the column with the lowest total box height, e.g. ofloxacin in Figure 4 and nitrofurantoin in Figure 1. Only one hole is present (in Figure 1, at the intersection of the ceftriaxone column and the frequent/serious adverse effect box).
V. USER STUDY
For assessing the simplicity and the utility of the applica-tion, we recruited 11 GPs. Three were women. Eight were between 30 and 40 years old, two between 40 and 50, and one more than 50 years old.
GPs had to visualize two datasets using weighted rainbow boxes: one comparing 5 antibiotics (Figure 4), and another comparing 10 antibiotics (Figure 1). For each, they had to score their feeling about 4 affirmations using a 5-level Likert scale. Then, for each dataset, GPs had to mention the antibiotic they will choose for the prescription. Finally, we asked the opinion of the GPs about having this kind of interface in clinical practice, and GPs were also allowed giving free-text comments.
The results are shown in Table I. GPs found the interface simpler for the 5-drug dataset than for the more complex 10-drug dataset (affirmation #1). However, for both datasets, they globally found that the disadvantages were easy to read (affirmation #2). Thus, when the number of drug increases, the interface becomes more complex but still remains easy to read. Displaying the disadvantages of antibiotics was considered as interesting for about 90% of GPs, and useful in clinical practice for more than 90% of them. In both datasets, 8 GPs choose to prescribe the antibiotic with the lowest ranked score, i.e. the one recommended using the knowledge base and the exclusion reasoning we described. Finally, 3 GPs would not like to have this kind of interface in clinical practice whereas 5 would like (3 neutral).
VI. DISCUSSION
In this paper, we described weighted rainbow boxes, a visualization technique derived from rainbow boxes, and we have shown that they enable a visual reasoning with a computing power equivalent to a perceptron. Weighted rainbow boxes can present and compare the various prop-erties of several items, as original rainbow boxes did, e.g. on amino-acids, but it can also translate visually some simple reasoning based on the properties, such as a score computation or a lexicographic order for ranking the items. We also described an application in antibiotherapy. A small user study showed that the weighted rainbow boxes were rather easy to read for GPs.
A. Weighted rainbow boxes
Weighted rainbow boxes allows the visualization of the inputs and the weights of a given perceptron, and the input vectors and the output values of a dataset for this perceptron. In the literature, we have seen that few techniques have been
proposed for visualizing input and output values, the most noticeable one being the hyperplane (see section II-A). The hyperplane is limited to 2 or 3 inputs, and does not show the weights explicitly. On the contrary, weighted rainbow boxes can support dozens of inputs, but they are limited to Boolean inputs with positive weights.
Several methods exist for training a perceptron or a neural network made of several perceptrons, such as back-propagation. However, we have seen that visual constraints must be satisfied in addition to the domain constraints, in order to obtain an efficient visualization. The visual constraints were related to the minimum height of the boxes, the limited height of the computer screen, the difficulty of the Human vision to compare very similar heights, and the exclusion of negative weights. Thus, learning methods should be adapted if one wants to learn the weights of the perceptron before visualization. In addition, usual limitations of the perceptron also apply, notably the impossibility to perform exclusive or.
B. Application in antibiotherapy
We presented an application for decision support for the treatment of urinary infections, based on the properties of antibiotics. In medicine, decision support systems are usually not based on treatment properties, but rather implement clinical guidelines developed by health authorities. These guidelines provide recommendations, in particular for pre-scribing. They are implemented in clinical decision support systems; many such systems exist [17]. However, GPs are often resistant to follow guideline recommendations because they are voluminous texts difficult to read, and they don’t always understand the argumentation of experts underlying the recommendation. This is why we proposed a different approach: a visual interface comparing the different antibi-otics rather than giving explicit recommendations. The visual interface we proposed could be integrated in electronic prescribing software and possibly connected to electronic health record (EHR) e.g. WebChart.
The results of the user study are rather promising. GPs seem convinced that the visualization of antibiotic disadvan-tages is interesting and useful for their practice, but fewer GPs found the proposed interface simple and easy to read. However, it has been shown that usability evaluations often give poor results on radically new interfaces, for which users are not accustomed to [18].
VII. CONCLUSION
In this paper, we presented weighted rainbow boxes. We showed that these techniques can translate visually the rea-soning of a perceptron. We also showed that it can be applied in antibiotherapy, with interesting results. A perspective of this work consists in improving the weighted rainbow boxes technique for the visualization of more complex neural networks (e.g. involving several perceptron or hidden units).
# Affirmation Dataset
1 I find the interface easy 5-drug 2 2 6 1
10-drug 5 3 3
2 The disadvantages of each antibioticare easy to read 5-drug 2 1 6 2
10-drug 2 2 6 1
3 I find interesting to visualize thedisadvantages of antibiotics 5-drug 1 4 6
10-drug 1 5 5
4 It is useful to visualize the disadvan-tages of antibiotics in clinical practice 5-drug 5 6
10-drug 1 4 6
5 I would like to have this system inclinical practice 1 2 3 4 1
Table I
RESULTS OF THE EVALUATION. RED MEANS“DO NOT AGREE AT ALL”,LIGHT RED“NOT AGREE”,GRAY“NEUTRAL”,LIGHT GREEN“AGREE”AND GREEN“FULLY AGREE”. THE NUMBERS INDICATES THE NUMBER OFGPS THAT GAVE THIS RESPONSE.
ACKNOWLEDGEMENTS
This work was funded by the French drug agency (ANSM, Agence Nationale de Sécurité du Médicament et des produits de santé) through the RaMiPa project (AAP-2016).
REFERENCES
[1] Abraham A, Handbook of Measuring System Design. John Wiley & Sons, 2005, ch. Artificial neural networks. [2] R. Tsopra, A. Venot, and C. Duclos, “An algorithm using
twelve properties of antibiotics to find the recommended antibiotics, as in CPGs ,” in AMIA Annu Symp Proc, vol. 1115?24, 2014.
[3] J. B. Lamy, H. Berthelot, and M. Favre, “Rainbow boxes: a technique for visualizing overlapping sets and an application to the comparison of drugs properties,” in 20th International Conference Information Visualisation, vol. 253-260, Lisboa, Portugal, 2016.
[4] G. E. Hinton, J. L. McClelland, and D. E. Rumelhart, Dis-tributed representations. MIT Press, Cambridge, 1986, vol. 77-109.
[5] J. Wejchert and G. Tesauro, “Neural network visualization,” NIPS, vol. 465-472, 1989.
[6] M. Xia, J. Wang, and Y. He, “BrainNet Viewer: a network visualization tool for human brain connectomics,” PloS one, vol. 8, no. 7, p. e68910, 2013.
[7] Duch W, Issues in intelligent systems: Paradigms. Exit, Warszawa, 2005, vol. 49-62, ch. Internal representations of multi-layered perceptrons.
[8] M. W. Craven and J. W. Shavlik, “Visualizing learning and computation in artificial neural networks,” International journal on artificial intelligence tools, vol. 1, no. 03, pp. 399– 425, 1992.
[9] M. Gallagher and T. Downs, “Visualization of learning in multilayer perceptron networks using principal component analysis,” IEEE transactions on cybernetics, vol. 33, no. 1, pp. 28–34, 2003.
[10] B. Alsallakh, L. Micallef, W. Aigner, H. Hauser, S. Miksch, and P. Rodgers, “Visualizing Sets and Set-typed Data: State-of-the-Art and Future Challenges,” in Eurographics Confer-ence on Visualization (EuroVis), 2014.
[11] S. Evans R, L. Pestotnik S, C. Classen D, P. Clemmer T, K. Weaver L, F. Orme J, F. Lloyd J, and P. Burke J, “A computer-assisted management program for antibiotics and other antiinfective agents,” The New England journal of medicine, vol. 338, no. 4, pp. 232–8, 1998.
[12] C. Llor and L. Bjerrum, “Antimicrobial resistance: risk as-sociated with antibiotic overuse and initiatives to reduce the problem,” Therapeutic advances in drug safety, vol. 5, no. 6, pp. 229–41, 2014.
[13] R. Tsopra, A. Venot, and C. Duclos, “Towards evidence-based CDSSs implementing the medical reasoning contained in CPGs: application to antibiotic prescription,” in Stud Health Technol Inform, vol. 205, 2014, p. 13?7.
[14] B. S. Alper, J. A. Hand, S. G. Elliott, S. Kinkade, M. J. Hauan, D. K. Onion, and B. M. Sklar, “How much effort is needed to keep up with the literature relevant for primary care?” Journal of the Medical Library Association : JMLA, vol. 92, no. 4, pp. 429–37, 2004.
[15] M. Deveugele, A. Derese, A. van den Brink-Muinen, J. Bens-ing, and J. De Maeseneer, “Consultation length in general practice: cross sectional study in six European countries,” BMJ (Clinical research ed.), vol. 325, no. 7362, p. 472, 2002. [16] Lamy JB, “Ontology-Oriented Programming for Biomedical Informatics,” Stud Health Technol Inform, vol. 221, pp. 64– 68, 2016.
[17] V. Sintchenko, E. Coiera, and G. L. Gilbert, “Decision sup-port systems for antibiotic prescribing,” Current opinion in infectious diseases, vol. 21, no. 6, pp. 573–9, 2008. [18] S. Greenberg and B. Buxton, “Usability evaluation considered
harmful (some of the time),” in CHI 2008 Proceedings, vol. 111-120, 2008.