HAL Id: hal-01348434
https://hal.archives-ouvertes.fr/hal-01348434
Submitted on 13 Aug 2016
HAL is a multi-disciplinary open access
archive for the deposit and dissemination of
sci-entific research documents, whether they are
pub-lished or not. The documents may come from
teaching and research institutions in France or
abroad, or from public or private research centers.
L’archive ouverte pluridisciplinaire HAL, est
destinée au dépôt et à la diffusion de documents
scientifiques de niveau recherche, publiés ou non,
émanant des établissements d’enseignement et de
recherche français ou étrangers, des laboratoires
publics ou privés.
Rainbow boxes: a technique for visualizing overlapping
sets and an application to the comparison of drugs
properties
Jean-Baptiste Lamy, Hélène Berthelot, Madeleine Favre
To cite this version:
Jean-Baptiste Lamy, Hélène Berthelot, Madeleine Favre. Rainbow boxes: a technique for visualizing
overlapping sets and an application to the comparison of drugs properties. International Conference
Information Visualisation 2016, Jul 2016, Lisbonne, Portugal. �hal-01348434�
Rainbow boxes: a technique for visualizing overlapping sets and an application to
the comparison of drugs properties
Jean-Baptiste Lamy, Hélène Berthelot LIMICS, Université Paris 13 - Sorbonne Paris Cité,
UPMC Université Paris 6, Sorbonne Universités, INSERM UMRS 1142, Bobigny, France Email: [email protected]
Madeleine Favre
Dept. of primary care, Université Paris Descartes, Société de Formation Thérapeutique du Généraliste (SFTG)
Paris, France Email: [email protected]
Figure 1. Rainbow boxes displaying the 79 contraindications (26 distinct) of 8 drugs for erectile dysfunction. The drugs are shown in columns and the contraindications in rectangular horizontal boxes (possibly with holes) covering the columns corresponding to the drugs sharing the contraindications.
Abstract—Overlapping set visualization is a well-known problem in information visualization. This problem considers elements and sets containing all or part of the elements, a given element possibly belonging to more than one set. A typical example is the properties of the 20 amino-acids. A more complex application is the visual comparison of the contraindications or the adverse effects of several similar drugs. The knowledge involved is voluminous, each drug has many contraindications and adverse effects, some of them are shared with other drugs.
In this paper, we present rainbow boxes, a novel technique for visualizing overlapping sets, and its application to the properties of amino-acids and to the comparison of drug properties. We also describe a user study comparing rainbow boxes to tables and showing that the former allowed physicians
to find information significantly faster. We finally discuss the limits and the perspectives of rainbow boxes.
Keywords-overlapping set visualization; knowledge visualiza-tion; drug properties; user study;
I. INTRODUCTION
Drugs have many properties such as indications, con-traindications, interactions, adverse effects, etc. These prop-erties are listed in official textual documents called summary of product characteristics (SPCs) and then gathered into drug databases. The user interfaces of these databases allow a
physician to consult the properties of a single drug, but not to compare several drugs with the same indication. The VIIIP (Integrated Visualization of Information about Phar-maceutical Innovation) research project aims at facilitating the comparison of new drugs with the older similar drugs, and proposing visual interface for this task. However, the clear and concise presentation of the properties of a single drug is already difficult, and thus the visual comparison of the properties of 2-10 drugs is a real challenge.
The comparison of drug properties can be expressed as an overlapping set visualization: drugs can be considered as elements, and their properties (e.g. contraindications or adverse effects) as sets including all drugs sharing the prop-erty. Overlapping set visualization is a well-known field in information visualization. Several elements are considered, as well as sets containing all or part of these elements. The sets are overlapping, i.e. a given element can belong to more than one set. The objective of the visualization is to show clearly which elements belong to a given set, which sets include a given element but also to elicit new knowledge.
A typical and simple example of overlapping sets is the “amino-acid properties” problem (see Figure 2). There are 20 amino-acids (e.g. Alanine, Proline) often abbreviated by their 3-letter codes (Ala, Pro) or by their 1-letter code (A, P). Several amino-acids share some physical or chemical properties, such as their small size, the presence of an aromaticcycle or a positive electric charge. A given amino-acid can have zero, one or several properties (e.g. Histidine has both an aromatic cycle and a positive charge). Thus the amino-acids can be considered as elements and the properties as overlapping sets of these elements. About 10 such prop-erties are usually considered. In addition, propprop-erties are not independent from each other: for example, it is obvious that all tiny amino-acids are also small, and amino-acids with an aromaticcycle cannot be small (because the aromatic cycle is a big chemical structure). A good visualization is expected to show clearly which are the properties of a given amino-acid and which amino-amino-acids share a given property, but also to facilitate the discovery of new knowledge about the amino-acids (e.g. Tyrosine and Tryptophan share the same properties and thus they possibly exhibit similar biological behavior) and their properties (e.g. the relation between the small and aromatic properties detailed above).
In this paper, we present rainbow boxes, a novel tech-nique for visualizing overlapping sets that we developed for comparing drug properties. Rainbow boxes are well-suited for knowledge visualization. They aim at presenting relatively small datasets, typically involving 2-25 elements and 5-100 sets, and at helping the discovery of classes of similar elements or sets.
The rest of the paper is organized as follows. Section II presents related works. Section III describes rainbow boxes on the simple amino-acid example. Section IV describes the use of rainbow boxes for comparing drug properties.
Section V gives implementation details. Section VI describes a user study that has been conducted to evaluate rainbow boxes in the drug comparison application. Finally, section VII discusses the results and proposes perspectives.
Ile Leu Val Met His Try Tyr Phe Lys Arg Asp Glu Gln Thr Ala Cys Gly Ser Pro Asn Small Hydrophobic Polar Aliphatic Essential Negative Positive Tiny Aromatic
Figure 2. Venn diagram showing 9 properties of the 20 amino-acids.
II. RELATED WORKS
A. Overlapping set visualization
B. Alsakallah et al. recently reviewed the various meth-ods proposed for overlapping set visualization [1]. They distinguished 6 approaches: (1) Euler / Venn diagrams and their variants represent an element by a dot and a set by a closed curve containing all the dots that correspond to the elements in the set (see amino-acid example Figure 2). These diagrams are easy to read but become more and more complex when the number of sets increases above 4. Additionally, it is difficult to generate automatically Euler / Venn diagrams, although not impossible [2]. Variants use lines instead of closed curves [3]. (2) Overlays rely on a map, for elements that have a geographic location. (3) Node-link diagrams represent the relation between elements and sets as edges of a bipartite graph, like in Jigsaw [4]. (4) Matrix-based techniques represents sets and elements in the rows and the columns of a two-dimensional matrix. (5) Aggregation-based techniques aggregates the data, for instance by computing frequencies, number of elements per set or co-occurrences between sets, and then visualize the aggregation. These techniques are interesting for very large datasets. An example is Radial Sets [5]. (6) Scatterplot-based techniques compute the distance between each pair of elements, based on their set memberships, and then project the elements on a two-dimensional plot.
B. Comparison of drug properties
Very few systems have been proposed for visualizing the properties of several drugs together, and all of them relied on simple matrices for displaying drug properties. Wroe
Figure 3. Rainbow boxes showing 10 properties of the 20 amino-acids.
et al. [6] proposed DOPAMINE, a spreadsheet-like matrix-based tool, but this approach was limited and mostly aimed toward reviewing and authoring drug properties. Iordatii et al. [7] proposed a similar approach for comparing the contraindications and the adverse effects of a new drug to a reference drug. They used tabular matrices enriched by colors. Drug Fact Boxes [8] offer some comparative drug information, but limited to a few drugs and targeting patients rather than physicians.
Duke et al. [9] designed an original system for viewing the adverse effects of several drugs. The effects are “summed” together; this system is interesting for analyzing the risk associated with a drug order including several drugs, but is not aimed at the comparison of similar drugs. Finally, GraphSAW [10] is a graph-based tool for visualizing drug-drug and drug-drug-enzyme interactions and their relations with drugs adverse effects.
III. RAINBOW BOXES
A. General principles
Rainbow boxes are a new technique for overlapping set visualization, inspired by the matrix approaches. It aims at visualizing relatively small datasets in detail and in particular knowledge expressed as overlapping sets.
Figure 3 shows rainbow boxes displaying the amino-acid properties. In rainbow boxes, the elements are displayed in columns. Each set is displayed as a rectangular box covering all the columns corresponding to the elements contained in the set; the label of the set is shown inside the box. Sets that are identical (i.e. they include the same elements) are grouped in a single box. When necessary, holes are present in a box (e.g. at the right of the small box in Figure 3). The elements are ordered so as to limit the number of holes as much as possible, using an algorithm described thereafter. Wider boxes are placed at the bottom (global width is considered, including holes). Then boxes are stacked at the bottom like blocks in a “Tetris” game, i.e. several boxes can be side by side as long as they do not occupy the same columns.
By default, rainbow boxes do not use colors to add extra information but rather to facilitate the reading and make the visualization more appealing. Colors are attributed as
following: each element receives a different color, ranging from red (left-most element) to violet (right-most element) across the whole spectrum. The color of a box is the mean (in RGB coordinates) of the colors of the elements it contains. Consequently, a set including a single element has the same, bright, color than the element, while bigger sets with many elements tend to be grayish.
Nevertheless, colors can also be manually specified for each (element, set) pair, in order to convey additional information (we will see an example later on drugs adverse effects). Boxes can also include hatches for representing partial membership: for instance, in Figure 3, semi-essential amino-acids (i.e. Tyr, Cys and Gly) are represented with hatches in the essential box.
Rainbow boxes show set memberships of elements, but also allow users to find new relations and similarities be-tween elements or sets. For example, in Figure 3, set inclu-sions are easy to see, e.g. all tiny amino-acids are also small (since the small box covers all columns covered by the tiny box) as well as set disjointness, e.g. aromatic amino-acids are not small (the aromatic and small boxes have no common column). Additionally, it is striking that essential amino-acids are almost the same ones as hydrophobic amino-amino-acids (the two boxes spread over almost the same columns and thus have similar colors).
Interactivity can be added to rainbow boxes by showing popup bubbles with extra information when the mouse is over column headers or boxes, and by allowing the user to select two distinct elements to obtain a two-element comparison.
B. Column ordering
For drawing optimal rainbow boxes with the smallest possible number of holes, the column/element order must be optimized. Testing all possible orders would be problematic, because the number of possible orders is n! (i.e. factorial n) where n is the number of elements, and thus it increases greatly with n. The complexity of this problem is O(n!). For the amino-acid example, there are 20! ≈ 2.43x10¹⁸
possible orders. To solve this problem in a satisfying time, we propose a heuristic for computing a (near-to-)optimal element order in a short time. It first generates a small set
Algorithm 1 The heuristic algorithm for finding candidate near-to-optimal element orders (candidate_orders). elements is a set including all elements, and sets a set including all sets.
candidate_first_elements= { e0 for each element e0 in elements belonging to the highest number of set in sets } orders_being_constructed= { tuple (e0) for each element e0 in candidate_first_elements }
candidate_orders= { } (empty set) while orders_being_constructed 6= { }:
order = Get and remove one tuple from orders_being_constructed remnant = elements\ order
possible_insertions= { (e, "beginning") for each e in remnant }S
{ (e, "end") for each e in remnant } for each couple (e, position) in possible_insertions with the highest insertion_score(e, position, order):
if position is "beginning": new_order = (e, order) else if position is "end": new_order = (order, e)
if elements \ new_order = { }: Add new_order into candidate_orders else: Add new_order into orders_being_constructed
function insertion_score(element, position, order):
if position is "beginning": neighbor = First element of order else if position is "end": neighbor = Last element of order score= 0
for each set x in sets, such as (element ∈ x) and (neighbor ∈ x): score = score + 2 for each set y in sets, such as (element /∈ y) and (orderT
y= { }): score = score + 1 return score
of candidate orders, and then tests all these candidate orders for finding the best one (i.e. the one leading to the fewest and shortest holes in the rainbow boxes). On the amino-acid example, it tested 204 candidate orders.
The heuristic for generating candidate orders is shown in Algorithm 1. Candidate order is constructed progressively, starting with e0, the element belonging to the highest number of sets, and thus the most “difficult” element to place (i.e. the one that is the most susceptible to create holes, since its column will contain the highest number of boxes). Then, remnant elements are added one by one at the beginning or the end of the order being constructed. The element to insert and its position (at the beginning or at the end) is determined by computing a score for each possible insertion and choosing the insertion with the highest score. The score takes into account (a) the number of sets that include both the element to insert and the actual first (if inserting at the beginning) or last (if inserting at the end) element in the order being constructed, and (b) the number of sets that do not include the element to insert and any element already placed in the order being constructed. Part (a) favors the insertion of an element that belongs to the same sets as its future neighbor. Part (b) favors the insertion of an element that does not belong to a set that is not yet present in the order being constructed, i.e. it avoids beginning a new box too early. Whenever several best choices are possible for choosing e0 or the next insertion, all possibilities are considered, thus producing several candidate orders.
IV. APPLICATION TO THE COMPARISON OF DRUGS PROPERTIES
In this section, we describe the application of rainbow boxes to the visualization of two categories of drug
proper-ties: contraindications and adverse effects (a third category, interactions, has also been studied, but is very similar to contraindications in terms of visualization and thus it is not described here).
A. Comparison of contraindications
Figure 1 shows the contraindications of 8 drugs for erectile dysfunction, using rainbow boxes. The basic rainbow boxes described in section III have been enriched with: (a) headers showing pharmaceutical classes of drugs, above the column labels, e.g. “Prostaglandin E1” for Vitaros®,
(b) hatches for indicating unadvised situations, i.e. non-absolute contraindications, for example severe renal failure for Cialis®, (c) per-cell widgets, for providing additional
information on a given contraindication for a specific drug, such as the “(non-controlled)” label for the “arterial hyper-tension” contraindication of Cialis® or the colored bars in the “Age” box, (d) VCM icons on the right of the boxes.
The VCM (Visualization of Concepts in Medicine) iconic language [11] provides icons for representing the main medical concepts, including patient conditions and disorders. VCM includes a set of graphical primitives (colors, shapes and pictograms) and a graphical grammar to combine them for creating icons. VCM represent a clinical condition by an icon with a color, a basic shape with zero, one or more shape modifiers and a central pictogram. The color indicates the temporal aspect of the icon: red for current states of the patient, orange for risk of future states, and brown for past states. The basic shape is a circle for physiological states or a square for pathological states. The central pictogram indi-cates the anatomico-functional location (e.g. endocrine sys-tem) or the patient characteristic (e.g. pregnancy) involved; special pictograms are available for a few specific disorders
Figure 4. Rainbow boxes displaying 116 adverse effects (56 distinct) of 8 drugs for erectile dysfunction. Custom colors are used for indicating seriousness (red and orange hue) and frequency (saturation).
associated with a specific anatomico-functional location (e.g. diabetes for endocrine system). Shapes modifiers can be added to specify (a) a general pathological processes (e.g. inflammation or tumor), and (b) a “transverse” anatomical structure that can be present in many anatomico-functional locations (e.g. blood vessels, which are present in most organs).
Rainbow boxes in Figure 1 show the contraindications of the 8 drugs, but also highlight the similarities between drugs and in particular the similarities associated with the two pharmaceutical classes. For instance, contraindication with the predisposition to priapism is clearly a common property of all prostaglandin E1 drugs.
Interactivity has also been added to this visualization: by clicking on columns, the user can display a comparison limited to two drugs (Figure 5), made of three parts: on the top-left and top-right corners, contraindications specific to the first and the second drugs, respectively, on the bottom, contraindications shared by the two drugs. In each part, the contraindications are also sorted by System Organ Class (SOCs, e.g. cardiovascular system).
Figure 5. Comparison of the contraindications of Vitaros®with those of Viagra®.
B. Comparison of adverse effects
Figure 4 shows an example of rainbow boxes comparing adverse effects on the same eight drugs. Adverse effects are more complex to visualize than contraindications, because they are characterized by two additional attributes: serious-ness and frequency. Seriousserious-ness is a boolean attribute and, for frequency, 5 values are usually considered: very rare, rare, infrequent, frequent and very frequent. For keeping a manageable number of adverse effects, only serious and/or frequent and very frequent effects have been considered.
The two attributes have been represented by the use of custom colors on each cell. The hue indicates the serious-ness (red: serious, orange: not serious) and the saturation indicates the frequency (more saturated colors corresponding to more frequent effects). Some boxes can have different colors in various columns, e.g. the “Penile pain” box is less saturated for Vitaros® because this effect occurs less
frequently than with the other prostaglandin E1 drugs. Figure 4 allows users to easily find several statements, such as: “Vitaros® has a lot of non-serious adverse effects”, “Viagra® has many serious adverse effects, most of them being shared with Cialis®”, or “Spedra® is the drug with the fewest adverse effects”. Notice that the order of the drugs differs between Figure 1 and 4, because drugs sharing contraindications are not the same as drugs sharing adverse effects (this is a known phenomenon is pharmacology).
V. IMPLEMENTATION
We implemented the system in Python 3, in two parts: a module for generating rainbow boxes and another for gathering drug properties. The first module produces HTML pages with CSS and some JavaScript. The second allows either to enter drug properties manually or to extract them automatically from the French Thériaque drug database or from the SPCs (for adverse effects only). The contraindica-tions were coded in ICD-10 (International Classification of Disease, 10threlease) and adverse effects in MedDRA
(Med-ical Dictionary for Regulatory Activities). PyMedTermino [12] was used for managing the two medical terminologies. Drug properties were stored in a formal ontology [13] in OWL/XML.
The full website (in French), aiming at compar-ing new drugs to older similar drugs and featurcompar-ing rainbow boxes for 4 drug sets, can be consulted at http://www.lesfleursdunormal.fr/static/viiip_proto/html ; the first module, producing HTML rainbow boxes in Python, can be downloaded at http://bitbucket.org/jibalamy/rainbowbox as a Free Software (licensed under GNU LGPL v3), includ-ing the examples shown in this paper.
VI. USER STUDY
A. Study design
Rainbow boxes were evaluated during a user study and compared to tables. Tables were matrices with drugs in
columns and contraindications or adverse effects in rows (Figure 6). Various colored symbols were used for rep-resenting contraindications, unadvised conditions, and the frequency and seriousness of adverse effects. In addition, tables were dynamic and interactive: they allowed the user to show the properties of a single drug, to compare the properties of two drugs or to show all properties for all drugs.
Figure 6. An excerpt of a dynamic table displaying adverse effects of drugs for erectile dysfunction.
The user study followed a crossover experimental de-sign. 3 drug sets were manually extracted, each drug set included 2 comparisons (contraindications, adverse effects) and each comparison was visualized using the 2 approaches (dynamic table, rainbow boxes). This produced 12 (= 3x2x2) documents. 12 single-choice questions were written and validated by medical experts (2 questions for each com-parison). Each question involved at least two drugs and its answer was present in the corresponding comparison, e.g. “Is Vitaros® better than Edex® for patients with a penile implant? (Yes/No)” or “Which drug has the highest number of serious cardiac adverse effects? (Vitaros®/Caverject®/ etc, 8 candidate responses)”.
Physicians were recruited and briefly introduced to dy-namic tables and rainbow boxes (about 15 minutes). They had to answer each question on a computer, using the associated document, either dynamic table or rainbow boxes. Physicians were divided in 2 groups; for a given comparison, the first group has to respond to the first question with dynamic table and to the second question with rainbow boxes, while it was the contrary for the second group. When the candidate responses were drug names, they were ordered in the same order as in the visualization. The questions were ordered so as the two questions based on the same comparison were not next to each other, and two “warm-up” questions were added at the beginning but their results were not taken into account.
During the test, we measured the correctness of the answers and the response time; after, we measured the perceived usability through a SUS (System Usability Scale) questionnaire [14]. Data were analyzed with R software version 3.2.3. A general discussion was conducted with the
physicians after the test. B. Results
22 physicians were recruited (12 males, 10 females, mean of age: 54.6 years). They were interested in drug comparisons and very enthusiastic. 9 physicians preferred tables and 7 rainbow boxes (6 had no preference). The SUS score was 72.0 for tables and 66.9 with rainbow boxes, this difference is not significant (p-value 0.25, Wilcoxon test).
99 answers out of 132 (75%) were correct with tables ver-sus103 out of 132 (78%) with rainbow boxes, this difference is not significant (p-value 0.66, Pearson’s Chi-squared test with Yates’ continuity correction). Mean response time was 39.0 seconds with tables versus 29.7 seconds with rainbow boxes, this difference is significant at risk α = 5% (p-value 0.011, Welch Two Sample t-test performed on log(response time) for normalizing distributions).
During the discussion, physicians told us that they were used to tables but that rainbow boxes were difficult to understand at the beginning. They found that both would be good at answering different types of questions in their everyday life. They considered tables better for using during consultation, when the physician has a particular patient in mind. On the contrary, they found rainbow boxes better for continuing education, when the physician needs a global overview of the available drugs.
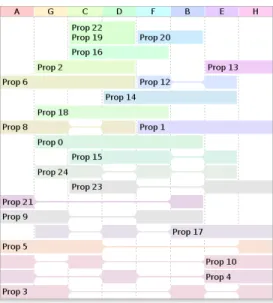
Figure 7. Rainbow boxes representing a random dataset of similar size than the one in Figure 1.
VII. DISCUSSION
A. Rainbow boxes
B. Alsallaks et al. [1] described various tasks expected for overlapping set visualization: 7 tasks related to elements, 14 related to sets and 5 related to element attributes. Rainbow boxes can support many of these tasks, including basic
element tasks (A1-3), set tasks related to inclusion (B2-3), exclusion (B4), intersection (B5-8) and similarity (B11).
Rainbow boxes were efficient for visualizing drug prop-erties. However, drugs exhibit an important “class-effect”, i.e. drugs tend to share common properties, determined by their chemical structures, pharmacological mechanisms or administration routes. On the contrary, when tested on randomly generated data of similar size than the drug applications (same number of elements, sets, and element-set memberships), rainbow boxes lead to complex and hard-to-read visualizations (Figure 7). As a consequence, rainbow boxes are probably better-suited for visualizing elements for which underlying classes of similar elements exist (these classes can be already known or still to discover).
For optimizing elements ordering, several other methods were tried, but the results were not as good as the proposed heuristic. Principal component analysis (PCA) was tested: each set was considered as a dimension and each element as a point in that space. For a given dimension, the point coordi-nate was set to 1 if the element belongs to the corresponding set and to 0 otherwise. Then the first PCA’s resulting dimension was used to order the elements. Tree building algorithms were also tested (unweighted pair group method with arithmetic mean, UPGMA, and neighbor-joining), and then the tree was flattened. However, as the node’s children are not ordered in trees, these methods yielded to poor results. Finding the optimal node’s children ordering requires to test all possible orders. For the amino-acid example, this required to test 524 288 orders for UPGMA and 786 432 for neighbor-joining, which is less efficient than the heuristic described here.
B. Application to the comparison of drug properties Rainbow boxes were applied successfully to the com-parison of drug properties. User study results showed that physicians slightly preferred tables to rainbow boxes (SUS score 72.0 vs 66.9) but they were able to find information significantly faster with rainbow boxes. These results are not necessarily contradictory: SUS measures perceived usability but it is known that user satisfaction is not always correlated with real effectiveness and efficiency [15]. The lower SUS score for rainbow boxes might be explained by the fact that physicians were already used to tables but were entirely new to rainbow boxes. Some of the physicians also spontaneously suggested that their age (mean: 54.6 years) might also ex-plain that they had difficulties with new computer interfaces. During the user study, rainbow boxes were compared to dynamic tables. Tables were chosen as a reference because it seemed the simplest and “natural” way for presenting drug properties to the authors but also in the literature [6], [7]. Dynamic tables were an interactive improvement of plain tables. A comparison with plain non-dynamic tables would probably lead to a bigger difference in response time.
As suggested by physicians, rainbow boxes would be es-pecially useful for education, e.g. for teaching the properties of the various drugs and drug classes.
C. Perspectives
Rainbow boxes could be improved by taking into account inclusion relations existing between sets. Some of these relations can be already known (e.g. on the amino-acid example, it is already known that the set of tiny amino-acids is included in the set of small amino-acids) and could thus be represented in the visualization, typically by incorporating the tiny box inside the small box.
Many qualitative data and domains of knowledge can be considered as overlapping sets. Thus rainbow boxes could be applied to many other domains, especially for visualizing knowledge about several items that are organized in classes of similar items. Potential application domains include bioin-formatics (e.g. for visualizing parts of Gene Ontology), search engines, species classification and taxonomies, vi-sualization of instances in an ontology, knowledge domain visualization, etc.
VIII. CONCLUSION
In this article, we presented rainbow boxes, a novel technique for visualizing overlapping sets, and an application to the comparison of drug properties. We described a user study showing that rainbow boxes allowed physicians to find a given information significantly faster than with tables, but also that they may need training before using this new tool. Rainbow boxes are particularly efficient for visualizing the similarities between known or yet-to-discover classes of elements or sets, and they could potentially be applied to many other domains.
ACKNOWLEDGEMENTS
This work was funded by the French drug agency (ANSM, Agence Nationale de Sécurité du Médicament et des produits de santé) through the VIIIP project (AAP-2012-013).
REFERENCES
[1] B. Alsallakh, L. Micallef, W. Aigner, H. Hauser, S. Miksch, and P. Rodgers, “Visualizing Sets and Set-typed Data: State-of-the-Art and Future Challenges,” in Eurographics Confer-ence on Visualization (EuroVis), 2014.
[2] P. Simonetto, D. Auber, and D. Archambault, “Fully Auto-matic Visualisation of Overlapping Sets,” in Eurographics/ IEEE-VGTC Symposium on Visualization, vol. 28, no. 3, 2009.
[3] B. Alper, N. H. Riche, G. Ramos, and M. Czerwinski, “De-sign study of LineSets, a novel set visualization technique,” in IEEE transactions on visualization and computer graphics, vol. 17, no. 12, 2011, pp. 2259–2267.
[4] J. Stasko, C. Görg, Z. Liu, and K. Singhal, “Jigsaw: Support-ing Investigative Analysis through Interactive Visualization,” Information visualization (IVS), vol. 7, no. 2, pp. 118–132, 2008.
[5] B. Alsallakh, W. Aigner, S. Miksch, and H. Hauser, “Radial Sets: Interactive Visual Analysis of Large Overlapping Sets,” in IEEE Transactions on Visualization and Computer Graph-ics (Proceedings Information Visualization 2013), vol. 19, no. 12, 2013, pp. 2496–2505.
[6] C. Wroe, W. Solomon, A. Rector, and J. Rogers, “DOPAMINE: a tool for visualizing clinical properties of generic drugs,” in Proceedings of the Fifth Workshop on Intelligent Data Analysis in Medicine and Pharmacology (IDAMAP), vol. 61-65, 2000.
[7] M. Iordatii, A. Venot, and C. Duclos, “Design and evaluation of a software for the objective and easy-to-read presentation of new drug properties to physicians,” BMC medical infor-matics and decision making, vol. 15, p. 42, 2015.
[8] L. M. Schwartz, S. Woloshin, and H. G. Welch, “The Drug Facts Box: Improving the communication of prescription drug information,” Ann Intern Med., vol. 150, pp. 516–27, 2009.
[9] J. D. Duke, X. Li, and S. J. Grannis, “Data visualization speeds review of potential adverse drug events in patients on multiple medications,” J Biomed Inform, vol. 43, no. 2, pp. 326–331, 2009.
[10] A. Shoshi, T. Hoppe, B. Kormeier, V. Ogultarhan, and R. Hofestädt, “GraphSAW: A web-based system for graphical analysis of drug interactions and side effects using pharma-ceutical and molecular data,” BMC medical informatics and decision making, vol. 15, no. 1, p. 139, 2015.
[11] J. B. Lamy, C. Duclos, A. Bar-Hen, P. Ouvrard, and A. Venot, “An iconic language for the graphical representation of medical concepts,” BMC Medical Informatics and Decision Making, vol. 8, p. 16, 2008.
[12] J. B. Lamy, A. Venot, and C. Duclos, “PyMedTermino: an open-source generic API for advanced terminology services,” Stud Health Technol Inform, vol. 210, pp. 924–928, 2015.
[13] S. Schulz and L. Jansen, “Formal ontologies in biomedical knowledge representation,” Yearb Med Inform, vol. 8, pp. 132–46, 2013.
[14] A. Bangor, P. Kortum, and J. Miller, “Determining what individual SUS score mean: adding an adjective rating scale,” J Usability Stud, vol. 4, pp. 114–123, 2009.
[15] E. Frøkjær, M. Hertzum, and K. Hornbæk, “Measuring Us-ability: Are Effectiveness, Efficiency, and Satisfaction Really Correlated?” in Proceedings of the ACM CHI 2000 Confer-ence on Human Factors in Computing Systems, vol. 345-352, The Hague, The Netherlands, 2000.