HAL Id: hal-02903489
https://hal.archives-ouvertes.fr/hal-02903489
Submitted on 31 Aug 2020
HAL is a multi-disciplinary open access
archive for the deposit and dissemination of
sci-entific research documents, whether they are
pub-lished or not. The documents may come from
teaching and research institutions in France or
abroad, or from public or private research centers.
L’archive ouverte pluridisciplinaire HAL, est
destinée au dépôt et à la diffusion de documents
scientifiques de niveau recherche, publiés ou non,
émanant des établissements d’enseignement et de
recherche français ou étrangers, des laboratoires
publics ou privés.
Elevated atmospheric CO 2 negatively impacts
photosynthesis through radiative forcing and
physiology-mediated climate feedback
Peng Zhu, Qianlai Zhuang, Philippe Ciais, Lisa Welp, Wenyu Li, Qinchuan
Xin
To cite this version:
Peng Zhu, Qianlai Zhuang, Philippe Ciais, Lisa Welp, Wenyu Li, et al.. Elevated atmospheric CO
2 negatively impacts photosynthesis through radiative forcing and physiology-mediated climate
feed-back. Geophysical Research Letters, American Geophysical Union, 2017, �10.1002/2016GL071733�.
�hal-02903489�
University, Beijing, China,5Department of Geography and Planning, Sun Yat-Sen University, Guangzhou, China
Abstract
Increasing atmospheric CO2 affects photosynthesis involving directly increasing leaf carboxylation rates, stomatal closure, and climatic effects. The direct effects are generally thought to be positive leading to increased photosynthesis, while its climatic effects can be regionally positive or negative. These effects are usually considered to be independent from each other, but they are in fact coupled through interactions between land surface exchanges of gases and heat and the physical climate system. In particular, stomatal closure reduces evapotranspiration and increases sensible heat emissions from ecosystems, leading to decreased atmospheric moisture and precipitation and local warming. We use a coupled earth system model to attribute the influence of the increase in CO2 on gross primary productivity (GPP) during the period of 1930–2011. In our model, CO2radiative effects cause climate change that has only a negligible effect on global GPP (a reduction of 0.9 ± 2% during the last 80 years) because of opposite responses between tropical and northern biomes. On the other hand, CO2 physiological effects on GPP are both positive, by increased carboxylation rates and water use efficiency (7.1 ± 0.48% increase), and negative, by vegetation-climate feedback reducing precipitation, as a consequence of decreased transpiration and increased sensible heat in areas without water limitation (2.7 ± 1.76% reduction).When considering the coupled atmosphere-vegetation system, negative climate feedback on photosynthesis and plant growth due to the current level of CO2 opposes 29–38% of the gains from direct fertilization effects.1. Introduction
Gross primary productivity (GPP) plays a crucial role in driving the land carbon cycle. Process-based and data-driven models have been used to evaluate how global GPP responds to climate change and rising CO2 concentrations [Beer et al., 2010; Jung et al., 2011; Piao et al., 2013]. Models andfield experiments agree on the fact that elevated CO2increases carboxylation rates and GPP (hereafter fertilization effect) in absence of nutrient limitations and decreases leaf-scale stomatal conductance [Medlyn et al., 2015]. The radiative forcing of elevated CO2(eCO2) also causes climate change, which can increase or reduce GPP depending on regional temperature and water limitations, with water limitations being today prominent over most of ecosystems [Beer et al., 2010]. Therefore, there are large uncertainties about the magnitude and regional patterns of the net GPP response to the joint perturbation of eCO2concentration and climate change [Beer et al., 2010]. Most studies of GPP trends with process-based land carbon models have been conducted by using so-called off-line simulations where atmospheric forcing conditions are imposed to an ecosystem model, but there is no feedback from the land surface to the atmosphere [Piao et al., 2013; Beer et al., 2010]. Coupled climate-carbon cycle models include both impacts of CO2through climate change and vege-tation fertilization, but previous simulations did not fully separate the two mechanisms [Friedlingstein et al., 2006; Arora et al., 2013; Matthews et al., 2007]. In a coupled climate-carbon models, climate change affects GPP differently across regions and time of the year, depending upon local temperature or water limitations [Matthews et al., 2007; Cox et al., 2000]. In addition, vegetation-climate feedback occur when plants close their stomates and decreased transpiration under elevated CO2. This antitranspirant effect of eCO2leads to more soil moisture being available for plants in the dry season and changes the partition of net radiation between
weakens CO2fertilization mainly by
reducing precipitation Supporting Information: • Supporting Information S1 Correspondence to: Q. Zhuang, [email protected] Citation:
Zhu, P., Q. Zhuang, P. Ciais, L. Welp, W. Li, and Q. Xin (2017), Elevated atmospheric CO2negatively impacts
photosynthesis through radiative forcing and physiology-mediated climate feedback, Geophys. Res. Lett., 44, 1956–1963, doi:10.1002/2016GL071733. Received 28 OCT 2016
Accepted 13 FEB 2017
Accepted article online 16 FEB 2017 Published online 25 FEB 2017
©2017. American Geophysical Union. All Rights Reserved.
latent heat (evapotranspiration) and sensible heat. Increases in vegetation cover and leaf area index due to CO2fertilization can, however, offset the effect of leaf-level stomatal closure by increasing the surface of leaves available for transpiration [Ukkola et al., 2015; Donohue et al., 2013].
Previous research on carbon-climate feedback under eCO2 mainly focused on the eCO2-fertilization (a negative feedback on climate change through increased carbon sinks caused by higher GPP) and on eCO2-induced climate change. Vegetation-climate feedback under eCO2have been shown to decrease atmo-spheric humidity [Cao et al., 2010] and precipitation [Andrews et al., 2011; Boucher et al., 2009], which warms land surface temperature and in turn impacts GPP. But the effect of climate change from eCO2 through vegetation-climate feedback on GPP has not been separated from the CO2-fertilization effect in previous stu-dies. Here we use the terms eCO2-VCF to denote climate change caused by vegetation-climate feedback under eCO2and eCO2-FERT for the CO2 fertilization effects on GPP. The diagram in Figure 1 presents the three mechanisms by which eCO2influences GPP and ecosystem carbon cycling. This study aims to isolate these mechanisms for their impact on terrestrial GPP in a series of factorial experiments with the Community Earth System Model-Biogeochemistry (CESM-BGC) Earth System model integrated from 1850 to 2011.
2. Methods
The CESM1.2.2-BGC Earth System model is used in this study, its land model being CLM4.5CN. To distinguish the effects of eCO2-FERT and eCO2-VCF in determining changes on terrestrial GPP, we performed 162 year (1850–2011) simulations at 2.5° × 1.9° spatial resolution with six scenarios as follows: (1) A control simulation (CTR), in which the coupled atmosphere land carbon system is forced by the preindustrial CO2concentration of 285 ppm; (2) a CO2radiative climate change simulation (eCO2-RAD), in which GPP is only influenced by CO2 radiative effects; to this end, the atmosphere was forced by transient (1850–2011) CO2concentration, while GPP was calculated by using the preindustrial CO2concentration; (3) an eCO2-FERT + VCF simulation, in which GPP responds to both CO2fertilization and climate change from vegetation-climate feedback; to do so, the land model of CESM1.2.2-BGC was forced by a transient CO2concentration, while the atmospheric model was forced by the preindustrial CO2concentration; (4) an off-line control simulation (OCTR) in which the CTR climate variables were used to drive the CLM4.5CN land model in an off-line mode, with the preindustrial CO2concentration of 285 ppm; (5) an off-line CO2fertilization simulation (eCO2-FERT) with transient CO2and CTR climate variables; and (6) a coupled simulation (ALL) with both land and atmosphere driven by transient CO2 (Table S1 in the supporting information). All experiments were configured with the same initial
Figure 1. Schematic diagram of CO2’s three pathway influence on terrestrial GPP. The rising atmospheric CO2 concen-tration will facilitate plant uptake of CO2through photosynthesis (fertilization effect). CO2also influences plant photosynthesis indirectly through its climate forcing effect. Its impact on climate through trapping longwave radiation (radiative climate change) can increase Earth’s mean surface temperature and thus influence plant photosynthesis. The response of plants to rising CO2can cause an increase in foliage cover and decreases leaf transpiration by reducing stomatal conductance per unit leaf area, which also impact climate system (vegetation-climate feedback) and thus influence plant photosynthesis indirectly.
eCO2-VCF, soΔPrecVCFandΔTsaVCFcan be derived based on corresponding variable differences between VCF + FERT and CTR (Table S2).
The equations governing leaf carbon and waterflux in the land model (CLM4.5CN) use the Ball-Berry stomatal conductance model [Ball et al., 1987; Collatz et al., 1991] and the Farquhar photosynthesis model [Farquhar et al., 1980]. The Ball-Berry model scales stomatal conductance (gs) with relative humidity (RH) and the ratio of assimilation (An) to atmospheric CO2concentration (Cs), such that gs= g0+ g1RHAn/Cs. The latitudinal pat-tern of annual mean evapotranspiration (ET) and GPP in the period of 1982–2011 in experiment “ALL” was compared to the data-driven product from Jung et al., 2011 and shows quite similar patterns (Figure S1 in the supporting information). A key metrics linking the water with carbonflux, is the intrinsic water use effi-ciency (iWUE) defined as An/gs, was diagnosed in the simulation ALL. The response of iWUE to rising CO2is positive and similar in magnitude to the one deduced from tree ring isotopes: for boreal forest the largest increase in iWUE (31%) and an increase in temperate and tropical forest iWUE of 26% and 19% per 100 ppm CO2, respectively (Figure S2), comparable with tree ring isotope-based estimates [Frank et al., 2015; van der Sleen et al., 2015].
To test the robustness of our results with respect to the choice of a specific earth system model, we also used the output of the Institut Pierre-Simon Laplace Coupled Model 5A Low Resolution (IPSL-CM5A-LR) earth system model from the Coupled Model Intercomparison Project Phase 5 (CMIP5) over 1850–2005 which performed the set of simulations needed to separate eCO2-RAD and eCO2-FERT + VCF on GPP. The eCO2-FERT contribution in IPSL-CM5A-LR was approximated by the results of Piao et al. [2013] using an off-line run of the same land carbon model. Model outputs from IPSL-CM5A-LR in CMIP5 are from the “historical,” “esmFixClim2,” and “esmFdbk2” experiments over 1850–2005 (Table S2) [see Taylor et al., 2012]. The experiment historical is forced with all conditions changed (consistent with observations). Experiment esmFixClim2 is forced with changing conditions, except that the radiation code uses prein-dustrial CO2 concentration. The experiment esmFdbk2 was forced with changing conditions except for the land component being prescribed with preindustrial CO2. In summary, the difference between histor-ical and esmFixClim2 attributes eCO2-RAD effects, and the difference between historical and esmFdbk2 attributes eCO2-FERT + VCF effects.
3. Results
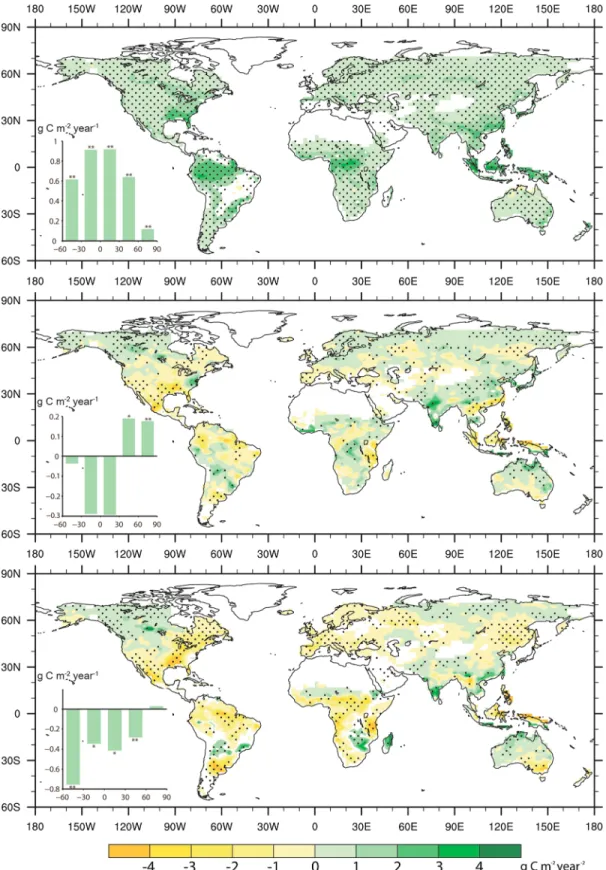
Thefirst 80 years of simulation results were disregarded as spin-up, and model outputs were analyzed from 1930 to 2011. First, spatially coherent positive trends of GPP are found from the fertilization effect (ΔGPPFERT), with tropical regions showing the largest positive response; these regions have little climate limitation of GPP and are weakly limited by nitrogen in our model (Figure 2a). Second, CO2radiative climate change causes regionally different GPP trends (ΔGPPRAD), namely, a positive effect in the northern latitudes and a negative one in tropical and subtropical regions (Figure 2b). In the southern hemisphere and the tropics (60°S to 30°N), ΔGPPRADshows nonsignificant negative trends, but temperate (30°N–60°N) and boreal areas (60°N–90°N) show significantly positive ΔGPPRAD(p< 0.01). Third, changes of GPP due to vegetation-climate feedback (ΔGPPVCF) are mainly negative, except in the northern high latitudes; the latitudinal band between 60°S and 30°S shows the largest negativeΔGPPVCFchanges (Figure 2c).
Figure 2. Global GPP (g C m 2) change in response to CO2fertilization (FERT-OCTR), radiative forcing (RAD-CTR), and vegetation-climate feedback (VCF-FERT-CTR).
GPP changes in response to climate change caused by (a) the fertilization effect of CO2, (b) the radiative effect of CO2, and (c) CO2-induced vegetation-climate
feedback over 1930–2011. Changes were analyzed with a linear regression model, and an F test was applied to test its significance. The dotted areas are regions where trends are statistically significant at the 90% level and all nonvegetated land areas are in grey. The insets in Figures 2a–2c show the mean GPP change (g C m 2, vertical axis) from 60°S to 90°N at a 30° interval. The double asterisk means significance of the trends at the 99% level; the single asterisk means significance of the trends at the 95% level; no sign means not significant.
offsets approximate half of the fertilization-induced increase of GPP (Figure 3a). Climate change from eCO2-VCF causes a larger global reduction of GPP ( 2.7 ± 1.8% over 1930–2011) than radiative climate change ( 0.9 ± 1.8% GPP change over 1930–2011). Given that the glo-balΔGPPFERTis 8.9 ± 0.6 Gg C (equiva-lent to 9.4 ± 0.64% per 100 ppm) over the period of 1930–2011, vegetation-climate feedback offsets 38% of the eCO2-FERT increase of GPP.
The effects of eCO2-RAD and eCO2 -VCF on growing-season climate can be compared to each other. Growing-season surface air tempera-ture differences due to radiative climate change (ΔTsaRAD, detailed information is shown in Table S2) show a total increase of 0.49 ± 0.15 K (p< 0.001) over 1930–2011, close to the observed global warming magnitude [Hansen et al., 2010]. Slightly more land areas show positive precipitation change due to radiative climate change (ΔPrecRAD) (Figure 4d), resulting in nonsignificant positive global mean ΔPrecRAD. Global mean growing-season surface air tem-perature change due to eCO2-VCF (ΔTsaVCF) is a small warming of 0.081 ± 0.081 K (p = 0.08). The spatial pat-tern ofΔTsaVCFshowed growing-season warming over most of America and northern Eurasia, and less areas experienced cooling than warming (Figure 4a). This result is consistent with the results from Shevliakova et al. [2013]. Further analysis shows that stomatal regulated transpiration reduction is a larger relative signal of 7.7 ± 1.5% (Figure S3). Global mean precipitation changes in growing season due to eCO2-VCF,ΔPrecVCF, is a net decrease of 21 ± 21 mm during 1930–2011 (p = 0.07) (Figure 3b). The spatial dis-tribution of the global trendΔPrecVCF suggests that more areas are subject to decreasing precipitation (Figure 4c), especially the significant negative trend of ΔPrecVCFin eastern North America, the Amazon basin, western Siberia, and northeast China, areas of high precipitation recycling through ET. When the global land areas are divided into humid and arid areas according to the soil water content threshold, arid areas where eCO2-VCF result in an increase of precipitation experience more cooling compared to humid areas (Figures 4 and S5).
Because of the key role of transpiration in controlling the water vapor in the atmosphere over continents [Trenberth et al., 2009] and its recycling to land precipitation [Van der Ent et al., 2010]. Time series of global annual meanΔET and ΔPrec changes by eCO2-RAD (Figure S4a) and eCO2-VCF (Figure S4b) were analyzed to explain the precipitation reduction. We found that there is a slight, nonsignificant increase in ET in
Figure 3. Global effect of CO2onΔGPP, ΔPrec, and ΔTsa trend over 1930–
2011. (a) Percentage of terrestrial GPP change in response to vegetation-climate feedback (VCF effect), CO2radiative climate change (RAD effect),
and fertilization effect (FERT effect). (b)Terrestrial meanΔPrec and ΔTsa in response to vegetation-climate feedback and CO2radiative climate
change. Error bars indicate the 95% confidence interval of ΔPrec and ΔTsa trend. The double asterisk means significance of the trends at the 99% level; the bullet means significance of the trends at the 90% level; no sign means not significant.
response to eCO2-RAD and a significantly larger decrease in ET from eCO2-VCF. Overall, in our coupled model, transpiration reduction due to eCO2-VCF (13 ± 1.4% over 1930–2011) from stomatal closure at leaf scale is much higher than the increase of transpiration due to higher foliage cover (5.4 ± 0.9% over 1930–2011) (Figure S3). The spatial distribution of ΔET in CO2-FERT experiment confirms the negative feedback of leaf area increase on the reduction in ET in arid area [Andrews et al., 2011] (Figure S5) and thus on the cooling from eCO2-VCF in water-limited area and warming in most other area (Figure 4a). Positive correlations are found betweenΔET and ΔPrec over land (R = 0.53 under radiative climate change, R = 0.61 under eCO2-VCF). This suggests that the decreasingΔPrecVCFis primarily caused by reduced ET.
Global land areas were divided into six biomes according to the dominant plant types used in the model to show the response of different biomes to rising atmospheric CO2. All biomes except tundra show significant negative GPP change under vegetation-climate feedback (Figure S6) because in our model, most terrestrial ecosystems have water-limited GPP and vegetation-climate feedback causes a drying trend. The largest negative change inΔGPPVCFoccurs in C3 grasslands. Significant positive ΔGPPradtrends are found in tundra and boreal biomes, whileΔGPPRADacross all other biomes shows a nonsignificant negative trend. This is very likely caused by continuous increase of extreme hot days in land [Seneviratne et al., 2014] and
drought-Figure 4. GlobalΔTsa (K yr 1) andΔPrec (mm yr 2) trend in response to elevated CO2between 1930 and 2011 in the CESM earth system model. Trend of global
(a and b)ΔTsa (K yr 2) and (c and d)ΔPrec (mm yr 2) between 1930 and 2011 in response to CO2vegetation-climate feedback (Figures 4a and 4c) and CO2
radiative climate change (Figures 4b and 4d) effects (inΔPrec blue represents positive trend and red represents negative trend; in ΔTsa just the reverse). The dotted areas are regions where trends are statistically significant at 10% level using F test. The insets in Figures 4a–4d show the fraction of the land grids with positive and negativeΔPrec, ΔTsa trends in global, humid, and arid environments. Global areas are divided into humid and arid types according to the annual mean soil water content, where the soil water content above the 30% percentile is rated as humid areas, otherwise arid areas.
1850–2005) [Piao et al., 2013]. Consequently, there is a 9.7 Pg C yr difference between the two results, which implies that approximately 29% of the eCO2-FERT increase of GPP was offset by the negative effect of eCO2-VCF in this coupled model. This result from the IPSL-CM5A-LR is comparable to the 38% reduction from eCO2-VCF in CESM1.2.2, but the carbon model version of IPSL-CM5A-LR was not exactly the same than the one used to attribute eCO2-FERT in the off-line experiment, which leads to more uncertainty in this result than for the set of CESM1.2.2-BGC experiments. The trend of climatic variables in IPSL-CM5-LR shows a similar pattern in CESM1.2.2-BGC, i.e., that eCO2-VCF resulted in more areas experiencing precipitation decrease and warming, leading to a significant global decline in ΔPrec and increase in ΔTsa, while radiative climate change causes both global meanΔTsa and ΔPrec to increase (Figures S10–S12 and Table S3). At the global scale, the correlation betweenΔGPP and ΔPrec in IPSL-CM5A-LR were weaker than in CESM-BGC (Figure S14), whereas positive correlation betweenΔGPP and ΔPrec and the negative correlation between ΔGPP and ΔTsa were consistent between the two models (Figures S8 and S14). These results from the IPSL-CM5A-LR thus confirm the negative impact of CO2climate forcing on terrestrial GPP, especially the significantly negative impact of vegetation-climate feedback on GPP.
4. Summary
Our results demonstrate that vegetation-climate feedback caused by rising CO2have significant contribu-tions to GPP trends. Although CO2 fertilization [Norby et al., 2005] and warming effects [Matthews et al., 2005; Xia et al., 2014] in driving global vegetation productivity have been previously addressed, our research further shows that warming due to CO2radiative climate change has no significant impact on the global GPP because of the spatially divergent responses of GPP to warming. In contrast, vegetation-climate feedback causes a significant reduction in global GPP mainly by reducing growing-season precipitation in 60°S–60°N latitude bands. On the other hand, a recent study suggested that semiarid ecosystems are important in reg-ulating the interannual variation of GPP and net ecosystem exchanges due to an enhanced response to pre-cipitation [Poulter et al., 2014]. Here our results imply that vegetation-climate feedback tends to bring more precipitation in dry areas through the positive precipitation-ET feedback by fertilization-caused increase in foliage cover [Andrews et al., 2011] while decrease precipitation in other areas. Given the important role of CO2in regulating terrestrial carbon cycling and the climate prediction uncertainties in response to increasing CO2[Good et al., 2015], more efforts are needed to reduce the uncertainty in climate-carbon feedback.
References
Andrews, T., M. Doutriaux-Boucher, O. Boucher, and P. M. Forster (2011), A regional and global analysis of carbon dioxide physiological forcing and its impact on climate, Clim. Dyn., 36, 783–792, doi:10.1007/s00382-010-0742-1.
Arora, V. K., et al. (2013), Carbon-concentration and carbon-climate feedbacks in CMIP5 earth system models, J. Clim., 26, 5289–5314, doi:10.1175/JCLI-D-12-00494.1.
Ball, J. T., I. E. Woodrow, and J. A. Berry (1987), A model predicting stomatal conductance and its contribution to the control of photosynthesis under different environmental conditions, Prog. Photosynth. Res., (953), 221–224, doi:10.1007/978-94-017-0519-6_48.
Beer, C., et al. (2010), Terrestrial gross carbon dioxide uptake: Global distribution and covariation with climate, Science, 329(5993), 834–8, doi:10.1126/science.1184984.
Boucher, O., A. Jones, and R. A. Betts (2009), Climate response to the physiological impact of carbon dioxide on plants in the Met Office Unified Model HadCM3, Clim. Dyn., 32, 237–249, doi:10.1007/s00382-008-0459-6.
Cao, L., G. Bala, K. Caldeira, R. Nemani, and G. Ban-Weiss (2010), Importance of carbon dioxide physiological forcing to future climate change, Proc. Natl. Acad. Sci., 107, 9513–9518, doi:10.1073/pnas.0913000107.
Acknowledgments
We thank Colin Prentice for the discus-sion and comments and the construc-tive reviews by Trevor Keenan. The model results of IPSL-CM5A-LR are downloaded from https://pcmdi.llnl. gov/projects/esgf-llnl/. This research is funded through projects to Q.Z. by NASA Land Use and Land Cover Change program (NASA-NNX09A126G) and NSF CDI Type II project (IIS-1028291). The model data underlying this research can be made available by contacting the corresponding authors.
Ciais, P., et al. (2011), Large inert carbon pool in the terrestrial biosphere during the Last Glacial Maximum, Nat. Geosci., 5, 74–79, doi:10.1038/ ngeo1324.
Collatz, G. J., J. T. Ball, C. Grivet, and J. A. Berry (1991), Physiological and environmental regulation of stomatal conductance, photosynthesis and transpiration: A model that includes a laminar boundary layer, Agric. For. Meteorol., 54(2–4), 107–136, doi:10.1016/0168-1923(91) 90002-8.
Cox, P. M., R. a. Betts, C. D. Jones, S. a. Spall, and I. J. Totterdell (2000), Acceleration of global warming due to carbon-cycle feedbacks in a coupled climate model, Nature, 408(6809), 184–187, doi:10.1038/35041539.
Donohue, R. J., M. L. Roderick, T. R. McVicar, and G. D. Farquhar (2013), Impact of CO2fertilization on maximum foliage cover across the
globe’s warm, arid environments, Geophys. Res. Lett., 40, 3031–3035, doi:10.1002/grl.50563.
Ehleringer, J. R., T. E. Cerling, and B. R. Helliker (1997), C-4 photosynthesis, atmospheric CO2and climate, Oecologia, 112(3), 285–299,
doi:10.1007/s004420050311.
Ehlers, I., A. Augusti, T. R. Betson, M. B. Nilsson, J. D. Marshall, and J. Schleucher (2015), Detecting long-term metabolic shifts using isotopomers: CO2-driven suppression of photorespiration in C3 plants over the 20th century, Proc. Natl. Acad. Sci., (16), 1–6, doi:10.1073/
pnas.1504493112.
Farquhar, G. D., S. von Caemmerer, and J. A. Berry (1980), A biochemical model of photosynthetic CO2assimilation in leaves of C3 species,
Planta, 149(1), 78–90, doi:10.1007/BF00386231.
Frank, D. C., et al. (2015), Water-use efficiency and transpiration across European forests during the Anthropocene, Nat. Clim. Chang., 5, 579–583, doi:10.1038/nclimate2614.
Friedlingstein, P., et al. (2006), Climate-carbon cycle feedback analysis: Results from the C4MIP model intercomparison, J. Climate, 19, 3337–3353, doi:10.1175/JCLI3800.1.
Good, P., et al. (2015), Nonlinear regional warming with increasing CO2concentrations, Nat. Clim. Chang., 5(January), 138–142, doi:10.1038/
nclimate2498.
Hansen, J., R. Ruedy, M. Sato, and K. Lo (2010), Global surface temperature change, Rev. Geophys., 48, RG4004, doi:10.1029/2010RG000345.1. Hickler, T., B. Smith, I. C. Prentice, K. Mjöfors, P. Miller, A. Arneth, and M. T. Sykes (2008), CO2fertilization in temperate FACE experiments not
representative of boreal and tropical forests, Glob. Chang. Biol., 14, 1531–1542, doi:10.1111/j.1365-2486.2008.01598.x.
Jung, M., et al. (2011), Global patterns of land-atmospherefluxes of carbon dioxide, latent heat, and sensible heat derived from eddy covariance, satellite, and meteorological observations, J. Geophys. Res., 116, doi:10.1029/2010JG001566.
Matthews, H. D., A. J. Weaver, and K. J. Meissner (2005), Terrestrial carbon cycle dynamics under recent and future climate change, J. Clim., 18, 1609–1628, doi:10.1175/JCLI3359.1.
Matthews, H. D., M. Eby, T. Ewen, P. Friedlingstein, and B. J. Hawkins (2007), What determines the magnitude of carbon cycle-climate feedbacks?, Global Biogeochem. Cycles, 21, GB2012, doi:10.1029/2006GB002733.
Medlyn, B. E., et al. (2015), Using ecosystem experiments to improve vegetation models, Nat. Clim. Chang., 5, 528–534, doi:10.1038/ nclimate2621.
Melaas, E. K., A. D. Richardson, M. A. Friedl, D. Dragoni, C. M. Gough, M. Herbst, L. Montagnani, and E. Moors (2013), Using FLUXNET data to improve models of springtime vegetation activity onset in forest ecosystems, Agric. For. Meteorol., 171–172, 46–56, doi:10.1016/ j.agrformet.2012.11.018.
Norby, R. J., et al. (2005), Forest response to elevated CO2is conserved across a broad range of productivity, Proc. Natl. Acad. Sci., 102,
18,052–18,056, doi:10.1073/pnas.0509478102.
Novick, K. A., et al. (2016), The increasing importance of atmospheric demand for ecosystem water and carbonfluxes, Nat. Clim. Chang., 6, 1023–1027, doi:10.1038/nclimate3114.
Piao, S., et al. (2013), Evaluation of terrestrial carbon cycle models for their response to climate variability and to CO2trends, Glob. Chang.
Biol., 19, 2117–2132, doi:10.1111/gcb.12187.
Poulter, B., et al. (2014), Contribution of semi-arid ecosystems to interannual variability of the global carbon cycle, Nature, 509, 600–603, doi:10.1038/nature13376.
Seneviratne, S. I., M. G. Donat, B. Mueller, and L. V. Alexander (2014), No pause in the increase of hot temperature extremes, Nat. Clim. Chang., 4, 161–163, doi:10.1038/nclimate2145.
Shevliakova, E., et al. (2013), Historical warming reduced due to enhanced land carbon uptake, Proc. Natl. Acad. Sci., 110, 16,730–16,735, doi:10.1073/pnas.1314047110.
Smith, S. D., et al. (2000), Elevated CO2increases productivity and invasive species success in an arid ecosystem, Nature, 408(6808), 79–82,
doi:10.1038/35040544.
Taylor, K. E., R. J. Stouffer, and G. A. Meehl (2012), An overview of CMIP5 and the experiment design, Bull. Am. Meteorol. Soc., 93, 485–498, doi:10.1175/BAMS-D-11-00094.1.
Trenberth, K. E., J. T. Fasullo, and J. Kiehl (2009), Earth’s global energy budget, Bull. Am. Meteorol. Soc., 90, 311–323, doi:10.1175/ 2008BAMS2634.1.
Ukkola, A. M., I. C. Prentice, T. F. Keenan, A. I. J. M. van Dijk, N. R. Viney, R. B. Myneni, and J. Bi (2015), Reduced streamflow in water-stressed climates consistent with CO2effects on vegetation, Nat. Clim. Chang., 6, 75–78, doi:10.1038/nclimate2831.
Van der Ent, R. J., H. H. Savenije, B. Schaefli, and S. C. Steele-Dunne (2010), Origin and fate of atmospheric moisture over continents, Water Resour. Res., 46, W09525, doi:10.1029/2010WR009127.
van der Sleen, P., P. Groenendijk, M. Vlam, N. P. R. Anten, A. Boom, F. Bongers, T. L. Pons, G. Terburg, and P. A. Zuidema (2015), No growth stimulation of tropical trees by 150 years of CO2fertilization but water-use efficiency increased, Nat. Geosci., 8(January), 24–28,
doi:10.1038/ngeo2313.
Xia, J., J. Chen, S. Piao, P. Ciais, Y. Luo, and S. Wan (2014), Terrestrial carbon cycle affected by non-uniform climate warming, Nat. Geosci., 7, 173–180, doi:10.1038/ngeo2093.
Zhao, M. S., F. A. Heinsch, R. R. Nemani, and S. W. Running (2005), Improvements of the MODIS terrestrial gross and net primary production global data set, Remote Sens. Environ., 95, 164–176, doi:10.1016/j.rse.2004.12.011.