HAL Id: hal-02270864
https://hal.archives-ouvertes.fr/hal-02270864
Submitted on 26 Aug 2019
HAL is a multi-disciplinary open access
archive for the deposit and dissemination of
sci-entific research documents, whether they are
pub-lished or not. The documents may come from
teaching and research institutions in France or
abroad, or from public or private research centers.
L’archive ouverte pluridisciplinaire HAL, est
destinée au dépôt et à la diffusion de documents
scientifiques de niveau recherche, publiés ou non,
émanant des établissements d’enseignement et de
recherche français ou étrangers, des laboratoires
publics ou privés.
and Mantle Necking
Pauline Chenin, Gianreto Manatschal, Alessandro Decarlis, Stefan
Schmalholz, Thibault Duretz, Marco Beltrando
To cite this version:
Pauline Chenin, Gianreto Manatschal, Alessandro Decarlis, Stefan Schmalholz, Thibault Duretz, et al..
Emersion of Distal Domains in Advanced Stages of Continental Rifting Explained by Asynchronous
Crust and Mantle Necking. Geochemistry, Geophysics, Geosystems, AGU and the Geochemical
Soci-ety, 2019, 20 (8), pp.3821-3840. �10.1029/2019GC008357�. �hal-02270864�
Continental Rifting Explained by Asynchronous
Crust and Mantle Necking
Pauline Chenin1 , Gianreto Manatschal1 , Alessandro Decarlis1, Stefan M. Schmalholz2,
Thibault Duretz3 , and Marco Beltrando4
1CNRS UMR7516, Institut de Physique du Globe de Strasbourg, Université de Strasbourg, Strasbourg, France,2Institut des Sciences de la Terre, Université de Lausanne, Lausanne, Switzerland,3CNRS UMR 6118, Geosciences-Rennes, Université de Rennes, Rennes, France,4Marco Beltrando passed away in December 2015,
Abstract
We propose an explanation to the enigmatic synrift erosional unconformities reported along the distal domain of several magma-poor rifted margins. Using thermomechanical numerical modeling, we show that transient emersion of (future) distal domains following a phase of subsidence can be explained by asynchronous necking of first the upper mantle and subsequently the crust, without the need of prominent normal faulting caused by strain softening, mantle phase transitions, or magmatic processes. When the upper crust and upper mantle are mechanically decoupled by a weak lower crust and, in the absence of any prominent rheological heterogeneity, upper mantle, necking starts first because of the higher deviatoric stresses associated with its larger effective viscosity. Consequently, the ductile lower crustal material flows toward the necked mantle domain, delaying thinning of the overlying crust. Once the necked lithospheric mantle has locally lost most of its strength, the overdeepened Moho moves upward toward an isostatically compensated depth. This flexural rebound causes uplift and emersion of distal parts of the rift system that are composed of still relatively thick crust and triggers the necking of the overlying crust. Early necking of the upper mantle causes a transient heating event with temperatures up to 750◦C at the base of the crust in the (future) distal domain. The onset of this thermal event slightly predates emersion of the (future) distal domain. These results are consistent with field observations andthermochronological data from the fossil Alpine Tethys margins, as well as with seismic observations from several present-day rifted margins.
1. Introduction
In the last decade, there has been growing evidence that distal parts of different magma-poor rift systems underwent a transient uplift to shallow water depth, and in some cases even emersion during advanced stages of continental extension (see Table 1 in Esedo et al., 2012). Examples include the Briançonnais domain in the fossil Alpine Tethys rift system (e.g., Bourbon, 1980; Faure & Megard-Galli, 1988), the outer hinge of the Campos Basin (Brazilian margin; Lewis et al., 2014), and, according to Haupert et al. (2016), the second terrace of the East India margin. In these three examples, synrift deposits in the distal domain are trun-cated by erosional unconformities and covered by hemipelagic to pelagic sediments and/or sag to postrift stratigraphic units. This succession indicates the occurrence of a phase of uplift and emersion that was both preceded and followed by a phase of subsidence and sedimentation. The fact that a comparable unconfor-mity is lacking over the proximal domain (sensu Péron-Pinvidic & Manatschal, 2009) suggests that emersion was limited to the (future) distal part of the rift system.
The mechanisms responsible for this regional subsidence-emersion-subsidence succession are not yet iden-tified. This evolution deviates from the continuous subsidence along the entire rift system predicted by the depth-uniform thinning model of McKenzie (1978). Dynamic topography cannot account for the regional uplift of the distal domain because it implies large-scale domal uplift (500- to 1,000-m amplitude over a region of ∼ 600 km in diameter according to Campbell, 2005) that would necessarily involve the proxi-mal margins as well (Burgess et al., 1997). The simple shear model from Wernicke (1985) that Lemoine et al. (1987) invoked to explain the local uplift of the Briançonnais domain is not an appropriate process either because it does not account for the initially distributed and decoupled deformation recorded in most proximal margins (e.g., Ball et al., 2013; Beltrando et al., 2015; Withjack et al., 2012).
Key Points:
• Flexural rebound following early upper mantle necking can cause emersion of distal parts of rift systems
• Emersion of distal parts of rift systems is coeval with or postdates a regional thermal pulse at the base of the crust Correspondence to: P. Chenin, [email protected] Citation: Chenin, P., Manatschal, G., Decarlis, A., Schmalholz, S. M., Duretz, T., & Beltrando, M. (2019). Emersion of distal domains in advanced stages of continental rifting explained by asynchronous crust and mantle necking. Geochemistry,
Geophysics, Geosystems, 20. https:// doi.org/10.1029/2019GC008357
Received 28 MAR 2019 Accepted 26 JUL 2019
Accepted article online 4 AUG 2019
©2019. American Geophysical Union. All Rights Reserved.
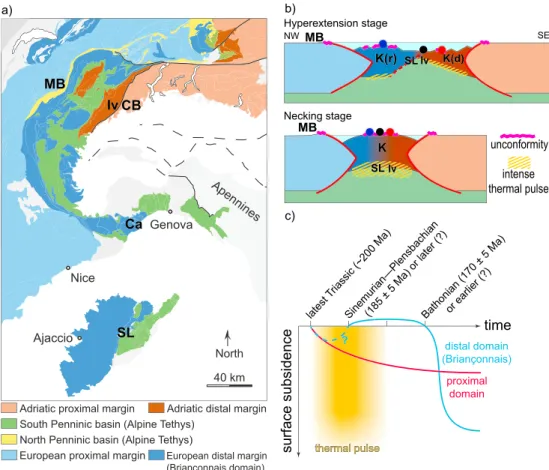
Figure 1. (a) Simplified tectonic map of the European Alps (Corsica is drawn into its pre-Oligocene position following
Bache et al., 2010). (b) Schematic sections showing the position of the Briançonnais domain and future distal Adriatic margin during early stages of Alpine Tethys rifting (modified from Haupert et al., 2016). The round markers represent specific locations whose basal temperature is tracked in the numerical model. Abbreviations: Ca = Calizzano unit; CB = Cusio-Biellese zone; MB = Mont Blanc; Iv = Ivrea zone; SL = Santa Lucia nappe; K = crustal keystone; K(r) and K(d) represent the “residual” and “disintegrated” parts of the crustal keystone, respectively. (c) Schematic view of the topographic evolution of the proximal (red) and Briançonnais (blue) domains of the Alpine Tethys rift system. The yellow shaded area represents the thermal pulse at the base of the distal domain (see text for discussion).
Several thermomechanical numerical models show uplift above sea level during early stages of extension (e.g., Type I margin in Huismans & Beaumont, 2011; models from Svartman Dias et al., 2015; Brune et al., 2014; Gueydan et al., 2008). These models apply significant strain softening, which generates large-offset brittle/plastic normal faults. Such faults are at the origin of the prominent flexure of the upper crust and related topographic uplift. However, this uplift is typically limited to the proximal part of the rift system and is not preceded by subsidence. Huismans and Beaumont (2014) and Svartman Dias et al. (2015) demon-strated that synrift uplift of the distal domain subsequent to a phase of subsidence may be enabled by depth-dependent thinning (see their Figures 7 and 5, respectively); however, none of these models shows emersion of the (future) distal domain above sea level. Additional processes such as mantle phase transitions (Kaus et al., 2005; Simon & Podladchikov, 2008) or magmatism (Quirk & Rüpke, 2018) have been consid-ered in numerical models to account for late-rift uplift of distal domains, but these models did not predict emersion either.
Our present study aims to describe and unravel what controls the particular subsidence-emersion-subsidence succession that affects the distal domain of several rift systems. Although some present-day rifted margins are well imaged with seismic sections, they offer poor access to rock samples and core stratigra-phy. In contrast, the fossil Alpine Tethys margins, now exposed in the European Alps, are remarkably well preserved (e.g., Lemoine et al., 1986, cum ref.) and provide access to entire crustal sections along differ-ent parts of the rift system. Thanks to more than one cdiffer-entury of study and related extensive literature (e.g., De Graciansky et al., 2011; Pfiffner, 2014, cum ref.), the fossil Alpine Tethys is among the best calibrated rift
systems in the world. Therefore, to build our description and investigations, we rely on observations and data from the Briançonnais and Lower Austroalpine domains of the European Alps, which were recognized as the former distal domain of the European and Adriatic margins of the Alpine Tethys, respectively (see Figures 1a and 1b; e.g., Decarlis et al., 2017; Trümpy, 1975). We further present the results of a high-resolution, two-dimensional thermomechanical numerical model of continental rifting that shows transient uplift and emersion of distal parts of a rift system after an initial phase of subsidence. Our model employs a stan-dard lithosphere architecture and stanstan-dard rheological flow laws and does not apply parametrization for mimicking large-offset brittle normal faulting, phase transitions, or magmatism.
2. The Briançonnais Domain Evolution
The Briançonnais unit (Figure 1a) was initially recognized as a specific geological domain by Lory (1860, 1866) and Kilian (1891) based on its characteristic stratigraphic succession, which comprises generally (i) Triassic platform carbonate deposits; (ii) a Jurassic unconformity marked by the missing Lias and early Dogger; and (iii) late Dogger and Malm flooding sequences up to pelagic deposits. Later, Haug (1909), Debelmas (1955), and Lemoine (1961) identified the Briançonnais domain as the former distal part of the European margin in the Alpine Tethys rift system.
Restorations of the Briançonnais nappes suggest that the Briançonnais domain was several tens of kilome-ters wide (∼ 50–60 km in Briançon; see Bell & Butler, 2017; Butler, 2013; Decarlis et al., 2013, cum ref.). However, the width of this domain varies along strike, and estimates are highly dependent on the assump-tions made on the direction of Alpine compression. A rough estimate of a few tens of kilometers for the extent of the erosional unconformity can be given based on present-day mapping of the corresponding for-mations (≥ 20 km in Briançon; see extent of the Champcella formation in Barféty et al., 1996). However, this estimation suffers from the same uncertainties as the previous one.
Recently, Lavier and Manatschal (2006) and Haupert et al. (2016) interpreted the Briançonnais and lower Austroalpine domains to have formed the so-called H block or crustal keystone (see Crosby & Crosby, 1925, and Huismans & Beaumont, 2011, for keystone definition) of the Alpine Tethys rift during early to inter-mediate stages of extension (bottom panel of Figure 1b). In this interpretation, the Briançonnais domain comprises remnants of the topmost part of the crustal keystone (dark blue in Figure 1; see also Mohn et al., 2010, cum ref.) and remnants of the lower part (dark brown in Figure 1) are exposed in the Lower Aus-troalpine units (e.g., Dal Piaz, 1993; Froitzheim & Manatschal, 1996; Hermann & Müntener, 1996; Müntener & Hermann, 1996).
2.1. Jurassic Emersion and Drowning
A wealth of studies of the paleo-European margin documented the existence of a regional synrift strati-graphic gap in the Briançonnais domain, which contrasts with the continuous sedimentary record of the adjacent subsiding areas (Baud, 1976; Baud & Masson, 1975; Claudel & Dumont, 1999; Decarlis & Lualdi, 2008; Schneegans, 1933). Emersion of the Briançonnais platform is indicated by a regional unconformity and karstification of preexisting shelf carbonates along the entire Alpine arc (De Graciansky et al., 2011, cum ref.). The onset of emersion occurred at the earliest during the Sinemurian, which is the age of the youngest carbonates affected by the karst (Tricart et al., 1988). Faure and Megard-Galli (1988) and Claudel and Dumont (1999) suggested that uplift was presumably post-Sinemurian (185 ± 5 Ma); however, no direct dating of this event is available.
Drowning of the Briançonnais domain started at the latest during the late Bathonian (∼ 165 Ma) since shal-low marine carbonates of this age locally overlie the karst (Claudel & Dumont, 1999; Mercier, 1977). Due to the existence of widespread pelagic limestones of Callovian age (∼164–161 Ma) draping the entire Briançon-nais domain, fast drowning to great water depth was commonly assumed (e.g., Claudel & Dumont, 1999; De Graciansky et al., 2011, cum ref.). Recently, Haupert et al. (2016) suggested that drowning may have started earlier but was not recorded onto the Briançonnais because passive infill was restricted to the lows on either side of this block of thick continental crust. The pelagic nature of the sediments capping the Briançonnais domain does not necessarily indicate a fast subsidence and/or a deep water depth since pelagic sediments can be deposited at relatively shallow water depth (below wave base) onto isolated highs disconnected from sedimentary sources.
The regionality of the Jurassic karst and the consistent nature and age of the overlying sediments suggest that both emersion and drowning were, from a geological timescale perspective, largely synchronous over the entire Briançonnais domain.
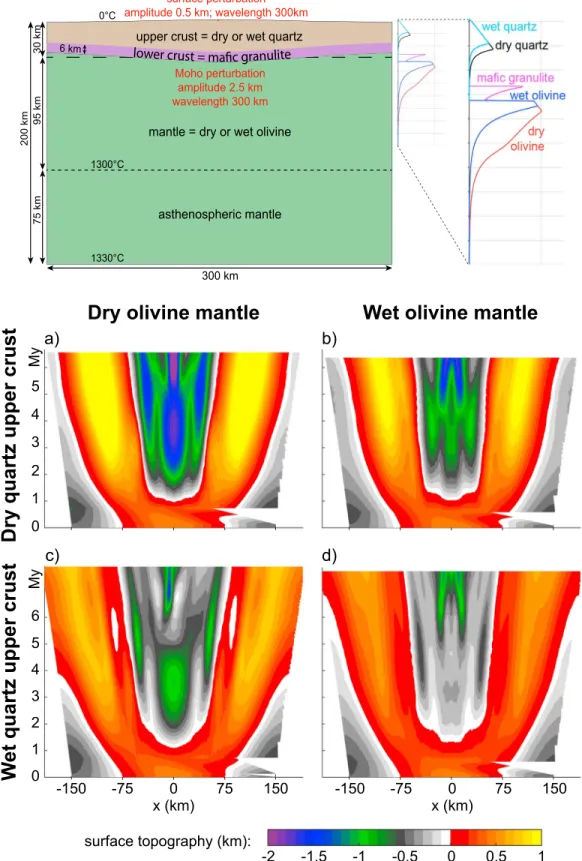
Figure 2. Model configuration and depth-dependent stress profile (blue) and initial equilibrium geotherm (red) at
different positions along the model.
2.2. Latest Triassic–Early Jurassic Thermal Event
Recent thermochronological data from the European Alps point to the existence of a crustal-scale heating-cooling event in the distal part of the Alpine Tethys rift during the late Triassic–early Jurassic (see Figure 8 in Beltrando et al., 2015). For instance, based on zircon fission track thermochronology, Vance (1999) suggested a heating event at 179–124 Ma in the Calizzano unit (southwestern Italian Alps, former distal European margin; Ca in Figure 1). More recently, also using zircon fission track thermochronology, Decarlis, Fellin, et al. (2017) argued that the heating event occurred before 160–150 Ma. At this time, the Calizzano unit was resting at upper crustal levels. Using U-Pb thermochronology, Smye and Stockli (2014) noticed a thermal pulse with temperatures in excess of 650◦C during the early Jurassic in the Ivrea zone (northwestern Italy, former distal Adriatic margin; Iv in Figure 1). This heating event was followed by rapid cooling from ∼ 180 Ma onward. At this time, the Ivrea zone was located in a lower crustal position. Using ZHe thermochronology, Beltrando et al. (2015) reported an intense heating event at 215–210 Ma in the Cusio-Biellese zone (at the proximal-distal transition of the Adriatic margin; CB in Figure 1). At this time, the Cusio-Biellese zone was located at lower crustal levels. Here again, the heating event was followed by rapid cooling from 200–190 Ma onward. Based on U-Pb thermochronology, Seymour et al. (2016) high-lighted a brief thermal event with temperatures as high as 800◦C at ∼ 200–180 Ma in the Santa Lucia nappe complex (Alpine Corsica, former European distal domain; SL in Figure 1). The heating event was also fol-lowed by rapid cooling from 180–160 Ma. At this time, the Santa Lucia nappe complex was resting at lower crustal levels.
2.3. Timing With Respect to Major Crustal Thinning
Comparison between the age of emersion (maximum range 189–165 Ma) and heating event (∼ 200–179 Ma) in the Briançonnais domain highlights that the thermal pulse slightly predated and/or was coeval with the phase of emersion. Both events largely coincide with the major late Triassic-early Jurassic crustal thinning in the Alpine Tethys, which will be referred to as the “necking phase” in the following. The age of the necking phase was estimated based on different approaches: On the one hand, using Ar/Ar geochronology, Mohn et al. (2012) showed that exhumation of lower- to middle-crustal rocks to temperatures< 300◦C occurred at ∼ 189–179 Ma along the Eita shear zone, which is located at the proximal-distal transition of the future Adriatic margin. On the other hand, based on sedimentological correlations across the Adriatic margin, Ribes et al. (2019) proposed that the necking phase lasted from ∼ 191 (latest Sinemurian–early Pliensbachien abandonment of the proximal basins) to ∼ 185 Ma (slightly before the early Toarcian anoxic event dated at 183 Ma).
In summary, two remarkable features characterize the evolution of the Briançonnais domain during the necking phase of the Alpine Tethys rifting: (1) a transient uplift and emersion above sea level after a phase of initial subsidence; and (2) a concurrent and/or slightly earlier intense thermal pulse at the base of the crust. In the following we use thermomechanical numerical modeling to determine whether there is a causal relationship between the observed uplift/emersion and heat pulse and to unravel what processes control the particular evolution of the Briançonnais domain.
Table 1
Materials Physical Properties
Dry quartz continental crust Dry olivine mantle
Density𝜌(kg/m3) 2,800 3,330
Internal angle of friction𝜙(◦) 30 30
Cohesion Co (MPa) 10 10
Heat capacity Cp (J·kg−1·K−1) 1,050 1,050
Thermal conductivity k (W·M−1·K−1) 2.5 3.0
Heat production H (μW/m3) 1.0 0.0
Thermal expansion𝛼(◦C−1) 32.0e−6 32.0e−6
Pressure compressibility𝛽(Pa−1) 1.5e−11 1.5e−11 Dislocation creep parameters
Stress exponent n 2.4 3.5
Activation energy Q (kJ/mol) 156 530
Pre-exponential constant A (Pa−n·s−1) 2.667e−20 1.1e−16
Activation volume V*(m3/mol) 0 11.0e−6
Water fugacity f 0 0
Diffusion creep parameters
Stress exponent n / 1
Grain size exponent m / 3
Activation energy Q (kJ/mol1) / 375
Pre-exponential constant A (Pa−n·s−1) / 1.5e−15
Activation volume V*(m3/mol) / 4.0e−6
Peierls creep parameters
Stress dependence q / 2.0
An adjustable constant𝛾 / 0.1
Peierls stress𝜎p(Pa) / 8.5e9
Activation energy Q (kJ/mol) / 540
Pre-exponential constant Ap(s−1) / 5.7e11
3. Numerical Model Formulation
We use a two-dimensional finite difference/marker-in-cell thermomechanical code to model lithospheric extension (see Appendix A for more detailed descriptions of the numerical algorithm). The model considers viscoelastoplastic incompressible deformation; strain-rate-, stress-, and temperature-dependent rheologies; and thermomechanical coupling by shear heating.
The modeled domain (Figure 2) is 300 km wide and 200 km deep with a numerical resolution of 500 m horizontally and 250 m vertically. Models run with similar settings at 500 × 500 m, 1 km × 500 m, and 1 × 1 km resolution produced comparable results (section B1). The top boundary is a free surface (Duretz et al., 2016), while free slip is applied on the left, right, and bottom boundaries. Horizontal velocities (v) that depend on the model width (W ) are applied on the vertical model sides to generate a constant extension bulk strain rate (𝜀) of 10. −15s−1(𝜀 = 2v∕W), which corresponds to an extension velocity of the order of 1 cm/year..
The modeled domain comprises a 30-km-thick dry quartz continental crust with a dislocation creep flow law (Ranalli, 1997) overlying a 170-km-thick dry olivine mantle with dislocation, diffusion, and Peierls creep flow laws (Hirth & Kohlstedt, 2003, and Evans & Goetze, 1979, using the approach from Kameyama et al., 1999; see Table 1 for a summary of materials physical parameters). In order to test whether fundamental ther-momechanical necking processes can explain the characteristic emersion and thermal pulse observed in the Briançonnais domain, the model presented here does not consider strain softening, erosion, sedimentation, nor melt impregnation and comprises a monophase continental crust. Results of simulations with alterna-tive crustal rheologies, including a two-phase crust, are provided in sections B2 and B3. We emphasize that we use the term necking to refer to the mechanical thinning process associated with a necking instability,
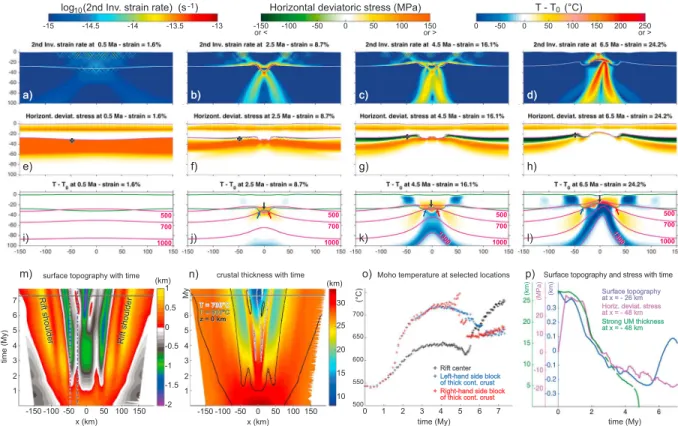
Figure 3. (a–d) Log10of the second invariant of strain rate tensor; (e–h) horizontal deviatoric stress (the cross marks the location of the point at x= −48 km,
3 km below the Moho displayed as a magenta line in panel p; and (i–l) temperature difference between the initial and current stage across the model domain. (m) Evolution of the surface topography with time along the model; the black line marks the time at which the crust is thinned to 10 km; the blue and magenta dashed lines show the location of the points tracked in panel p at x= −26 and−48 km, respectively. (n) Evolution of crustal thickness with time along the model; the 0-m isobath and the 700 and 800◦C isotherms are superimposed. (o) Moho temperature with time at the model center and at the base of the two blocks of thick continental crust; see the arrows in panels j–l for location of the tracked points. (p) Blue curve: surface topography with time at x= −26 km (see blue dashed line in panel m); magenta curve: horizontal deviatoric stress 3 km below the Moho at x= −48 km (see magenta cross in panels e–h and magenta dashed line in panel m); green curve: thickness of layer in which horizontal deviatoric stress is>100 MPa (i.e., the “strong” upper mantle) at x= −48 km (see magenta dashed line in panel m).
which generates structures such as pinch-and-swell or boudinage in plastic and/or non-Newtonian materi-als that are here the crust and the mantle lithosphere (Fletcher & Hallet, 1983; Smith, 1977). Necking (a mechanical process) and thinning (a kinematic process) are not synonymous, but necking is one possible process responsible for thinning on the same level as pure shear. In the framework of rifting, necking is the first step of the progressive localization of deformation that will eventually lead to lithospheric breakup. In the following, we distinguish between the necking zone, which corresponds to the model region that is affected by localized thinning, and the proximal domain that is located outside the necking zone.
To trigger localization of deformation, we perturb the initial depth of the crust-mantle boundary with a sinusoidal function having a 2.5-km amplitude and a 300-km wavelength smoothly distributed over the entire model width (Figure 2). We counterbalance the Moho perturbation by a sinusoidal surface topography of ∼ 0.5-km amplitude and 300-km wavelength so that our model is initially in isostatic equilibrium. The progressive thickening, and thus weakening, of the crust toward the model center (Figure 3) enables the model to go through a progressive necking process when the crust is extended, similar to the analytical model described by Fletcher and Hallet (1983). The use of a sinusoidal perturbation of the Moho is reasonable because (i) Moho depth perturbations are ubiquitous as a result of tectonics (e.g., beneath mountain ranges and rift basins), including perturbations of more than 100-km wavelength (e.g., Braitenberg et al., 1997; Karabulut et al., 2013); and (ii) the wavelength of the Moho perturbation has no significant impact on the rift evolution and final architecture of the rift system in dynamical numerical models (Chenin et al., 2018). The temperature is set to 0 ◦C at the top of the model and 1330◦C at the base, and zero heat flux is imposed on the model vertical sides. In order to mimic an adiabatic asthenosphere, we set the initial ther-mal conductivity of the mantle located between 125 and 200 km to 1,000 times its reference value (i.e.,
3,000 W·m−1·K−1). During the simulation, the conductivity is set back to 3 W·m−1·K−1. This setup results
in a (slow) diffusive cooling of the lithosphere-asthenosphere boundary which has, however, no significant impact given the short duration of the simulation (∼ 7 Myr). The crust has a constant radiogenic heat pro-duction of 1 μW/m3. The initial Moho temperature in the central region is 550◦C, consistent with the Moho
temperatures recorded at the onset of the Alpine Tethys rifting in Val Malenco (northern Italy; Müntener et al., 2000).
Because we are interested only in the necking phase, we terminate the simulation when the crust is thinned to 10 km, before mantle exhumation or breakup. In the following, all depth and height values are given with respect to the 0-km isobath reference level. We use the term “emersion” when surface topography that was below the reference level is subsequently uplifted above this level.
4. Results
During the early stages of extension, deformation is widely distributed within both the crust and the man-tle, and no significant changes occur in the model temperature, surface topography, and crustal thickness (Figures 3a, 3i, 3m, and 3n). After 2.5 Myr of extension crustal deformation is localized into two wide fault corridors in the upper crust, which continue as ductile shear zones in the lower crust. They delimit a largely undeformed ∼ 40-km-wide crustal keystone in the model center (Figure 3b). Within the upper mantle, defor-mation is focused into two intensively deforming shear zones that merge at a depth of ∼ 40 km in the model center (Figure 3b). At this stage, a boudin of upper mantle has formed in the model center: The initially ∼25-km-thick brittle-plastic upper mantle characterized by high deviatoric stresses (deepest orange layer in Figure 3e) is thinned to less than 5 km on either side of the boudin (Figure 3f). This stress state indicates the necking of this strong, load-bearing, uppermost mantle layer (Figure 3f). In the uppermost part of the man-tle outside of the necking zone, we notice a significant drop in the horizontal deviatoric stresses and even slightly compressional stresses (Figure 3f and magenta curve in Figure 3p). Deviatoric stresses in the upper mantle become more and more compressive (Figure 3g), which indicates an upward flexure of the upper mantle on either side of the mantle boudin/necking zone. The vertical variation from compressive to exten-sive stresses across the lithosphere is a typical feature of flexure or bending (e.g., Figure 3.11 in Turcotte & Schubert, 2014; see also Figure 3 in Braun & Beaumont, 1989).
The early necking of the upper mantle is associated with (1) a significant temperature increase at the base of the crust above the mantle necking domain, which reaches up to 700–750◦C (Figures 3j and 3o); and (2) a significant Moho relief in the model center (∼ 9 km between the lowest and highest Moho points; see Figure 3f). The Moho is pulled downward in the region of necking because the largest deviatoric stresses, which concentrate in the strongest layer (Figure 2), occur below the Moho (Figure 3f). The strongest level corresponds to the so-called intrinsic necking depth (Braun & Beaumont, 1989; Kooi et al., 1992), which tends to remain horizontal during the initial stages of necking. Perturbation of the Moho relief related to upper mantle necking does not significantly affect the upper crust, as shown by the lack of deflection of the mid-crustal brittle-ductile transition (topmost orange layer on Figure 3f) and the limited subsidence (< 800 m) along the model (Figure 3m). Indeed, Moho deflection is largely compensated by lower crustal flow, as shown by the thick crust (∼ 30 km) that remains until 4–5 Myr in the model center (Figure 3n). Necking of the upper mantle is thus asynchronous with respect to the later necking of the overlying crust. As extension continues, deformation localizes at the right-hand side edge of the upper mantle boudin (Figure 3c). As a result, the latter becomes progressively offset to the left of the rift center (compare Figures 3g and 3h). Within the crust, a new fault corridor, which will become the locus of crustal necking, appears in the center of the keystone (Figures 3c and 3d). As a result, the latter is split into two blocks of relatively thick crust (∼ 25 km), which become increasingly offset on either side of the main rift as extension progresses (Figure 3n). These blocks of thick crust tend to remain at shallow depth (< 500 m below the reference level) during the entire simulation (Figure 3m). After 4.5 Myr of extension, the intensity of upper mantle flexure outside the necking zone has largely increased, with significant compressional horizontal deviatoric stresses (lower than −65 MPa) in the topmost 6 km of the mantle (at x < −25 and x > 25 km in Figure 3g). High extensional deviatoric stresses (> 150 MPa) still affect the lower part of the upper mantle along the entire model, but the thickness of this high-stress layer is extremely reduced (less than 1 km) on each side of the mantle boudin (Figure 3g). At this stage, the 1300◦C isotherm reaches a depth of 75 km in the model center (Figure 3k; initial depth was 125 km).
From approximately 4.5 Myr onward, the ∼ 25-km thick crust in the model center begins to thin at a rel-atively high rate, reaching 10 km after 7.3 Myr of extension (Figure 3n). This marks the onset of crustal
necking. Crustal necking is achieved via conjugate shear zones that are offset to the left by ∼ 15 km from the active mantle shear zones (Figure 3d). The onset of significant crustal thinning at the model center coincides with the moment when the strong upper mantle has been first fully attenuated (at x = −48 km; see green curve in Figure 3p). In contrast, high compressional and extensional deviatoric stresses are still occurring in the upper and lower parts of the upper mantle outside the main rift zone, respectively (Figure 3h). This indicates that the upper mantle is still undergoing upward flexure. From approximately 5 Myr onward, the Moho temperature at the model center starts increasing rapidly, while the base of the two blocks of thick continental crust on either side cools down to 650–675◦C (Figure 3o). Simultaneously, surface topography starts rising on either side of the rift center, culminating with emersion of parts of the future distal margin at ∼ 6 Myr (Figure 3m and blue curve in Figure 3p). Note that the location of emersion on the left-hand side of the main rift is consistent with the location of the left-hand side block of thick continental crust but is not a region of highest temperature (Figure 3n). Conversely, the right-hand side region of emersion is con-sistent with the region of highest temperature but not with that of the thickest crust (Figure 3n). These local uplifts do not correspond to the rift shoulders, since the latter are located ∼ 100 km laterally away from the rift center and reach an altitude of more than 1 km (Figure 3m).
By the end of the simulation at 7.3 Myr, when the crust has been thinned to 10 km in the model center, the 1300◦C isotherm is at a depth of 40 km (Figure 3l). At this time, the basin floor is at a depth of ∼ 2 km in the model center. The surface of the left-hand side block of thick (25–27 km) continental crust is still emerged, while the other has subsided to a depth of 100 m below the reference level.
5. Discussion
The model presented in this study displays the two key features characterizing the Briançonnais evo-lution described in section 2. Based on the combined analysis of our model results, field observations, thermochronological data from the fossil Alpine Tethys margins, and interpreted seismic data from the literature, we propose a conceptual model that illustrates the consecutive phases of what we name a
Briançonnais-type behavior(Figure 4).
During the early stages of extension, our numerical model shows a phase of widely distributed deformation (Figure 3a), similar to other models devoid of a single prominent weak seed (e.g., the model with “white sta-tistical noise” of Huismans & Beaumont, 2007; Jammes & Lavier, 2016; Lavier & Manatschal, 2006; Naliboff et al., 2017). This phase of distributed deformation is well recognized in the Alps (e.g., Beltrando et al., 2015; Eberli, 1988; Lemoine, 1985) and is a ubiquitous behavior of early rifting stages worldwide (e.g., Ball et al., 2013; Withjack et al., 2012). This phase of distributed extension is illustrated in Figure 4a. During this stage, no significant temperature, stress, or topographic change occurs along the rift system (Figures 4d–4f). As extension progresses, necking of the upper mantle starts first, asynchronously with crustal necking (Figure 4b). Necking of the upper mantle starts first because this layer has the largest effective viscosity and consequently the largest associated deviatoric stresses (see the depth-dependent stress profiles of Figures 2 and 3f). Yet the strongest level in the lithosphere corresponds to the “intrinsic necking depth” of Braun and Beaumont (1989), which tends to remain horizontal during the necking process and stymies the buoyancy forces (see also Kooi et al., 1992). In our model, because the intrinsic necking depth is below the Moho, the latter is overdeepended with respect to its isostatic equilibrium. The competition between the deep necking level and the buoyancy forces translates into upper mantle flexure, which is highlighted by the compres-sional deviatoric stress in the uppermost mantle (Figure 4f; see also Figures 3g and 3h and green curve in Figure 3p). Because of the efficient mechanical decoupling between the crust and the mantle and active flow of the weak lower crust, the strong brittle/plastic upper crust remains largely unaffected by the necking in the upper mantle.
This lower crustal flow process was already evidenced by Huismans and Beaumont (2011; their Figure 3a) and Brune et al. (2017; their Figures 10 and 13), among others. Crustal flow occurs when part of the crust is ductile, either because it is made of a compositionally relatively weak material (for instance dry or wet quartz) and/or because the geothermal gradient is high. In the absence of a significant decoupling layer within the crust, crustal and mantle necking are synchronous, and only progressive subsidence is recorded at the surface (e.g., Figure 8 in Chenin et al., 2018).
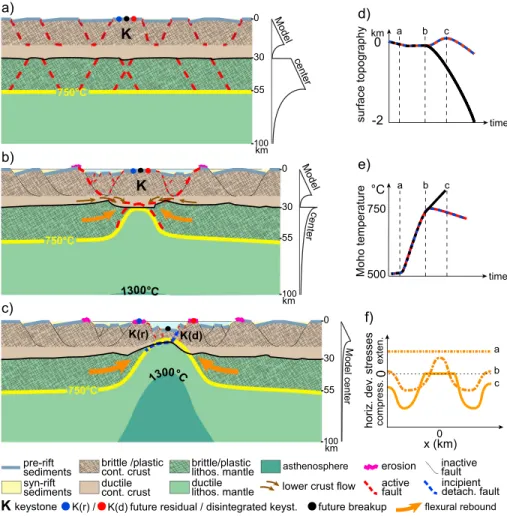
Figure 4. Conceptual model for the evolution of a mechanically decoupled lithosphere during extension: (a) phase of
distributed extension; (b) upper mantle necking phase; and (c) crustal necking phase (see text for discussion). The depth-dependent stress profile to the right of each panel schematized the rheology at the rift center; the blue, black, and red markers point to specific locations of the future distal margins whose surface topography and Moho temperature are schematized in graphs (d) and (e). (f) schematic evolution of the horizontal deviatoric stress in the uppermost mantle along the model. Abbreviations: cont. = continental; compress. = compressional; detach. = detachment; dev. = deviatoric; exten. = extensional; horiz. = horizontal; keyst. = keystone; lithos. = lithospheric.
In our model, only limited subsidence occurs in the center of the rift system due to the insignificant crustal thinning above the upper mantle necking region (Figure 4d; see also Figure 3m). This stage can be linked with the shallow-water nature of the sediments affected by the unconformity in the Briançonnais domain (i.e., Triassic to early Jurassic platform carbonates; e.g., Bourbon, 1980; Lemoine et al., 1986).
The early necking of the upper mantle with respect to the crust causes an increase in temperature (up to 750◦C) at the base of the crustal keystone (Figure 4e; see also Figures 3j and 3o). This behavior was already noticed by Huismans and Beaumont (2011), Svartman Dias et al. (2015), and Hart et al. (2017). The lat-ter related the high heat flow at the base of the modeled keystone to the thermal pulse recorded in the Mauléon Basin, in Corsica, and in the Southern Alps. Our model supports the conclusion presented by these authors. We go further by suggesting that viscoelastoplastic necking of the upper mantle alone can explain the existence of a heat pulse during early stages of crustal necking, without the need of large-offset normal faults. Indeed, as our model does not include strain-softening processes, deformation is relatively diffuse, resembling pinch-and-swell formations (Fletcher & Hallet, 1983; Smith, 1977). In contrast, the models from Huismans and Beaumont (2011), Svartman Dias et al. (2015), and Hart et al. (2017) employ intense strain softening that generates three to seven major normal faults with offset of more than 10 km. Such localized structures facilitate high-amplitude differential movements and hence both uplift and subsidence within the crust and the mantle. In other words, we suggest that the heat pulse recorded at the base of the keystone
is not primarily controlled by localized brittle faulting but by regional viscoplastic upper mantle necking, although strain softening may intensify the heat pulse.
As necking of the upper mantle progresses, the latter looses its strength (Figures 4c and 4f; see also Figures 3g and 3h and green curve in Figure 3p). As a result, the flexural stresses can play, propelling the overdeepened Moho upward toward an isostatically compensated depth. This flexural isostatic rebound (represented by the orange arrows in Figure 4c) triggers the uplift and emersion of the two adjacent blocks of thick continental crust (Figure 3m; compare also green and blue curves in Figure 3p). Necking of the upper mantle is achieved, and crustal necking starts in its wake (Figure 3d). We suggest that the reason for emersion of parts of the future distal margin is the flexural rebound beneath thick, and thus relatively buoyant, continental crust (Figures 3m, 3n, and 3p).
The existence of regions of thick crust in rifted margins can be observed on several seismic sections (e.g., the Galicia, Hatton, Rockall, and Porcupine Bank in eastern North Atlantic and the Flemish Cap in western North Atlantic). Recently, Clerc et al. (2018) suggested that crustal-scale boudinage may be at the origin of the large-scale thickness changes in the crust at, for instance, the Iberia, Barrent Sea, Møre, Vøring, Namibia, and South China Sea margins. We underline that large-offset normal faults due to strain softening, which promote differential uplift (see above), are not required to account for the transient emersion of the distal domain.
The phase of transient emersion of the distal domain observed in our model can be linked with the karst affecting the Briançonnais unit, which attests to subaerial exposure. It can also explain the erosional uncon-formities reported in the outer hinge of the Campos Basin (Lewis et al., 2014) and at the second terrace of the East India margin (Haupert et al., 2016), both of which lie in the distal part of the margin, in a position comparable to that of the Briançonnais domain in the former European margin of the Alpine Tethys. As the two blocks of thick continental crust are progressively advected away from the rift center, they cool down and thus keep record of the thermal pulse (Figures 4e and 3o) and begin to subside (Figures 4d and 3m). Subsidence of the future distal margin will presumably accelerate during the subsequent stage of coupled deformation (i.e., hyperextension), as the initial keystone is going to be increasingly thinned by extensional detachment faults (e.g., Florineth & Froitzheim, 1994; Nirrengarten et al., 2016; Pérez-Gussinyé et al., 2003; Reston, 2007).
Our model results indicate that the following features are important to generate transient synrift emersion of distal parts of rift systems in numerical simulations:
1. A mechanically strong upper mantle to generate significant necking and downward movement of the Moho; the use of a weaker (wet olivine) mantle decreases initial subsidence but does not generate a late necking flexural rebound (Figures B2b, B2d, and B2f).
2. A mechanically weak crustal layer between the upper mantle and brittle-plastic upper crust to generate mechanical decoupling and lateral crustal flow; stronger crustal rheologies, due to either a stronger mate-rial and/or a lower geothermal gradient, result in lower uplift and thus not necessarily in emersion of distal domains (sections B2 and B3).
3. A sufficiently high numerical resolution in space and time to accurately calculate the free surface deformation and the lateral flow in the weak crustal regions.
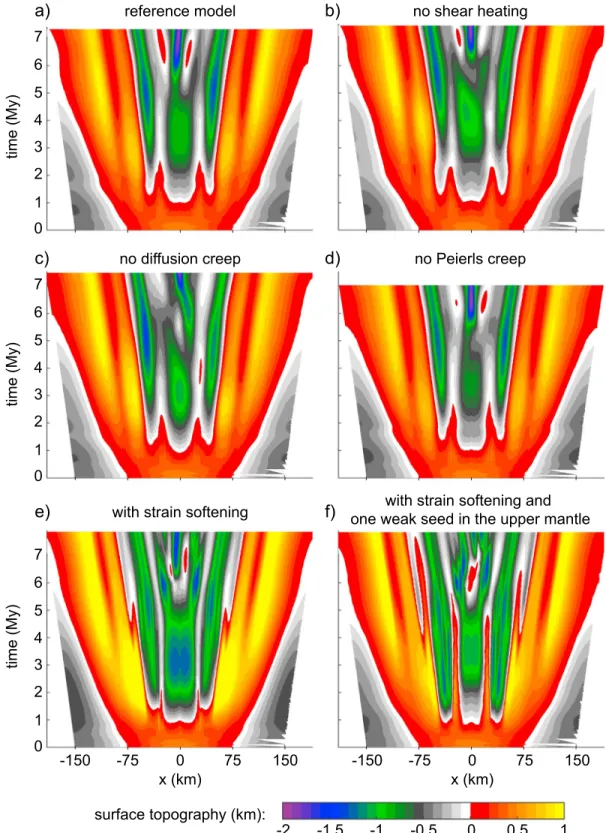
Previous modeling studies that did not report emersion of the future distal margin may have lacked one of the above features. Transient synrift emersion of the distal domain is still observed in simulations that do not include shear heating, diffusion creep, or Peierls creep and in simulations that include strain softening (section B4). Thus, these processes can be regarded as of second-order importance with respect to emer-sion. High extension rates promote uplift of the distal domain (section B5) because they favor brittle-plastic behavior; yet as mentioned in point 1 above, the thicker the brittle-plastic upper mantle, the more important its flexural rebound.
6. Conclusion
We present a thermomechanical numerical model that predicts transient emersion of distal parts of a rift system during advanced stages of extension and after an initial phase of subsidence. Our results show that asynchronous necking of first the upper lithospheric mantle and then the crust can account for two
characteristic features observed in the former distal European margin of the Alpine Tethys (i.e., the Bri-ançonnais domain), namely, (1) an intense regional heat pulse at the base of the crust, and slightly later and/or contemporaneously (2) a transient and regional phase of emersion that does not affect the proximal domains. This synrift emersion is enabled by the flexural isostatic rebound of the upper mantle following its necking beneath a largely unthinned crust. These results may also explain the enigmatic local erosional unconformities reported in distal parts of several present-day rifted margins.
Appendix A: Numerical Model Formulation
The applied numerical algorithm is based on the finite-difference/marker-in-cell method (e.g., Duretz et al., 2016; Gerya & Yuen, 2003; Schmalholz et al., 2019). The governing equations for 2-D incompressible defor-mation of viscoelastoplastic material coupled with heat transfer and gravity are described in detail in the next section. The diffusive terms in the force balance equations and in the heat transfer equations are dis-cretized on a Eulerian staggered grid, while advection and rotation terms are treated explicitly on Lagrangian markers using a fourth-order in space Runge-Kutta time integration (Duretz et al., 2016). The topography in the model is a material interface defined by a Lagrangian marker chain, and this interface is displaced with the numerically calculated velocity field. With ongoing deformation, this marker chain needs to be locally remeshed, which is achieved by adding marker points in the deficient chain segments. The applied numerical mesh consists of 600 nodes in the horizontal direction (resolution of 500 m) and 800 nodes in the vertical direction (resolution of 250 m). The models were run with a Courant number of 0.45 and a maximum allowed time step of 4,000 years.
The applied numerical algorithm solves the partial differential equations of continuum mechanics for 2-D slow deformations (no inertia) coupled with heat transfer under gravity. The force balance equations are as follows:
𝜕𝜎i𝑗
𝜕x𝑗
= −𝜌bi (A1)
where i and j are indexes of either 1 or 2 and represent the horizontal x direction (i, j = 1) and vertical y direction (i, j = 2), b1 = 0 and b2 = g. 𝜎ijare the total Maxwell-viscoelastic stress tensor components, which are expressed using a backward-Euler rule (e.g., Schmalholz et al., 2001) by
𝜕𝜎i𝑗= −P +2 ( 1 𝜂 + 1 GΔt )−1 . 𝜀i𝑗+ ( 1 +GΔt 𝜂 )−1 𝜎o
i𝑗+Ji𝑗 (A2)
where P corresponds to the pressure,𝜀.i𝑗are the components of the deviatoric strain rate tensor, G is the shear modulus,𝜂 is the effective viscosity, t is the numerical time step, 𝜎o
i𝑗are the stress tensor components
from the previous time step, and Jijincludes all the corresponding terms resulting from the Jaumann rate of the stress tensor (e.g., Beuchert & Podladchikov, 2010).
The rheological model is based on the additive decomposition of the deviatoric strain rate tensor𝜀.i𝑗:
.
𝜀i𝑗=𝜀.eli𝑗+𝜀.pei𝑗 +𝜀.disi𝑗 +𝜀.di𝑓i𝑗 +𝜀.pei𝑗 (A3)
where𝜀.el
i𝑗,𝜀.pli𝑗,𝜀.disi𝑗,𝜀.di𝑓i𝑗 , and𝜀.pei𝑗 correspond to the strain rate contributions arising from elasticity, plasticity,
and viscous creep (dislocation, diffusion, and Peierls), respectively. This strain rate equation is nonlinear and solved locally on cell centroids and vertices in order to define the current effective viscosity and stress (e.g., Popov & Sobolev, 2008). The viscosity for dislocation creep is a function of the dislocation creep strain rate invariant,𝜀.disII =𝜏II∕2𝜂dis
𝜂dis= 2 1−n n 31+n 2n A(𝜀.di𝑓II ) 1 n−1 exp ( Q + PV nRT ) (A4) where the ratio involving the stress exponents to the left of A results from the conversion of the experimen-tally derived 1-D flow law to a general flow law for tensor components based on invariants (e.g., Gerya, 2010; Schmalholz & Fletcher, 2011). Applied parameters are displayed in Table 1. Diffusion creep is taken into account in the lithospheric and asthenospheric mantle, and its viscosity is expressed as
𝜂pe=Admexp ( Q + PV nRT ) (A5)
where d = 1.0e−3m is grain size and m is grain size exponent (Table 1). Peierls creep (i.e., low-temperature
plasticity) is applied in both the lithospheric and asthenospheric mantle with parameters from Evans and Goetze (1979) using the approach from Kameyama et al. (1999). The viscosity corresponding to Peierls creep takes the following form:
𝜂pl= 2 1−s s 31+s 2s A(𝜀.disII ) 1 n−1 (A6)
where the A for this formulation is
A = [ Apexp ( −Q(1 −𝛾) 2 RT )]−1s 𝛾𝜎p (A7)
and where s is an effective stress exponent that depends on the temperature:
s =2𝛾 Q
RT(1 −𝛾) (A8)
where𝛾 is a fitting parameter from the Peierls flow law (Table 1).
The stress of all material phases is limited by a yield stress,𝜏y, defined by the Drücker–Prager criterion:
𝜏𝑦=Cocos(𝜙) + P sin(𝜙) (A9)
where Co is the cohesion and𝜙 is the angle of internal friction (Table 1). In case of yielding, the effective viscosity is iteratively reduced until the corresponding stress invariant equals the yield stress (e.g., Lemiale et al., 2008; Schmalholz & Maeder, 2012). Therefore, the effective viscosity for plasticity is computed only for𝜏II−𝜏y ≥ 0 and takes the form of
𝜂pl= 𝜏𝑦
2𝜀.plIIif𝜏II
−𝜏𝑦≥ 0 (A10)
where𝜀.plII is the second invariant of the plastic strain rate tensor having components𝜀.pli𝑗(equation (A3)). At the end of the local iteration cycle, the effective viscosity is equal to the harmonic mean of the viscosities of each dissipative deformation mechanism:
𝜂 = ⎛ ⎜ ⎜ ⎜ ⎝ 1 𝜂dis(𝜀dis II ) + 1 𝜂di𝑓(𝜀di𝑓 II ) + 1 𝜂pe(𝜀pe II ) + 1 𝜂pl(𝜀pl II ) ⎞ ⎟ ⎟ ⎟ ⎠ −1 (A11)
Equation (A11) indicates that each viscosity is calculated with the respective second strain rate invariant, which is calculated from the strain rate tensor components of the corresponding deformation mechanism (equation (A3)).
The applied 2-D equation for heat transfer is
𝜌cDT Dt = 𝜕𝜕xi ( k 𝜕T 𝜕xi ) +HD+HR (A12)
with D∕Dt representing the total time derivative, HRbeing the radiogenic heat production and HD= (𝜏112 +
𝜏2 22+𝜏
2
12)∕2𝜂 being the heating due to viscous and plastic dissipative work. Here we assume that all dissipative
work is converted into heat (i.e., the so-called Tayloruinney coefficient is 1) since we do not model grain size reduction, which consumes typically only a minor fraction of the dissipative work.
Appendix B: Additional Numerical Simulations
B1. Resolution Test
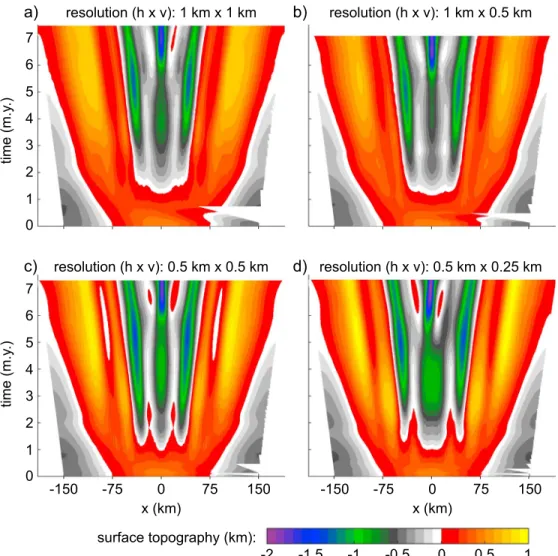
Running simulations with identical configurations as our main model (Figure 2) but using various reso-lutions of the numerical grid highlights the consistency of the modeling results (Figure B1). The general topographic evolution along the margin is similar among the four simulations, although synrift emersion of the distal domain is more pronounced in the two models with highest resolution (Figures B1c and B1d): in these simulations, emersion occurs on either side of the rift center, while it is limited to the right-hand side in the model with lowest resolution (Figure B1a) and lacking in the model with a 1-km × 500-m resolution (Figure B1b).
Figure B1. Evolution of the surface topography with time along the model for four models with identical
configurations as our main model (Figure 2), except the numerical grid resolution (h×v: horizontal×vertical): (a) 1 km×1 km; (b) 1 km×500 m; (c) 500 m×500 m; (d) 500 m×250 m.
B2. The Impact of Crustal and Mantle Rheology: Monophase Crust Models
Figure B2 shows that models with a stronger crust and/or a weaker mantle compared to our reference model (Figure B2e) do not show synrift emersion of the distal domain. The uplift of the distal parts of the rift system seems to be facilitated by both weak crustal and strong mantle rheologies. The reasons are, on the one hand, that weak crustal rheologies allow for significant lower crustal flow and thus delayed crustal thinning above the upper mantle necking zone. On the other hand, strong mantle rheologies induce a significant overdeep-ening of the Moho during upper mantle necking and thus a vigorous flexural rebound. In such cases, the maximum uplift occurs during the latest stages of the necking phase (Figures B2a, B2c, and B2e). In con-trast, in models with weaker mantle rheologies, the late necking uplift of the distal domain is extremely limited (Figure B2b) or even lacking (Figures B2d and B2f).
B3. The Impact of Crustal and Mantle Rheology: The Impact of a Strong Lower Crust
Figure B3 shows that, when a 6-km thick lower crust made of mafic granulite is modeled at the base of a dry or wet quartz continental crust, no emersion of the distal domain occurs any more. Nevertheless, the simulation with a wet quartz upper crust and a dry olivine mantle (Figure B3c) shows a transient uplift of the distal domain to extremely shallow depth (less than 100 m) during the latest stages of the necking phase. B4. The Impact of Other Processes
We tested the impact of various parameters that are not necessary used in numerical models in order to facilitate comparison with simulations from other studies. We notice that all models presented in Figure B4
Figure B2. Evolution of the surface topography with time along the model for six models with a comparable
configuration as our main model (Figure 2) but with various crust and mantle rheologies and a numerical resolution of 1 km×1 km. (a) Felsic granulite crust and dry olivine mantle. (b) Felsic granulite crust and wet olivine mantle. (c) Anorthite60crust and dry olivine mantle. (d) Anorthite60crust and wet olivine mantle. (e) Dry quartz crust and dry olivine mantle. (f) Dry quartz crust and wet olivine mantle. Felsic granulite flow law from Ranalli (1995); Anorthite60 from Rybacki and Dresen (2004); dry quartz from Ranalli (1995) and Ranalli (1997); dry and wet olivine dislocation and diffusion creep from Hirth and Kohlstedt (2003); Peierls creep from Evans and Goetze (1979) using the approach from Kameyama et al. (1999).
show transient synrift emersion of the distal domain. When shear heating is not modeled (Figure B4b), the topographic evolution of the rift system is largely similar to that of our reference mode (Figure B4a), except that emersion of the distal domains occurs only on the left-hand side of the rift center. The timing of distal domain emersion is earlier in the simulation where diffusion creep is not modeled since it occurs between 3 and 4 Myr, that is, at half of the necking time. When Peierls creep is not modeled (Figure B4d), the topographic evolution of the model is again very similar to that of the reference model. Parts of the distal domains are transitorily uplifted above the reference level on either side of the rift center during late stages of the necking phase; however, the duration of emersion is slightly less than in our reference model (Figure B4a). The use of strain softening (Figures B4e and B4f) facilitates differential uplift/subsidence by favoring large offset movements on a limited number of faults; as a result, the modeled rift systems display a sharper and more pronounced relief. We notice that the use of a weak seed to trigger the initial localization of deformation may significantly impact the topographic evolution of the model during the entire simulation (B4f).
Figure B3. Evolution of the surface topography with time along the model for four models with a comparable
configuration as our main model (Figure 2) but with a 6-km thick lower crust made of mafic granulite (Ranalli, 1995) and various upper crust and mantle rheologies. (a) Dry quartz upper crust and dry olivine mantle. (b) Dry quartz upper crust and wet olivine mantle. (c) Wet quartz upper crust and dry olivine mantle. (d) Wet quartz upper crust and wet olivine mantle. Dry and wet quartz flow laws are from Ranalli (1995) and Ranalli (1997); dry and wet olivine
dislocation and diffusion creep flow laws are from Hirth and Kohlstedt (2003); Peierls creep flow law is from Evans and Goetze (1979) using the approach from Kameyama et al. (1999).
Figure B4. Evolution of the surface topography with time along the model for six models with a comparable
configuration as our main model (a) but (b) no shear heating; (c) no diffusion creep; (d) no Peierls creep; (e) with strain softening consisting in a linear decrease of the internal angle of friction from 30◦to 15◦and of the cohesion from 10 to 1 MPa when accumulated plastic strain increases from 5% to 50%, after which both the internal angle of friction and the cohesion remain constant; (f) strain softening (see e) and a circular weak seed of 4-km diameter located at a depth of 34.5 km in the model center (i.e., just beneath the Moho) made of dry olivine with reduced angle of friction (15◦) and cohesion (1 MPa) with respect to those of the encompassing mantle (30◦and 10 MPa, respectively.
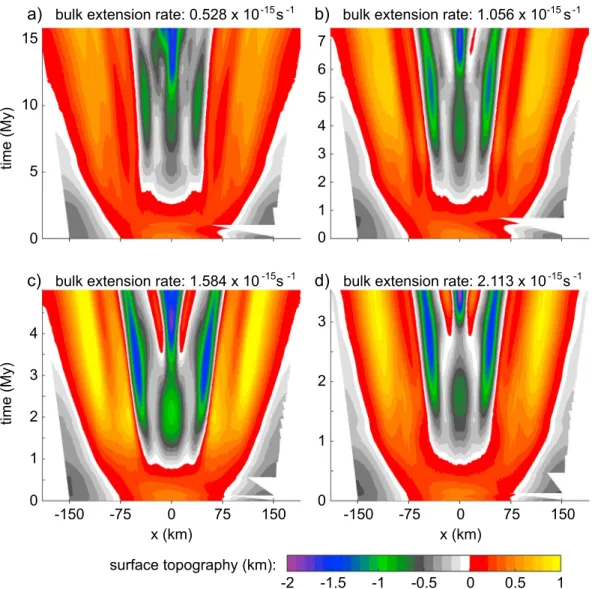
Figure B5. Evolution of the surface topography with time along the model for four models with a comparable
configuration as our main model (Figure 2) but with a resolution of 1 km×1 km and different extensional strain rates: (a) 0.528e−15s−1; (b) 1.056e−15s−1; (c) 1.584e−15s−1; and (d) 2.113e−15s−1.
B5. The Impact of the Extensional Strain Rate
Figure B5 displays the results of a series of models with identical initial configurations but extended at various strain rates, namely, (a) 0.528e−15s−1(∼ 0.5 cm/year), (b) 1.056e−15s−1(∼ 1 cm/year—our reference
model), (c) 1.584e−15s−1(∼ 1.5 cm/year), and (d) 2.113e−15s−1(∼ 2 cm/year). This series highlights that
the higher the extension rate, the more important the emersion of the distal domain during late necking stages. The reason is that high extension rates favor brittle-plastic behavior in all the modeled materials. As a consequence of the thicker brittle-plastic upper mantle, the intrinsic lithospheric necking depth is deeper. The Moho overdeepening is more important during upper mantle necking, and thus its flexural rebound is also more intense when the upper mantle has lost most of its strength.
References
Bache, F., Olivet, J. L., Gorini, C., Aslanian, D., Labails, C., & Rabineau, M. (2010). Evolution of rifted continental margins: The case of the Gulf of Lions (Western Mediterranean Basin). Earth and Planetary Science Letters, 292(3-4), 345–356. Retrieved from https://doi.org/10. 1016/j.epsl.2010.02.001
Ball, P., Eagles, G., Ebinger, C., McClay, K., & Totterdell, J. (2013). The spatial and temporal evolution of strain during the separation of Australia and Antarctica. Geochemistry, Geophysics, Geosystems, 14, 2771–2799. Retrieved from https://doi.org/10.1002/ggge.20160 Barféty, J. C., Lemoine, M., De Graciansky, P. C., Tricart, P., & Mercier, D. (1996). Notice explicative, carte géologique de la France (1/50 000),
feuille Briançon (823). Orléans: BRGM.
Acknowledgments
We thank Sascha Brune, John Naliboff, and two anonymous reviewers for their constructive comments. We also acknowledge constructive reviews by Christopher Beaumont, Loic Fourel, and Alexander Koptev at an earlier stage of this work. All the data used are listed in Table 1 or in the references.
Baud, P. A. (1976). Les terriers de Crustacés décapodes et l'origine de certains faciès du Trias carbonaté. Eclogae Geologicae Helvetiae, 69(2), 415–424.
Baud, A., & Masson, H. (1975). Preuves d'une tectonique liasique de distension dans le domaine briançonnais: Failles conjuguées et paléokarst Saint-Triphon (Préalpes Médianes, Suisse). Eclogae Geologicae Helvetiae, 68, 131–145.
Bell, C., & Butler, R. W. H. (2017). Platform-basin transitions and their role in Alpine-style collision systems: A comparative approach.
Swiss Journal of Geosciences, 110(2), 535–546. Retrieved from https://doi.org/10.1007/s00015-016-0238-z
Beltrando, M., Stockli, D. F., Decarlis, A., & Manatschal, G. (2015). A crustal-scale view at rift localization along the fossil Adriatic margin of the Alpine Tethys preserved in NW Italy. Tectonics, 34, 1927–1951. Retrieved from https://doi.org/10.1002/2015TC003973 Beuchert, M. J., & Podladchikov, Y. Y. (2010). Viscoelastic mantle convection and lithospheric stresses. Geophysical Journal International,
183(1), 35–63. Retrieved from https://doi.org/10.1111/j.1365-246X.2010.04708.x
Bourbon, M. (1980). Evolution d'un secteur de la marge nord-téthysienne en milieu pélagique: La zone briançonnaise près de Briançon entre le début du Malm et l'Eocène inférieur (Unpublished doctoral dissertation), Université Louis Pasteur.
Braitenberg, C., Pettenati, F., & Zadro, M. (1997). Spectral and classical methods in the evaluation of Moho undulations from gravity data: The NE Italian Alps and isostasy. Journal of Geodynamics, 23(1), 5–22. https://doi.org/10.1016/S0264-3707(96)00024-5
Braun, J., & Beaumont, C. (1989). A physical explanation of the relation between flank uplifts and the breakup unconformity at rifted continental margins. Geology, 17(8), 760–764. https://doi.org/10.1130/0091-7613(1989)017<0760:APEOTR>2.3.CO
Brune, S., Heine, C., Clift, P. D., & Pérez-Gussinyé, M. (2017). Rifted margin architecture and crustal rheology: Reviewing Iberia-Newfoundland, central South Atlantic, and South China Sea. Marine and Petroleum Geology, 79, 257–281. Retrieved from https:// doi.org/10.1016/J.MARPETGEO.2016.10.018
Brune, S., Heine, C., Pérez-Gussinyé, M., & Sobolev, S. V. (2014). Rift migration explains continental margin asymmetry and crustal hyper-extension. Nature Communications, 5, 4014. Retrieved from https://doi.org/10.1038/ncomms5014
Burgess, P. M., Gurnis, M., & Moresi, L. (1997). Formation of sequences in the cratonic interior of North America by interaction between mantle, eustatic, and stratigraphic processes. Geological Society of America Bulletin, 109(12), 1515–1535. Retrieved from https://doi.org/10.1130/0016-7606(1997)109<1515:FOSITC>2.3.CO;2
Butler, R. W. H. (2013). Area balancing as a test of models for the deep structure of mountain belts, with specific reference to the Alps.
Journal of Structural Geology, 52(1), 2–16. Retrieved from https://doi.org/10.1016/j.jsg.2013.03.009
Campbell, I. H. (2005). Large igneous provinces and the mantle plume hypothesis. Elements, 1(5), 265–269. Retrieved from https://doi.org/ 10.2113/gselements.1.5.265
Chenin, P., Schmalholz, S. M., Manatschal, G., & Karner, G. D. (2018). Necking of the lithosphere: A reappraisal of basic concepts with thermo-mechanical numerical modeling. Journal of Geophysical Research: Solid Earth, 123, 5279–5299. https://doi.org/10.1029/ 2017JB014155
Claudel, M. E., & Dumont, T. (1999). A record of multistage continental break-up on the Briançonnais marginal plateau (Western Alps): Early and Middle-Late Jurassic rifting. Eclogae Geologicae Helvetiae, 92(1), 45–61.
Clerc, C., Ringenbach, J. C., Jolivet, L., & Ballard, J. F. (2018). Rifted margins: Ductile deformation, boudinage, continentward-dipping normal faults and the role of the weak lower crust. Gondwana Research, 53, 20–40. Retrieved from https://doi.org/10.1016/j.gr.2017. 04.030
Crosby, W. O., & Crosby, I. B. (1925). Keystone faults. Geological Society of America Bulletin, 36(4), 623–640. Retrieved from https://doi. org/10.1130/GSAB-36-623
Dal Piaz, G. V. (1993). Evolution of Austro-Alpine and upper Penninic basement in the northwestern Alps from Variscan convergence to post-Variscan extension. In J. F. Von Raumer, & F. Neubauer (Eds.), Pre-Mesozoic geology in the Alps (pp. 327–344). Berlin, Heidelberg: Springer Berlin Heidelberg. Retrieved from https://doi.org/10.1007/978-3-642-84640-319
De Graciansky, P. C., Roberts, D. G., & Tricart, P. (2011). The Western Alps, from rift to passive margin to orogenic belt: An integrated geoscience overview. In J. F. Schroder (Ed.), Developments in Earth surface processes. Amsterdam: Elsevier.
Debelmas, J. (1955). Les zones subbriançonnaise et brianconnaise occidentale entre Vallouise et Guillestre (Hautes-Alpes).
Decarlis, A., Beltrando, M., Manatschal, G., Ferrando, S., & Carosi, R. (2017). Architecture of the distal Piedmont-Ligurian rifted margin in NW Italy: Hints for a flip of the rift system polarity. Tectonics, 36, 2388–2406. Retrieved from https://doi.org/10.1002/2017TC004561 Decarlis, A., Dallagiovanna, G., Lualdi, A., Maino, M., & Seno, S. (2013). Stratigraphic evolution in the Ligurian Alps between Variscan heritages and the Alpine Tethys opening: A review. Earth-Science Reviews, 125, 43–68. Retrieved from https://doi.org/10.1016/j.earscirev. 2013.07.001
Decarlis, A., Fellin, M. G., Maino, M., Ferrando, S., Manatschal, G., Gaggero, L., et al. (2017). Tectono-thermal evolution of a distal rifted margin: Constraints from the Calizzano massif (Prepiedmont-Briançonnais domain, Ligurian Alps). Tectonics, 36, 3209–3228. Retrieved from https://doi.org/10.1002/2017TC004634
Decarlis, A., & Lualdi, A. (2008). Late Triassic-Early Jurassic paleokarst from the Ligurian Alps and its geological significance (Siderolitico Auct., Ligurian Briançonnais domain). Swiss Swiss Journal of Geosciences, 101(3), 579–593. Retrieved from https://doi.org/10.1007/ s00015-008-1302-0
Duretz, T., May, D., & Yamato, P. (2016). A free surface capturing discretization for the staggered grid finite difference scheme. Geophysical
Journal International, 204(3), 1518–1530. Retrieved from https://doi.org/10.1093/gji/ggv526
Eberli, G. P. (1988). The evolution of the southern continental margin of the Jurassic Tethys Ocean as recorded in the Allgäu Formation of the Austroalpine Nappes of Graubünden (Switzerland). Eclogae Geologicae Helvetiae, 81(1), 175–214.
Esedo, R., van Wijk, J., Coblentz, D., Meyer, R., Wijk, J. V., Coblentz, D., & Meyer, R. (2012). Uplift prior to continental breakup: Indication for removal of mantle lithosphere Geosphere, 8(5), 1078–1085. Retrieved from https://doi.org/10.1130/GES00748.1
Evans, B., & Goetze, C. (1979). The temperature variation of hardness of olivine and its implication for polycrystalline yield stress. Journal
of Geophysical Research, 84(B10), 5505–5524. Retrieved from https://doi.org/10.1029/JB084iB10p05505
Faure, J. L., & Megard-Galli, J. (1988). L'Emersion jurassique en Brianconnais; sedimentation continentale et fracturation distensive.
Bulletin de la Société Géologique de France, IV (4), 681–692. Retrieved from https://doi.org/10.2113/gssgfbull.iv.4.681
Fletcher, R. C., & Hallet, B. (1983). Unstable extension of the lithosphere: A mechanical model for Basin-and-Range structure. Journal of
Geophysical Research, 88(B9), 7457–7466. Retrieved from https://doi.org/10.1029/JB088iB09p07457
Florineth, D., & Froitzheim, N. (1994). Transition from continental to oceanic basement in the Tasna Nappe: Evidence for Early Cretaceous opening of the Valais Ocean. Schweizerische Mineralogische und Petrographische Mitteilungen, 74, 437–448.
Froitzheim, N., & Manatschal, G. (1996). Kinematics of Jurassic rifting, mantle exhumation, and passive-margin formation in the Aus-troalpine and Penninic nappes (eastern Switzerland). Bulletin of the Geological Society of America, 108(9), 1120–1133. https://doi.org/10. 1130/0016-7606(1996)108<1120:KOJRME>2.3.CO;2