HAL Id: insu-02796542
https://hal-insu.archives-ouvertes.fr/insu-02796542
Submitted on 5 Jun 2020
HAL is a multi-disciplinary open access
archive for the deposit and dissemination of
sci-entific research documents, whether they are
pub-lished or not. The documents may come from
teaching and research institutions in France or
abroad, or from public or private research centers.
L’archive ouverte pluridisciplinaire HAL, est
destinée au dépôt et à la diffusion de documents
scientifiques de niveau recherche, publiés ou non,
émanant des établissements d’enseignement et de
recherche français ou étrangers, des laboratoires
publics ou privés.
Diurnal variation of nitric oxide in the upper
stratosphere
Y. Kondo, P Aimedmu, Michel Pirre, W. Matthews, R. Ramaroson, W.
Sheldon, J.L. Benbrook, A. Iwata
To cite this version:
Y. Kondo, P Aimedmu, Michel Pirre, W. Matthews, R. Ramaroson, et al.. Diurnal variation of nitric
oxide in the upper stratosphere. Journal of Geophysical Research, American Geophysical Union, 1990,
95 (D13), pp.22513. �10.1029/JD095iD13p22513�. �insu-02796542�
JOURNAL OF GEOPHYSICAL RESEARCH, VOL. 95, NO. D13, PAGES 22,513-22,522, DECEMBER 20, 1990
Diurnal Variation of Nitric Oxide in the Upper Stratosphere
Y. KONDO, 1 P. AIMEDmU? M. PIRRE, • W. A. MATTHEWS, t l{. I•AMAROSON, • W. l{. SI-IELDON, • J. l{. BENBROOK, • AND A. IWATA 1
Two recent measurements of the temporal variation of nitric oxide at constant altitude near 40 km are reported. The observations were made at float altitude with a balloon-borne chemiluminescence detector together with in situ ozone measurements. The first measurement was made at 44øN on September 17, 1987, at an altitude of 40 km from before sunrise until 1000 LT. The second observation was made at the same latitude on June 18, 1988 at 39 km from 0800 to 1230 LT. The precision of the NO measurements is about 10% at these altitudes, obtained through a more accurate determination of the sample flow rate at pressures down to 2 mbar with a reduced ozone/oxygen flow rate. At an altitude of 40 km, nitric oxide was observed to start increasing very rapidly at sunrise when the solar zenith angle reached about 95 ø . After the rapid initial buildup, the rate of NO increase stabilized for 3 hours at about 1.2 ppbv/hour. Near 1100 LT at 39 km in summer the NO mixing ratio was observed to become nearly constant. These features of the diurnal variation of NO are in accord with the temporal variation expected from a time-dependent zero-dimensional photochemical model. Mixing ratios of NOy and N205 have been determined from the measured temporal variation of NO at 39.5 4-0.5 km, using the photochemical model of Pirre et al. (1989). These derived values of the NOy and N205 mixing ratios, 15.54-5.0 ppbv and 1.44-0.6 ppbv, respectively, are in good agreement with other recent measurements by balloon-borne and space-borne infrared experiments.
INTRODUCTION
The catalytic reaction cycle of atomic oxygen and ozone with
nitric oxide (NO) and nitrogen dioxide (NO2) is estimated to
be the major loss process for ozone throughout the stratosphere
below about 40 km [e.g., McElro•t and Salawitch, 1989]. In addition, these oxides of nitrogen (NO=) interact with reactive
chlorine species in the following way: NO reacts with C10 through the reaction
C10 + NO -• C1 + NO2
which competes with the reaction
(R•)
C10 + O --• C1 +
Reaction (R2), together with reaction
(R2)
Cl + O3 -• ClO + O2 (R3)
completes the well-known catalytic cycle of ozone destruction.
The role of reaction (R1) is pronounced in the upper strato-
sphere, where NO is relatively abundant. In the lower strato- sphere, reaction
NO2 + C10 + M -• C1ONO2 + M (R4)
1Solar_Terrestrial Environment Laboratory, Nagoya University,
Japan.
2Service d'A•ronomie, Centre National de la Recherche Scien- tifique, France.
3Laboratoire de Physique et Chimie de l'Environnement, Centre-
National de la Recherche Scientifique, Orleans, France.
4Department of Scientific and Industrial Research, Physical Sci-
ences, New Zealand.
SDepartment of Physics, University of Houston, TX.
Copyright 1990 by the American Geophysical Union. Paper number 90JD01981.
0148-0227 / 90 / 90J D- 01981 $ 05.00
becomes important in temporarily sequestering both C10• and NO•. Since there is interaction between reactive species of chlorine and nitrogen, it is predicted that the rate of ozone destruction by an increase in stratospheric chlorine depends
critically on the NO• or NO• concentration [e.g., Isaksen and Stordal, 1986].
In the daytime upper stratosphere, nitric oxide (NO) be-
comes the most abundant species of total reactive nitrogen,
deœned as NO• - NO -[- NO2 -[- NO3 -[- 2(N20•) -[- HNO3 -[- HNO4 -[- C1ONO2. The concentration of NO is controlled
by the NO• concentration and the photochemical partitioning among the NO• species. The dominance of NO in the NOy family during the daytime is discussed later when the mea- surements are compared to the model calculations of Pirre et
al. [1989]. Since NO• has a photochemical time constant of about a month in the upper stratosphere [Shirnazaki, 1984], it
is constant on the time scale of a day in the same air mass. Consequently, the diurnal variation of NO is caused by change
in the NO/NO• ratio which results from photodissociation of
reservoir species such as N20• and C1ONO2, and by variation
in the NO/NO2 ratio. In order to investigate the complex
chemistry of odd nitrogen in the stratosphere under changing conditions of solar illumination, precise measurements of the diurnal variation of NO in the same air mass are needed.
Observations of the diurnal variation of NO in the upper stratosphere are very limited; however, at lower altitudes, more
observations have been made, mainly with in situ chemilumi- nescence NO detectors [e.g., Ridley et al., 1977; Kondo et al., 1985, 1988, 1989a, b] (see Kondo et al., [1988] for a more com- plete set of references). Ridley and Schiff [1981] measured the
temporal variation of NO at 40 km near sunset. Roscoe et al.
[1986] observed the temporal variation of NO between 32 and
43 km in the morning hours, as well as in the afternoon, using a balloon-borne infrared emission radiometer. To investigate the photochemistry of odd nitrogen, precise measurements of NO in the morning are very important because photodissoci- ation of the various reservoir species, such as N2Os, occurs at that time.
The NO measurements reported here are more accurate than
previous determinations using the chemiluminescent technique.
22,514 KONDO ET AL.: NITRIC OXIDE IN THE UPPER STRATOSPHERE
We have significantly improved the precision of chemilumines- cent NO measurements, mainly through a more precise de-
termination of the flow rates relevant to our balloon-borne chemiluminescence detector [Kondo et al., 1989c]. Here the
diurnal variation of NO at about 40 km from sumise through midafternoon is reported. Quantitative comparison of the ob- served results with a photochemical model is described. A detailed analysis of the observed and calculated diurnal NO variation allowed estimates to be made of the NO w and N2Os mixing ratios.
IN s TRUMEN TATI O N
The two balloon measurements of NO presented here were
made in 1987 and 1988 with a chemiluminescence detector.
This instrument was used previously for balloon observations
up to 32 km in 1983 and 1985 [Kondo et al., 1985, 1988]; af-
ter those experiments the instrument was modified to achieve better precision at 40 km. Detailed descriptions of the chemilu- minescence NO detector used for the present experiments have
been presented by KonHo et al. [1989a, b, c]. Fluctuations of
the zero level of the instrument have been used to obtain an estimate of 25 pptv as the detection limit of the NO instru- ment for 10 s of operation. This value was confirmed during the nighttime flight in 1987, as described later. For NO mixing
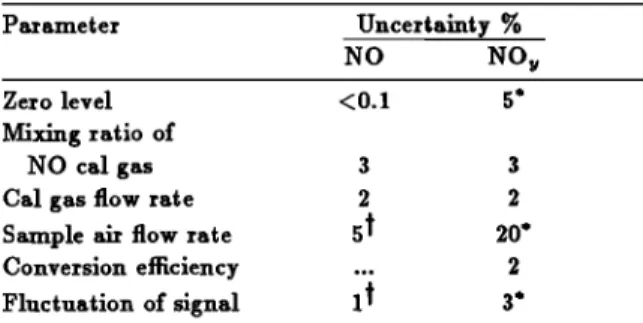
ratios above the detection limit the major sources of error in
the NO measurements are the uncertainty in the mixing ratio of NO in the N2 gas used for calibration during flight, and the mass flow rates of the NO calibration gas and of the sample air. The fluctuation level of the signal is not significant during daytime NO measurements. One of our gas bottles with an NO concentration of 1.98 ppmv used for calibration has been eval- uated recently at the NOAA Aeronomy Laboratory where this
value was confirmed within an accuracy of 3% (D. W. Fahey, private communication, 1990). Estimates of the uncertainties
in the NO measurements are given in Table 1. The precision of the NO measurement derived by adding these uncertainties is about 10%. For the second balloon experiment in 1988 the NO instrument was further modified to measure NO N by adding a
gold converter [KonHo e• al., 1990]. A schematic diagram of
the NO/NO w instrument is shown in Figure 1. The sample air is drawn through the inlet by a Roots pump directly to
the reaction chamber for NO measurements. In an alternative
measurement mode, sample air first passes through a gold con- verter heated to 300øC to reduce NO w into NO catalytically, upstream of the reaction chamber. In order to maintain a high conversion efficiency of NO w to NO, purified carbon monoxide
(CO), passed through charcoal and Teflon filters, is mixed with
TABLE 1. Uncertainties in NO and NO w Measurements
Parameter Uncertainty %
NO NO w
Zero level <0.1 5'
Mixing ratio of
NO cal gas 3 3
Cal gas flow rate 2 2
Sample
air flow
rate
5
$
20*
Conversion efficiency ... 2
Fluctuation
of signal
1
•
3'
•Values
for 40-km altitude.
*Values for 28-km altitude.
the sample air [Bollinger et al., 1983; Fahey et al., 1985]. The
efficiency of conversion of NO2 into NO has been measured in the laboratory to be 0.994-0.02 at pressures between 7 and 60
mbar [Kondo et al., 1990]. The sensitivity of the NO w system
for NO is calibrated during the flight periodically in the same way as for the NO measurement. The zero level of the NO w sys- tem is determined by adding compressed purified air near the entrance of the inlet tube. The NO w measurement system of this NO/NO w instrument is described in detail by Kondo et al.
[1990]. The instrument used in the 1988 •ght can be switched
by telecommand from the NO to the NO w measurement mode and vice versa during a flight. In 1988 it was operated in the NO w mode during ascent between 12 and 28 km and in the NO mode afterward. The sources of errors that affect the pre- cision of the NO w measurements and their estimated values are listed in Table 1. The uncertainty of the flow rate of the sample air for NO w measurements is significantly larger than
that for NO measurements, due to a much reduced flow rate
through the converter, especially at pressures lower than 30 mbar. By summing these uncertainties the precision of NO w
measurement is estimated to be 35% at 28 km and 25% at 20 kin. In both flights, ozone was measured in situ on board the
gondola with a UV photometer from the University of Houston
[Robbins, 1985; Robbins et al., 1990] to an accuracy of about 4.5% and with a chemiluminescent ozone instrument from Ser-
vice d'A•ronomie [Airnedieu and Barat, 1981; Airnedieu, 1983;
Airnedieu et al., 1987] to an accuracy of about 4.10%.
BALLO ON OBSERVATIONS
The first of these observations in the upper stratosphere was
made on September 17, 1987, on a balloon launched from the Centre National d'Etudes Spatiales (CNES) balloon-launching center at Aire sur PAdour in France (44øN, 0øW). The gon- dola was suspended 250 m below a 600,000-m z balloon; launch was at 0210 universal time (UT), and float altitude of 40.2 km (2.7 mbar) was reached at around 0500 UT. Measurements
of NO at this altitude were made until around 1000 UT, at which time a slow descent was initiated. The NO profile ob- tained during the descent has been presented by Kondo et al.
[1989a], together with the temperature profile and the ozone
profile measured by the UV photometer. The ozone mixing ratio measured at float altitude by the UV photometer and the chemiluminescence instrument were 5.8 and 5.7 ppmv, re- spectively; the temperature at float altitude was -27øC. A photograph taken from Meteosat II at 0930 UT shows that southern France was dotted with a light cloud cover of a few
percent at that time.
The measured NO concentration versus UT at float altitude
is shown in Figure 2, along with fluctuations in the altitude of the balloon. During this flight, local solar time and UT were
nearly identical; local solar time was only 1.5 rain ahead of
UT at sunrise. The variation of the NO concentration near
sunrise is shown in greater detail in Figure 3 as a function
of solar zenith angle (SZA). The nighttime value of the NO
mixing ratio was about 0 4.0.02 ppbv. At sunrise, when the SZA decreased to 96 ø, NO started to increase slightly and then increased rapidly between 95 ø and 91 ø. For reference, a calcu-
lated curve of the NO2 photodissociation coefficient (3NO2), as
described below, is also shown in this figure; the simultaneous increases in the measured NO mixing ratio and J•NO2 near sun- rise can be noted. After 0600 UT, NO continued to increase at an average rate of 1.2 ppbv/hour for three hours. Kondo et al.
KONDO ET AL.: NITRIC OXIDE IN THE UPPER STRATOSPHERE 22,515
• PMT
I
OZONIZERFILTER
..-.--•
Cp
• FILT
MFC VALVE MFC MLV7 MLV4 PURE AIR SAMPLEFig. 1. Schematic diagram of the NO/NOy instrument used
for the flight on June 18, 1988. MLV, magnetic latch valve; MFC, mass flow controller; CPR, constant pressure regu-
PUMP CONVERTER MLV6 MFC FILTER CPR C. FILTER MLVS MFC CPR
No
lator; PMT, photomultiplier tube; and C. Filter, charcoal filter. S7_R[de•) 15 , • , • , , , SEP. 17, 1987 5h 6h 7h 8h 9h lOh UT 41 39 lh
Fig. 2. Temporal
variation
of NO versus
universal
time (UT)
measured at the float altitude of 40 km. The altitude of the balloon is shown as a solid line. Solar zenith angle (SZA) is
given on the upper scale.
' I • I • I i I ' I i I ' I I I ' I ' I ' I •
10 10
SEP. 17, 1987 _
98 97 96 95 94 93 92 91 90 89 88 87 86 $ZA[deg)
Fig. 3. Temporal variation of NO near sunrise versus SZA. The calculated photodissociation coefficient of NO2 provided
by S. Solomon (private communication, 1990) is shown as a
solid line.
km. The rate of increase in NO seems to have become smaller
around 0930 UT. However, there are irregular variations in the
NO data, so the detailed structure of the diurnal variation of
NO in the late morning is not well defined by the present data. The second experiment, which investigated the temporal
variation of NO in the late morning hours, was launched on June 18, 1988, from the CNES balloon launching site at Gap
(44.5øN,
6øE) using
a 400,000-m
3 balloon.
The same
gondola,
but with the NO/NOy instrument for this flight, was launched at 0503 UT and reached a float altitude of 39.1 km (3.7 mbar)
22,516 KONDO ET AL.: NITRIC OXIDE IN' THE fLIPPER STRATOSPHERE
at 0735 UT. It stayed at that altitude until a slow descent was
initiated at around 1200 UT. The descent NO profile between 39 and 28 km measured in the afternoon has been presented
by Kondo et al. [1989a], together with the ozone and temper-
ature profiles. The NO N measurements performed during the ascent at altitudes between 12 and 28 km have also been de-
scribed previously [Kondo et al., 1990]. The temperature and
ozone mixing ratio measured by the UV photometer at float altitude were -14øC and 5.3+0.2 ppmv, respectively. From a photograph taken by Meteosat II at 1200 UT, about 20% of southern France was covered with clouds. However, the region below the balloon ttight path was free of thick clouds.
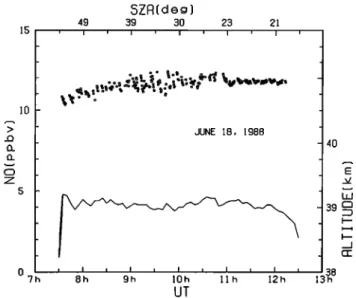
The NO mixing ratio measured at float altitude from 0730 until 1230 UT is shown in Figure 4. Local time was 16 +7 rain in advance of UT during this flight. During the first half of this period the NO concentration increased slowly from about 11 to 12 ppbv, after which time it became nearly constant. By combining the data from the two flights reported here, the diurnal variation of NO near 40 km from before sunrise until past local noon has been experimentally measured.
RESULTS AND DISCUSSION
For quantitative analysis of the observed NO data, a time- dependent zero-dimensional model described by Pi•'e et al.
[1989] was used. Related reaction rate coefficients appropriate
for the measured temperatures were adopted from Jet Propul-
sion Laboratory [1987] (hereinafter JPL [1987]). From the mix- ing ratio of total reactive nitrogen ([NON] = [NO] + IN02] + [NOs] + 2[N20•] + [HNOs] + [HO2NO2] + [C1ONO•]) at 40
and 39 km and the diurnal variation of the SZA, the temporal variation of each species can be calculated. For the partitioning between NO and NO2 the photodissociation of NO2 plays an important role. The NO2 photodissociation coefficient, J•vo2,
has been calculated recently by Solomon et al. [1989]; here, values of J•vo2 provided by S. Solomon (private communica- tion, 1990) have been used for $ZA larger than 85 ø and are
shown in Figure 3. The effects of multiple scattering were in-
cluded in the calculation, and an albedo of 0.15 was assumed,
consistent with the light cloud cover observed during both bal- loon ttights. All other calculated results described in this paper
are based on the model of Pirre et al. [1989].
NO Diurnal Variation
First, the temporal variation of NO has been calculated for the conditions at float altitude on September 17. The mea- sured temperature of -27øC and an ozone mixing ratio of 5.75
ppmv (the average of the values measured by the two ozone in- struments) were used at the pressure level of 2.80 mbar for the
calculation. The calculated temporal variation of NO for three
values of the NO• mixing ratio (14.0, 14.5, and 15.0 ppbv) are
compared with the observed values in Figure 5. The calcu- lated NO concentration agrees with that observed to within 0.5 ppbv, or 5%. This agreement is quite good considering
the accuracy of the measurements and the fluctuation in the data. But when the comparison is examined in more detail, it
is noted that the observed rate of the increase in NO between
0530 and 0700 LT exceeds the calculated rate. However, in Figure 5 it can be seen that (1) the calculated initial buildup of NO at sunrise is the same for all three values of NON, (2)
the final phase of the initial increase agrees best with an NO N
concentration of 14.0 ppbv, and (3) the measured late morning
NO concentration agrees best with NO N - 15.0 ppbv. To compare in detail the first hour of increase in NO at the beginning of the morning, the calculated values of NO for
$ZA(deg) 49 39 3O 2• 21 JUNE 18, 1988 "'7h 8h 9h 10h ll h 12h UT 4O
Fig. 4. The same as Figure 2, but for the observation at 39
km on June 18, 1988.
[NON] = 14.5 ppbv were compared with the observations as a
function of solar zenith angle, as shown in Figure 6. In this figure it can be seen that agreement between the observed and calculated NO mixing ratio is noticeably improved by assuming
15 10 >. ._Q 0... O.. z5 c•8 SZFI(dea) 87 77 66 57 49 [ I [ I [ I I I [ I SEP. 1'7, 198'7 NO,,,=15.0 ppbv
•-14.0
=14.5 5h 6h 7h 8h 9h 1OhLOCFIL T I ME
Fig. 5. Comparison of measured (circles) and computed val- ues (solid lines) of the NO mixing ratio versus local time (LT) for the observations of September 17, 1987. Computed curves are for NO N values of 14.0 ppbv (bottom curve), 14.5 pp. (miaae pp. (op
KONDO RT AL.: NiTRiC OXIDE IN THE UPPER STRATOSPHERE 22,517 10 [ I • I , I , I [ I , I [ I I I [ I • I ] I I
0•(
STANDARD
, I • I , I [ I I I [ I I I [ I [ I [ I , I , 98 97 96 95 94 93 92 91 90 89 88 87 86$ZA(dec,)
Fig. 6. Comparison of measured values (circles) and com- puted curves (solid llne) of the NO mixing ratio near sunrise
on September 17, 1987, for SZA less than 86 ø. For the calcu- lation, an NOy mixing ratio of 14.5 ppbv was assumed. The thin curve resulted from using the ozone concentration mea- sured just before sunrise, and the thick curve resulted in an assumed average increase of 10% in the ozone concentration
or the equivalent through an increase in ks (see text).
an ozone concentration during the previous night 10% larger than that measured just before sunrise. The change in NO during this phase is due mostly to the photodissociation of NO2, as investigated in more detail below using the numerical model. There is remarkable agreement between observed and calculated values of NO during the rapid increase at SZAs
between 95 ø and 92 ø .
Since an assumed increase in the ozone concentration re-
suited in improved agreement in Figure 6, the effect of ozone on the form of the diurnal variation of NO is discussed below. The rate of increase in NO during the first few hours after sunrise depends significantly on the amount of N2Os present at that time. An augmented amount of N2Os would increase the rate at which NO builds up just after sunrise due to a re- duced NO= concentration and a larger production rate of
through the photodissociation of N2 Os. N2 Os is formed during
the night by reactions
NO2 + Os -• NOs + O2
NO2 + NOs + M -• N2Os + M The rate coefficient ks is
(RS)
ks - 1.4 x 10-XSezp(-2500/T)
crn
s s -x
where T is the temperature (øK) [JPL, 1987].
The sum of the NOs and N2Os concentrations during night-
time is governed by the following continuity equation [Flaud et al., 1983]:
[NOs]
+ [N2Os])
-
ks
[NO2]
[Os]
Consequently, the product ks[Os] is expected to influence
the diurnal variation after sunrise. Also it should be noted
that the values of ks and ozone concentration that control the
nighttime production rate of N2Os are not those that were measured during the early morning, but rather the values that prevailed from sunset on the previous day until sunrise. The uncertainties of the ozone mixing ratio and ks are summarized in Table 2. The temperature measurement at float altitude has an uncertainty of 2*K. The uncertainties of the temperature
of 1' and 2*K are reflected in the 4 and 9% uncertainties in ks. In addition, the uncertainty in the laboratory determina- tion of ks is 25% for a temperature of 250'K [JPL, 1987]. The
effect of the change in ozone on the diurnal variation of NO has been calculated and is shown in Figure 7 a. Improvement in the agreement between measured and calculated values of the NO concentration brought about by a 10% increase in the Os mixing ratio is seen mainly in the region of SZAs greater than 86 ø . The calculated diurnal variation of NO by using ks
TABLE 2. Uncertainties in ks[Os]
Uncertainty % [os] 10 = 9 ks(absolute) 25 15 10 > o o_ o_ •5 SZA(dea) 8 87 77 66 57 49 [ I [ I ' I [ I I I -
SEP.I?. 1987
-_ OaISTaNDaRD)
•
- [ I [ I [ I [ I [ I 5h 6h 7h 8h 9h 10h 11hLOCAL T I HE
Fig. 7a. The same as Figure 6 but for all of the NO obser- vations made at float altitude on September 17, 1987.
22,518 KONDO ET AL.: NZTRZC OXZI•E IN THE UPPER STRATOSPHERE
increased by 25% is shown in Figure 7b. In this calculation the NO N mixing ratio was assumed to be 14.7 ppbv, the value which provides the best overall agreement between calculated and measured NO values. It can be seen that the agreement between the observed and modeled NO variations becomes im- proved to some extent. Since an increase in ozone concentra- tion has similar effect to a corresponding increase in ks, a 10% increase in the ozone mixing ratio and 15% increase in ks will
have an effect similar to a 25% increase in ks alone.
98 15 10
SZI:::I[d
e g)
77 66 87 57 49 i I i I i I i I I I INoSEP.
17,
1987
".•t
5h 6h ?h 8h 9h 1Oh llhLOCRL T ! ME
Fig. 7b. The same as Figure 7a but for the computed curve
(solid line); a value of ks increased by 25% was assumed.
For this computation, an NO N mixing ratio of 14.7 ppbv was
assumed (see text). For comparison, the standard model
result is also shown.
The change in albedo can affect the NO mixing ratio through the change in the photodissociation rate of NO2. It was found that adoption of an albedo as large as 0.6 increases the NO
mixing ratio between 0900 and 1100 LT by about 0.5 ppbv
or 5%, while it causes little change in NO at hours earlier than 0730 LT. This effect increases the rate of change in NO and thus improves the agreement between the observation and the model. However, such a large albedo is quite unlikely on September 17, when a very light cloud cover was observed, as already discussed.
In summary, it can be said that the observed and modeled diurnal variations agree to within the uncertainties in the mea- surements of NO, ozone, and temperature and the value of ks. Next, the temporal variation of NO observed at 39 km from 0800 LT to noon on June 19, 1988, is compared with that cal- culated. The calculation was made for a pressure of 3.77 mbar,
which was the mean float pressure level. The measured ozone mixing ratio and the temperature at this altitude used in the calculation were 5.4 ppmv and - 14 o C. The calculated results
for [NON] -- 16.0, 16.5, and 17.0 ppbv are shown in Figure 8. It
can be seen that the calculated curves agree with the observed
NO concentration
for [NON] -- 16.5 ppbv within q-0.5 ppbv,
a value within the uncertainty of the NO measurements. The calculation predicts an NO increase of about 1 ppbv between 0800 and 1200 LT, in good agreement with the observations. The rate of NO increase after 0800 LT and the daytime NO mixing ratio are insensitive to change in the ozone concentra- tion of the order of 10%, as can be seen from the calculated curves in Figure 70. Therefore, for comparison of the calcu- lated and observed NO concentration during late morning on
June 18 the effect of the uncertainties discussed above for con- ditions at suI•ise (September 17, 1987, observations)is negli-
gible compared to the uncertainty in the NO measurements. The calculated temporal variation of NO, NO2, NOs, NOr
- NO + NO2 + NOs, N2Os, and HNOs species for [NON] =
16.5 ppbv at 39 km on June 18 are presented in Figure 9 to show the diurnal variation of the partitioning among the NO N family. It can be seen that the change in NO during the ftrst hour after suI•ise is caused mostly by the photodissociation
of NO2, since the mixing ratio of NO• (as deftned just above)
changes little during this period. It can also be seen that most of the photodissociation of N2Os occurs within 3 hours after su•ise. The rate of the increase in NO during this period is controlled by the rate of photodissociation of N2Os and the
slow shift in the NO/NO2 ratio due to the increase in
._Q 0_. Q. Z
SZI:::Ifd
e g )
53 42 32 24 2]. _ 0 I I i I I I I I , I I ?h 8h 9h tOh t! h t2hLOCFIL T I ME
Fig. 8. Comparison of the measured (circles) and computed values (solid lines) of the NO mixing ratio for the observa- tions of June 18, 1988. Computed curves are for NO N values of 16.0 ppb, (bottom curve), 16,5 ppb, (middle curve), and 17.0 ppbv (top curve).
KONDO ]IT AL.: N•T•UC OX!D]I IN TH]I UPP]IR STRATOSPHER]I 22,519 18 16 14 .o 12 o 10 m8
• 6
0 2 4 6 8 10 12 14 16 18 20 22 24LOCFIL TIME
Fig. 9. Computed diurnal variation of NO, NO2, NO3, NO,
= NO + NO2 + NO3, N2Os, and HNO3 for an NOy value
of 16.5 ppbv at 39 km on June 18 at 44øN.
with decreasing SZA. The HNO3 concentration varies little, as can be seen from the figure, and the C1ONO2 concentration is negligibly small at this altitude. This model shows that the daytime NO= concentration is very close to the total NOy concentration and that daytime NO accounts for 70% of NO•. NO•
As discussed above, the most probable values of the NO•
concentration at 40 km in September and 39 km in June are
14.5 ppbv and 16.5 ppbv, respectively. Previously, Kondo et
al. [1989b] reported an estimated NO• concentration of 14
ppbv at 26 km at 32øN in July 1987 from a similar comparison
of the observed and modeled diurnal variation of NO. The
NOy concentration at 32.5 km can also be derived from the
observed NO temporal variation at 44øN in October [Kondo et al., 1988]. However, their NO values at 32.5 km have been found to be overestimated by about 25% [Kondo et al., 1989b]. These revised NO values and the present model yield a derived
NO• mixing ratio of 18.5 ppbv at 32.5 kin. In estimating these values of the NO• mixing ratio from the measured NO diurnal
variation, uncertainties in the calculated [NO]/[NO•] ratio and
in the measured NO mixing ratio contribute to the errors. The
[NO]/[NO•] ratio is expressed as
[NO]/[NO,] = ([NO]/[NO.]). ([NO.]/[NO,]) - {1/(1 + [NO2]/[NO])}. ([NO.]/NO,])
• [NO•]/[NO] ,•io i• go•,.•a •y • •onowi.g •o•oc•m-
ical reactions: NO + O3 • NO2 + O2 (R7) NO + C10 • NO2 + C1 (R1) NO + HO2 • NO2 + OH (R8) NO2 + hv --+ NO +O NO2 + O --+ NO + O2 (R9) and is expressed as
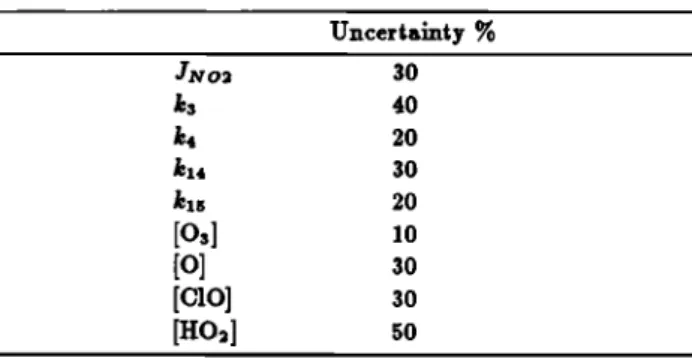
[NO2]/[NO] = (k,[O3] + k•[C10] + ks[HO2])/(ff•ro2 + The uncertainties in the reaction rate coefficients and ]N O2, given by JPL [1987], are shown in Table 3. Assumed values of the uncertainties in the calculated concentrations of O, C10,
and H O2 are also given in Table 3. The indicated uncertainty
in the ozone concentration is that associated with the ozone
measurement. The square root sum of the weighted uncer-
•i.•r o• •c• mm gi• •, •o• o• rs% •o• • [NO]/[NO•] mio, l•i.g •o •. •o• o• 2•% i. • [NO]/[NO4 •io.
jot species of NOy other than NO= are HNO3 and N2Os, as
indicated in Figure 9. Assuming 100% errors in estimating the co..c•..•io..• o• •o• •p•ci•. • [NO•]/[NO•] •io • •0
km at 0600 LT has an uncertainty of 11%, thus leading to an error of 30% in the estimate for NO•, including the 10% NO
measurement error. Similar estimates at 26 km and 32.5 km
have given uncertainties in NO• of 60% and 45%, respectively.
TABLE 3. Uncertainties in the Reaction Rate Coefficients and
the Concentration of the Related Species Calculated for 40 kin.
Uncertainty % ]NO2 30 k3 40 k4 20 kx4 30 kxs 20 [o•] •o [o] 30 [c•o] •o [HO2] 50
The NO• values discussed above are summarised in Table 4. In Figure 10 these calculated NO• mixing ratios are shown together with our directly measured NOy concentrations dur- ing ascent on June 18, 1988. NO• mixing ratios from the
Atmospheric Trace Molecule Spectroscopy (ATMOS) instru- ment [Russell et al., 1988] are also shown in Figure 10; the
measurements were made on board Spacelab 3 at 30øN and 48øS in May. The ATMOS instrument determined each major species of the NO• family by infrared absorption spectra mea- surements through the llmb of the Earth's atmosphere. The NO• mixing ratio measured by the ATMOS instrument near 40 km at 30øN and 48øS in May are listed in Table 5; the average of these values at 39.5 km is 15.8 4-0.9 ppbv. This value is in very good agreement with our average NO• value of 15.5 4-5.0 ppbv for September and June; our June value of 16.5 ppbv at 44øN is especially close to the ATMOS May value of 16.7 ppbv at 30øN. The estimated error of the ATMOS data
at 39.5 km is 13%. The agreement of our NOy values with the
ATMOS measurements indicates that the model of Pirre et •1.
[1989] presents a reasonable description of reactive nitrogen in
the upper stratosphere at mid-latitudes.
22,520 KONDO ET AL... NITRIC OXIDE IN THE UI•I•ER $TI•ATO$1•HERE
TABLE 4. Summary of the Derived NOy and N20• Mixing Ratio, and NOy/ozone
Ratio, and the Measured Os Mixing Ratio
Date Lat. Temp. A_lt. NO• N20• Os NO•/ozone øN øK km ppbv ppbv ppmv x 10 -s Sept. 17,1987 44 246 40.2 14.5 +4.3 1.2 +0.4 5.75 +0.3 2.52 +0.76 June 18, 1988 44 259 39.1 16.5 +5.0 1.6 +0.6 5.40 +0.3 3.06 +0.92 Oct. 4, 1985 44 227 32.5 18.5 +8.4 2.2 +1.2 7.0 +0.4 2.64 +1.19 July 29, 1987 32 225 26.0 14.0 +8.5 1.9 +1.2 6.4 +0.3 2.19 +1.34 40 30 20 -- I i i
ß Calculated from NO data
ß Measured June 18, 1985
o ATMOS data May 19 I ß
o ER-2 data
0 I IIøo
io
20
NO) (ppbv)
Fig. 10. Comparison of NO• mixing ratio values from several
sources. Solid circles are those obtained from the present NO observations (see Table 1), and the triangles are the
direct measurements during ascent on June 18, 1988. Open
circles are ATMOS data at 30øN in May [Ruzzell et al., 1988].
The large square labeled "ER 2 Data" indicates the range of values by D. M. Murphy et al. (unpublished manuscript,
1990).
ments at 26 km, but NO• values estimated from the NO obser-
vations (indirect values) at 32.5 and 26 km are 2-3 ppbv larger. None of these measurements were made simultaneously, so the
difference of 2-3 ppbv could be due to natural variability caused by dynamical transport.
In general, our direct NOy measurements agree with those of the ATMOS experiment, as can be seen in Figure 10, although
our values are somewhat smaller between 20 and 24 kin. In
the lower stratosphere, extensive observations of NO• with a chemiluminescence NO detector combined with a gold catalytic
converter have been made on board the ER 2 aircraft (D. M. Murphy et al., unpublished manuscript, 1990). In Figure 10
the range of values obtained at altitudes between 17 and 21 km and between latitudes 30 ø and 45øN is indicated as a large
TABLE 5. NO•, Mixing Ratio
Altitude Mixing Ratio ppbv
km 30øN 48øS
41.5 16.7 +2.3 12.9 +1.7
39.5 16.7 +2.2 14.9 +1.2
37.5 16.2 +2.1 16.3 +1.8
From Ruzzell et al., [1988].
square.
In the lower
stratosphere
our values
are in the range
of the ER 2 data but are somewhat lower than their average value.
NO• and ozone
mixing
ratios
have
been
found
to be corre-
lated quite well in the lower stratosphere
(D. M. MurphF
et
al., unpublished
manuscript,
1990). The variability
observed
in NO• or ozone
alone
is greatly
reduced
when
presented
as
the NOy/ozone
ratio. For this reason
the NO•/ozone
ratio can
be a more useful, and probably a more meaningful parameter for comparison with other measurements or numerical mod- 'els. The NO•/ozone ratios from our simultaneous measure-
ments of NO• and ozone are listed in Table 4 and are shown in Figure 11. As mentioned above, NO• was measured directly during ascent on June 18, 1988 between 12 and 28 krn. The observed NOy/ozone ratio in that altitude region has been pre- sented previously [Kondo et al., 1990]. Smoothed values of the NO•/ozone ratio for each 1 km in altitude are shown as trian- gles in this tigure. Above 25 km the NO•/ozone ratio ranges
between
2 and 3 times 10
-s. The NO•/ozone
ratio is observed
to increase slightly with altitude from 20 to 40 km.
N• O•
As can be seen from Figure 9, the calculated N20• concen- tration at 39 km at the end of the night on June 18 was 1.6 ppbv. Similarly, from the model run for September 17 the estimated N20• mixing ratio just prior to sunrise at 40 krn was 1.2 ppbv. The estimated uncertainty in the N20• mix- ing ratio is about +0.5 ppbv associated with uncertainties in
ozone, NO• and temperature. The N20• mixing ratio in June
at 39 km derived from the model is 30% larger than that in
September at 40 krn. The contribution of the June/September difference in the NOy mixing ratio to this 30% difference in the calculated N20• concentration is about 15%. The difference
in stratospheric temperature between June and September of
13øK causes a 70% difference in the value of k• and a 60% difference in the k•[Os] value, when the measured variation of [Os] is taken into account. This effect causes the additional 15% difference in the N20• concentration.
The NO• mixing ratios at 32.5 and 26 km have been esti-
mated so that the modeled diurnal variations of NO give the best tit to those observed. The N20• mixing ratios calculated by this model for these NO• values are 2.2 +1.2 ppbv and 1.9 +1.2 ppbv, respectively. These N20• values are listed in Table 4 and are shown in Figure 12. Measurements of strato-
KONDO ET AL.: NITRIC OXIDE IN THE UPPER STRATOSPHERE 22,521 40 • 30 E 20 IO I ß I -t I ß I J_ ß I I
ß Calculated from NO data
ß Measured June 18,1988
I I
2 3
NOy/OZONE
RATIO(x
I0
-3)
Fig. 11. Profile of the NOv/ozone ratio. Solid circles are the
values listed in Table 1. Triangles are from the measured values of NO v and ozone during ascent on June 18, 1988. See text.
spheric N2Os were first made by Roscoe [1982] with a pressure- modulated radiometer and were followed by the measurement of Evans [1986] with a cooled filter spectrometer. Ktmde et al. [1988] obtained the predawn N•.Os mixing ratio from 21 to 39 km from measurements of the N•.Os emission spectrum
on board a balloon at 32øN in September. Their values above 23 km are also shown in Figure 12, together with the ATMOS N•.Os data above 25 km at sunrise at 48øS in May. For the
ATMOS N,.Os data the revised values of Rinsland et al. [1989] are shown. The N•.Os mixing ratio of Ktmde et al. [1988] at
39 km is 1.3 4-0.7 ppbv, and the ATMOS value at 37.4 km is 1.32 4-0.34 ppbv. Those values agree quite well with the present N•. Os mixing ratio of 1.6 4-0.6 ppbv at 39 km and 1.2 4-0.4 ppbv at 40 k_m, an average mixing ratio of 1.4 4-0.6 ppbv.
It should be noted that our estimates of N•.Os in the upper
stratosphere have relatively smaller uncertainties than those
at altitudes of 26 and 32.5 km, as discussed above. Our value
at 32.5 km is about 0.7 ppbv larger than the values of Kunde
et al. [1988] and the ATMOS data, although the uncertainty
in the measurements results in overlap.
From infrared emission measurements, Blatherwick et [1989] obtained an N•.Os concentration of 1.26 ppbv at 30 km
in the early morning on July 5, at 32øN. However, due to the
difference in altitude, direct comparison of this value with our
estimate is difficult. At 26 km our value is again 1 ppbv larger than that of the ATMOS data, but in agreement with the mix-
ing ratio of 2.4 4.0.8 ppbv at 28 km by Kunde et al. [1988].
This disagreement can be partly explained by the difference in temperature. The average temperature at 26 km in May at 48øS is usually lower by about 12øK than in July at 30øN.
SUMMARY AND CONCLUSIONS
The temporal variation of nitric oxide during morning hours
__ _•:•__J_ --• about •n •___ W•L• j _• •O•T
t• and su•er. The NO ••g ratio was observed to
begin a rapid increase when the SZA reached 95 ø. This ini-
tial rapid increase in NO for SZA between 95 ø and 90 ø was found to agree quite well with a zero-dimensional photochemi-
cal model [Pirve et al., 1989] assuming a constant NO v mixing
ratio. This indicates that behavior of NO near sunrise can
be explained by a rapid increase in the photodissociation rate
of NO•.. The slower increase in NO that follows in the early
morning is also in agreement with the model calculation, al- though the observed rate of increase is somewhat larger than that calculated for the September observation. Later in the morning the agreement is better: the observed NO from 0800 LT to local noon in June showed an increase of about 1 ppbv, in excellent agreement with the model. The model indicates that this slow increase is caused mainly by the photodissocia-
tion of N•.Os and a slow increase in the NO/NO2 ratio. The
concentrations of NO v and N•.Os in the upper stratosphere have been estimated using the model and measured values of the NO mixing ratio. The NO v mixing ratio of 15.5 4-5.0 ppbv estimated for 39 and 40 km agrees quite well with the ATMOS
measurements [Rinsland et al., 1989]. The N•.Os mixing ratio
derived from the model, 1.4 4- 0.6 ppbv, is also in agreement
40- 35-
30-
2.5-
23
0 I ...: -- ;I ß Present work[] Kunde
et al,
r1988]
•, ATMOS data I ß I I 1:3, I I I I I I 2 3 4N205 (ppbv)
Fig. 12. Comparison of N•.O• mixing ratios. Solid circles are
our estimates given in Table 1. Triangles are the ATMOS
22,522 KONDO ET AL.: NITRIC OXIDE IN THE UPPER STRATOSPHERE
with the infrared measurements by Kunde et al. [1988] and with the ATMOS data [Rinzland et al., 1989].
In conclusion, it can be said that the present measurement of NO is in reasonable agreement with the photo chemical model. An observed increase in NO during the early morning hours is somewhat larger than that predicted. However, the differ- ences between the observed and predicted values are within the uncertainties in the measurements of NO, o•.one, and tem- perature, and in the reaction rate coefficient of RS. The and N205 mixing ratios, determined from the model using the present NO measurements, agree well with other recent obser- vations.
Acknowledgments. We wish to thank CNES for its excellent bal- loon operations and logistic support at Aire sur l'Adour and (3ap. The two balloon flights were supported by CNES with participation of Service d'A•ronomie, CNRS. S. Solomon generously provided the computed results of J•vo2 used in the present calculation. Thanks are due also to D. M. Murphy and D. W. Fahey, who kindly showed us their paper before publication. We wish to thank N. Toriyama, M. Kanada, H. Jindo, C. Bernard, and J. (3liberr for their techni- cal assistance in the preparation of the balloon-borne experiments. Y. K. acknowledges support by the Ministry of Education, Science and Culture. The work of W. R. S. and J. R. B. was supported in part by NASA (3rant NA(39-213 and by the Texas Higher Ed- ucation Coordinating Board. The calculations were made on the CIRCE at Orsay, France.
P•.EFERENCES
Aimedieu, P., Measurement of the vertical ozone distribution by means of an in situ gas phase chemiluminescence ozonometer during the intercomparison ozone campaign, (3AP, France, June 1981, Planet. Space Sci., 31, 743-749, 1983.
Aimedieu, P., and J. Barat, Instrument to measure stratospheric ozone with high resolution, Re•. Sci. Instrum., 54,432-437, 1981. Aimedieu, P., W. A. Matthews, W. Attmannspacher, R. Hartmanns-
grubeL J. Cisneros, W. Komhyr, and D. E. Robbins, Comparison of in situ stratospheric ozone measurements obtained during the MAP/(3LOBUS 1983 campaign, Planet. Space Sci., 35, 563-585, 1987.
Blatherwick, R. D., D. (3. Murcray, F. H. Murcray, F. J. Murcray, A. (3oldman, (3. A. Vanasse, S. T. Massie, and R. J. Cicerone, Infrared emission measurements of morning stratospheric N205, J. Geophys. Res., 94, 18337-18340, 1989.
BollingeL M. J., R. E. Sievers, D. W. Fahey, and F. C. Fehsenfeld, Conversion of nitrogen dioxide, nitric acid, and n-propyl nitrate to nitric oxide by gold-catalyzed reduction with carbon monoxide, Anal Chem., 55, 1980-1986, 1983.
Evans, W. F. J., Observation of the 8-/•m N205 thermal emission feature in the stratosphere, Appl. Opt., •5, 1866--1868, 1986. Fahey, D. W., C. S. Eubank, (3. Hfibler, and F. C. Fehsenfeld, Eval-
uation of a catalytic reduction technique for the measurement of total reactive odd-nitrogen NOy in the atmosphere, J. Atmos. Chern., $, 435-468, 1985.
Flaud, J.-M., C. Camy-Peyret, D. Cariolle, J. Laurent, and (3. M. Stokes, Daytime variation of atmospheric NO2 from ground- based infrared measurements, Geophys. Res. Left., 10, 1104- 1107, 1983.
Isaksen, I. S. A., and F. Stordal, Ozone perturbations by enhanced levels of CFCs, N20, and CH4: A two-dimensional diabatic cir- culation study including uncertainty estimates, J. Geophys. Res., 91, 5249-5263, 1986.
Jet Propulsion Laboratory, Chemical kinetics and photochemical data for use in stratospheric modeling, Report, Jet P•opulsion Lab., Pasadena, Calif., 87-41, 1987.
Kondo, Y., A. Iwata, M. Takagi, and W. A. Matthews, Balloon- borne chemiluminescent sonde for the measurement of tropo- spheric and stratospheric nitric oxide, Re•. Sci. Inst•um., 55, 1328-1332, 1984.
Kondo, Y., W. A. Matthews, A. Iwata, and M. Takagi, Measurement of nitric oxide from 7 to 32 km and its diurnal variation in the stratosphere, J. Geophys. Res., 90, 3813-3819, 1985.
Kondo, Y., W. A. Matthews, P. Aimedieu, and D. E. Robbins, Di-
urnal variation of nitric oxide at 32 km: Measurements and in- terpretation, J. Geophys. Res., 93, 2451-2460, 1988.
Kondo, Y., P. Aimedieu, W. A. Matthews, W. R. Sheldon, and J. R. Benbrook, Profiles of nitric oxide in the upper stratosphere, Geophys. Res. Left., 16, 1379-1382, 1989a.
Kondo, Y., A. Iwata, M. Pirre, R. Ramaroson, C. Delannoy, W. A. Matthews, M. Koike, and K. Suzuki, Diurnal variation of nitric oxide at 26 km, Geophys. Res. Left., 16, 867-870, 1989b. Kondo, Y., N. Toriyama, W. A. Matthews, and P. Aimedieu, Cali-
bration of the balloon-borne NO instrument, J. Geoma#n. Geo. elects., 41,507-523, 1989c.
Kondo, Y., P. Aimedieu, W. A. Matthews, W. R. Sheldon, and J. R. Benbrook, A mid-latitude balloon-borne observation of total odd nitrogen, Geophys. Res. Left., 17, 73-76, 1990.
Kunde, V. (3., J. C. Brasunas, W. C. Maguire, J. R. Herman, S. T. Massie, M. M. Abbas, L. W. Herath, and W. A. Shaffer, Mea- surement of nighttime stratospheric N2 O5 from infrared emission spectra, Geophys. Res. Left., 15, 1177-1188, 1988.
McElroy, M. B., and R. J. Salawitch, Changing composition of the global stratosphere, Science, •45, 763-770, 1989.
Pirre, M., R. Ramaroson, J.P. Naudet, and P. Rigaud, Altitude distribution of stratospheric NOz, 2, comparison of observation with model, J. Geophys. Res., 94, 6383-6388, 1989.
Ridley, B. A., and H. I. Schiff, Stratospheric odd nitrogen: Nitric oxide measurements at 32 ø N in autumn, J. Geophys. Res., 86, 3167-3172, 1981.
Ridley, B. A., M. McFarland, J. T. Bruin, H. I. Schiff, and J. C. McConnell, Sunrise measurements of stratospheric nitric oxide,
Can. J. Phys., 55, 212-221, 1977.
Rinsland, C. P., (3. T. Toon, C. B. Farmer, R. H. Norton, and J. S. Namkung, Stratospheric N205 profiles at sunrise and sunset from further analysis of the ATMOS/ Spacelab 3 solar spectra, J. Geophys. Res., 94, 18341-18349, 1989.
Robbins, D. E., Balloon in situ measurements of ozone with the NASA-JSC UV photometer, in Atmosphe•'ic Ozone, P•'oceedin#s of the Quad•'ennial Ozone Symposium, Halkidiki, G•'eece, edited by C. S. Zerolos and A. (3hazi, D. Reidel, Hingham, Mass., 460-
464, 1985.
Robbins, D., et al., Ozone measurements from the balloon intercom- parison campaign, J. Atmos. Chem., 10, 181-218, 1990. Roscoe, H. K., Tentative observations of stratospheric N205, Geo-
phys. Res. Left., 9, 901-902, 1982.
Roscoe, H. K., B. J. Kerridge, L. J. (3ray, R. J. Wells, and J. A. Pyle, Simultaneous measurements of stratospheric NO and NO2 and their comparison with model predictions, J. Geophys. Res., 91, 5404-5419, 1986.
Russell, J. M., III, C. B. Farmer, C. P. Rinsland, R. Zander, L. Froidevaux, (3. C. Toon, B. (3ao, J. Shaw, and M. (3unson, Mea- surements of odd nitrogen compounds in the stratosphere by the ATMOS experiment on Spacelab 3, J. Geophys. Res., 93, 1718- 1736, 1988.
Shimazaki, T., The photochemical time constants of minor con- stituents and their families in the middle atmosphere, J. Atmos. Te•. Phys., 46, 173-191, 1984.
Solomon, S., R. W. Sanders, M. A. Carroll, and A. L. Schmeltekopf, Visible and near-ultraviolet spectroscopy at McMurdo station, Antarctica, 5, Observation of the diurnal variations of BrO and OC10, J. Geophys. Res., 94, 11393-11403, 1989.
P. Aimedieu, Service d'A•ronomie, Centre National de la Recher- che Scientifique, P. O. Box 3, 91371 Verri•res-le-Buisson, CEDEX, France.
J. R. Benbrook and W. R. Sheldon, Department of Physics, Uni- versity of Houston, Houston, TX 77204-5504.
A. Iwata and Y. Kondo, Solar-Terrestrial Environment Labora- tory, Nagoya University, 3-13 Honohara, Toyokawa, 442, Japan.
W. A. Matthews, Department of Scientific and Industrial Re- search, Physical Sciences, Lauder 9182, Central Otago, New Zealand.
M. Pirre and T. C. Ramaroson, Laboratoire de Physique et Chimie de l'Environnement, Centre National de la Recherche Scientifique, 45071, Orleans, France.
(Received April 23, 1990; revised August 20, 1990; accepted September 6, 1990.)

![TABLE 2. Uncertainties in ks[Os]](https://thumb-eu.123doks.com/thumbv2/123doknet/14710835.567509/6.946.480.833.468.1088/table-uncertainties-in-ks-os.webp)