HAL Id: hal-00296458
https://hal.archives-ouvertes.fr/hal-00296458
Submitted on 26 Feb 2008
HAL is a multi-disciplinary open access
archive for the deposit and dissemination of
sci-entific research documents, whether they are
pub-lished or not. The documents may come from
teaching and research institutions in France or
abroad, or from public or private research centers.
L’archive ouverte pluridisciplinaire HAL, est
destinée au dépôt et à la diffusion de documents
scientifiques de niveau recherche, publiés ou non,
émanant des établissements d’enseignement et de
recherche français ou étrangers, des laboratoires
publics ou privés.
over Central Europe caused by dust emitted over the
southern Ukraine
W. Birmili, K. Schepanski, A. Ansmann, G. Spindler, I. Tegen, B. Wehner, A.
Nowak, E. Reimer, I. Mattis, K. Müller, et al.
To cite this version:
W. Birmili, K. Schepanski, A. Ansmann, G. Spindler, I. Tegen, et al.. A case of extreme particulate
matter concentrations over Central Europe caused by dust emitted over the southern Ukraine.
Atmo-spheric Chemistry and Physics, European Geosciences Union, 2008, 8 (4), pp.997-1016. �hal-00296458�
www.atmos-chem-phys.net/8/997/2008/
© Author(s) 2008. This work is distributed under the Creative Commons Attribution 3.0 License.
Chemistry
and Physics
A case of extreme particulate matter concentrations over Central
Europe caused by dust emitted over the southern Ukraine
W. Birmili1, K. Schepanski1,2, A. Ansmann1, G. Spindler1, I. Tegen1, B. Wehner1, A. Nowak1, E. Reimer3, I. Mattis1, K. M ¨uller1, E. Br ¨uggemann1, T. Gnauk1, H. Herrmann1, A. Wiedensohler1, D. Althausen1, A. Schladitz1, T. Tuch1,4, and G. L¨oschau5
1Leibniz Institute for Tropospheric Research, Leipzig, Germany 2Leibniz Institute of Marine Sciences, IFM-GEOMAR, Kiel, Germany 3Institut f¨ur Meteorologie, Freie Universit¨at Berlin, Germany
4Helmholtz Center for Environmental Research, Leipzig, Germany 5S¨achsisches Landesamt f¨ur Umwelt und Geologie, Dresden, Germany
Received: 12 July 2007 – Published in Atmos. Chem. Phys. Discuss.: 20 August 2007 Revised: 24 January 2008 – Accepted: 24 January 2008 – Published: 26 February 2008
Abstract. On 24 March 2007, an extraordinary dust plume was observed in the Central European troposphere. Satellite observations revealed its origins in a dust storm in Southern Ukraine, where large amounts of soil were resuspended from dried-out farmlands at wind gusts up to 30 m s−1. Along the pathway of the plume, maximum particulate matter (PM10) mass concentrations between 200 and 1400 µg m−3occurred in Slovakia, the Czech Republic, Poland, and Germany. Over Germany, the dust plume was characterised by a volume ex-tinction coefficient up to 400 Mm−1 and a particle optical depth of 0.71 at wavelength 0.532 µm. In-situ size distri-bution measurements as well as the wavelength dependence of light extinction from lidar and Sun photometer measure-ments confirmed the presence of a coarse particle mode with diameters around 2–3 µm. Chemical particle analyses sug-gested a fraction of 75% crustal material in daily average PM10and up to 85% in the coarser fraction PM10−2.5. Based on the particle characteristics as well as a lack of increased CO and CO2 levels, a significant impact of biomass burn-ing was ruled out. The reasons for the high particle con-centrations in the dust plume were twofold: First, dust was transported very rapidly into Central Europe in a boundary layer jet under dry conditions. Second, the dust plume was confined to a relatively stable boundary layer of 1.4–1.8 km height, and could therefore neither expand nor dilute effi-ciently. Our findings illustrate the capacity of combined in situ and remote sensing measurements to characterise
large-Correspondence to: W. Birmili
(birmili@tropos.de)
scale dust plumes with a variety of aerosol parameters. Al-though such plumes from Southern Eurasia seem to occur rather infrequently in Central Europe, its unexpected fea-tures highlights the need to improve the description of dust emission, transport and transformation processes needs, par-ticularly when facing the possible effects of further anthro-pogenic desertification and climate change.
1 Introduction
1.1 Wind-blown dust and climate
Wind-blown dust particles emitted from dry soil surfaces contribute considerably to the global aerosol mass and op-tical thickness, as well as to particle concentrations near the surface. With the exception of sea salt particles, soil dust contributes globally to the highest atmospheric mass load of all aerosol particle types (Textor et al., 2006). Dust particles are part of the coarse mode aerosol typically occurring in the super-µm size range (Haywood et al., 2001; Reid et al., 2003). Current estimates of annual global emission of dust particles that are available for long-range transport vary be-tween 1000 and 2000 Tg (Zender et al., 2004).
Frequent transport of dust plumes from the Sahara, the largest dust source worldwide, towards Europe can be ob-served frequently within the free troposphere (Ansmann et al., 2003; Barkan et al., 2005; Amiridis et al., 2005). Other sources of mineral dust aerosol include the Arabian Penin-sula, the Gobi and Taklamakan deserts in Asia, and the Aus-tralian and South American deserts (Prospero et al., 2002).
Atmospheric dust may affect regional climates directly and indirectly by influencing incoming and outgoing solar radi-ation, modifying cloud properties and precipitation forma-tion, and affecting chemical processes in the atmosphere. The direct radiative forcing at the top-of-atmosphere by the enhancement of dust aerosol from anthropogenic land use modifications is estimated to range between −0.3 W m−2and
+0.1 W m−2, assuming that 20% of the atmospheric dust originates from soil surfaces disturbed by anthropogenic ac-tivities like cultivation (Solomon et al., 2007). Radiative forcing by dust not only impacts the radiation balance of the Earth directly, but also influences the energy distribution within the atmosphere. As a consequence, the presence of dust may weaken the hydrological cycle (Miller et al., 2004). In addition to the direct radiative effect, aerosol particles also influence the formation and lifetimes of clouds, although the role of soil dust particles in these processes remains un-certain. The coating of dust by soluble species enhances their ability to form cloud condensation nuclei (CCN) (Wurzler et al., 2000), while uncoated dust particles can enhance the formation of ice clouds (Ansmann and M¨uller, 2005). Asian dust transported to areas affected by high levels of anthro-pogenic pollution is in particular impacting on atmospheric chemistry (Krueger et al., 2004; Wang et al., 2007) because sulfate and nitrate species efficiently react on the surface of the calcite-rich dust particles. Dust may also play an impor-tant role in ozone chemistry (Bonasoni et al., 2004). Changed meteorological conditions as consequence of climate change are expected to influence dust production and transport, with increasing atmospheric dust loads and radiative forcing in drier climates Woodward et al. (2005). The magnitudes of the radiative forcing (direct and indirect) by dust depend on mineralogical, chemical and optical particle properties as well as on the vertical extent of the dust plumes in the atmo-sphere (Sokolik et al., 2001; Satheesh and Moorthy, 2005). A significant uncertainty factor in quantifying dust fluxes is the lack of knowledge about emission potentials of different source areas Harrison et al. (2001).
Dust emissions are anticipated to change under changed climate conditions due to alterations in both natural vegeta-tion growth and cultivavegeta-tion patterns, as well as changes in transport pathways (Mahowald and Luo, 2003; Tegen et al., 2004; Woodward et al., 2005). Assessments of the role of dust in a different climates require the understanding of the controls on dust emission, including the role of changes in land use. Importantly, human activities can modify dust emissions from soils by changing the availability of fine par-ticles, e.g., through destruction of soil crusts and removal of vegetation in semi-arid regions. The total amount of soil dust emission from such anthropogenic influence are currently estimated to contribute up to 20% of the total dust emis-sions (Solomon et al., 2007). However, such estimates are highly uncertain, as there are currently no appropriate mea-surements for quantifying large-scale dust emission fluxes.
1.2 Dust activation
Unvegetated areas containing fine and loose sediments can be sources of dust particle emission when strong surface winds occur. The Sahara is the most important source for soil dust worldwide; it is estimated to be responsible for 50% or more of the global atmospheric dust load (Goudie and Middleton, 2001). Ground dusts are mainly emitted via the process of saltation (Gillette, 1978; Shao et al., 1993; Marticorena and Bergametti, 1995), where sand particles that are easily lifted from the surface impact on the ground. The release of ki-netic energy breaks the binding of finer soil particles like clay, which are then available for long-range transport. In some instances direct particle lifting has also been observed (Loosmore and Hunt, 2000), but this process is usually only of local importance. Generally, strong winds are required to initiate and sustain dust emission from soils. These are often related to convective systems or the passages of cold fronts (Pye, 1987; Shao, 2000). Dust injected into high atmospheric levels of up to several kilometers can be transported over hor-izontal distances of thousands of kilometers in strong wind systems (Alpert et al., 2004).
Dust emissions are particularly strong in areas that con-tain fine and loose sediments. A good agreement has been found between the maximum occurrence of dust over land surfaces observed by satellites and the location of enclosed topographic depressions where fine sediments may have ac-cumulated during the past (Prospero et al., 2002). The emis-sion strength in a potential source region depends on surface properties like the aerodynamic surface roughness length, as structural elements like rocks or vegetation increase the transport of wind energy to the surface, but also partly ab-sorb this energy, increasing the threshold wind friction veloc-ity required for dust emission (Marticorena and Bergametti, 1995). The presence of crusts can reduce dust emission from a soil surface (Belnap and Gillette, 1997). The loss of fine soil material by wind deflation can lead to a decrease of dust production from a specific area over time (Gillette and Chen, 2001). Surface disturbances as a consequence of cultivation of soils in dry regions may lead to enhanced dust emissions. In agricultural soils, particle mass fluxes depend on, among other parameters, soil wetness, plant growth, field size, and wind direction at field scales (Donk and Skidmore, 2003; Ha-gen, 2004).
1.3 Legal limit values for PM10
Since 2005, legal limit values apply to environmental par-ticulate matter (PM) within the European Community (Air Quality Framework Directive (96/62/EC) and First Air Qual-ity Daughter Directive (1999/30/EC)). Here, PM10 denotes the total mass concentration of suspended particles with aero-dynamic diameters smaller than 10 µm. In practice, ex-ceedances of the legal limit values, particularly the daily limit value of 50 µg m−3have occurred at air quality monitoring
stations in many EU member states frequently, and health scientists have called for a more serious consideration of ef-ficient abatement measures (Annesi-Maesano et al., 2007). The actual reasons for the PM10 exceedances are manifold, and may vary from region to region.
In the UK, which may be taken as representative for West-ern Europe, the advection of continental air masses as well as regional secondary aerosol formation seem to be responsi-ble for the majority of exceedances (Charron et al., 2007). In the metropolitan area of Berlin, Germany, 50% of the PM10 mass concentration is estimated to originate from regional and far-range transport rather than local sources (Lenschow et al., 2001). In arid regions like Spain, wind-blown dust – partially imported from Africa may have a major impact (Escudero et al., 2007). Not only desert dust from the Sa-hara but also dust particles blown off agricultural soils could contribute to particle concentrations. A synthesis of mea-surements from multiple stations found that mineral aerosol is the main component in the PM10−2.5aerosol fraction, but is only of minor importance in PM2.5 (Putaud et al., 2004). Agricultural dust is sometimes assumed to be responsible for the differences between measured and modelled PM10 con-centrations in urban areas because considerable portions of urban PM10may originate from far-range transport (Vautard et al., 2005).
Given the potential importance of soil dust aerosol for cli-mate and air quality assessments and the possibility that dust emissions will change in future climates, improvements of our knowledge of dust sources and fluxes are essential.
This paper describes an exceptional dust event that greatly enhanced particle concentrations across Central Europe. The observations strongly suggest that most of this dust origi-nated from a cultivated region within Europe. The body of observations provides a unique opportunity to characterise a case of anthropogenically induced soil dust emission and transport, which may ultimately help understanding of the changing role of soil dust aerosol under different climate con-ditions.
2 Measurement data and meteorological calculations
2.1 Satellite images
Due to the influence of dust particles on infrared (IR) radiation, airborne dust can be detected during day-time and night-time by brightness temperature difference (BTD) (Ackerman, 1997; Wald et al., 1998; Sokolik, 2002; Brind-ley and Russell, 2006; Merchant et al., 2006). Different ab-sorption and emission properties of dust and the Earth’s sur-face at different thermal wavelength bands causes the BTD to decrease in the presence of airborne dust. To detect air-borne dust by remote sensing, we use a dust index based on brightness temperature (BT) and BTD, converted from thermal IR radiances measured by the SEVIRI (Spinning
En-hanced Visible and InfraRed Imager) instrument on board the geostationary Meteosat Second Generation (MSG) satellite (Schmetz et al., 2002). The satellite is located at 3.5◦W over
the equator and has a horizontal resolution of 3 km at nadir and a time resolution of 15 min. The dust index is composed of the BTD at 12.0–10.8 µm and at 10.8–8.7 µm, as well as of the BT at 10.8 µm (Schepanski et al., 2007). It is based on the same BTs as EUMETSAT’s dust index product of MSG scenes offered on its website (http://www.eumetsat.int).
In an alternative approach, mobilised dust can be iden-tified in Moderate-resolution Imaging Spectroradiometer (MODIS) 721-composite pictures, using the near infrared (2.155 µm) and two shortwave (0.876 µm, 0.670 µm) wave-length bands. The MODIS instrument flies on board of two polar-orbiting satellites, Terra and Aqua. True colour and composite pictures are available on the MODIS web site (http://rapidfire.sci.gsfc.nasa.gov/subsets, as of 11 June 2007) at 1 km, 500 m and 250 m horizontal resolution for predefined subsets. Here we use part of the Europe 2 04 Subset with a horizontal resolution of 250 m, imaged by the Earth Observing System (EOS) Aqua satellite on March 23 at 10:50 UTC. Due to its high reflectivity in the near infrared wavelength band (2–155 µm) and its absorbent behaviour in the 0.670 and 0.876 µm wavelength bands, vegetation ap-pears green in the composite picture. Bare soil causes a high reflectivity in all wavelength bands, especially in the 2.155 µm wavelength band, so they can be identified by a brownish colour.
2.2 Lidar and Sun photometer observations
A low-cost, small and compact, semi-automated Raman lidar routinely monitors the troposphere over Leipzig (Althausen et al., 2004). For day-time periods, the vertical profile of the particle extinction coefficient is determined at 0.532 µm wavelength from the elastically backscattered aerosol sig-nal. The extinction profile can be retrieved in a well-mixed boundary layer if a Sun photometer measurement of the to-tal aerosol optical depth is available (Ansmann and M¨uller, 2005), as is the case here. Due to the incomplete overlap of the laser beam with the receiver field of view, the retrieval of the profile is generally restricted to heights above about 400 m.
Leipzig is also an Aerosol Robotic Network (AERONET) site (Holben et al., 1998). The Leipzig Sun photometer mea-sures the aerosol optical depth (AOD) at the 8 wavelengths 0.340, 0.380, 0.440, 0.500, 0.675, 0.870, 1.02, and 1.64 µm. Measurements are made during day-time in 15 min intervals, as long as the Sun is not obscured by clouds. The Leipzig Sun photometer has been calibrated at least every two years with its latest calibration dating from autumn 2006. The measurement uncertainty of AOD is 0.02 at 0.340 µm and 0.005–0.01 at greater wavelengths. AERONET data can be accessed through its corresponding website (http://aeronet. gsfc.nasa.gov).
Table 1. Government institutions who supplied PM10network data to this study. The two last columns indicate the total number of PM10 observation sites as well as the number of sites where the dust plume could actually be detected.
Data originator No. of observations:
total with dust plume
– Cesk´y hydrometeorologick´y ´ustav (Czech Hydrometeorological Institute, Prague, Czech Republic) 74 73
– Slovensk´y hydrometeorologick´y ´ustav (Slovakian Hydrometeorological Institute, Bratislava, Slovakia) 25 23
– Wojew´odzki Inspektorat Ochrony ´Srodowiska we Wrocławiu (Environmental inspectorate for Lower Silesia in Wrocław, Poland)
49 43
– ¨Osterreichisches Umweltbundesamt (Austrian federal environment agency, Vienna, Austria) 101 4
– Umweltbundesamt (German federal environment agency, Dessau, Germany 4 4
– S¨achsisches Landesamt f¨ur Umwelt und Geologie (Saxonian Office for the environment and geology, Dres-den)
24 24
– Th¨uringer Landesanstalt f¨ur Umwelt und Geologie (Office for the environment and geology in Thuringia, Erfurt, Germany)
21 21
– Landesamt f¨ur Umweltschutz Sachsen-Anhalt (Office for environmental protection in Saxony-Anhalt, Magde-burg, Germany)
20 20
– Ministerium f¨ur l¨andliche Entwicklung, Umwelt und Verbraucherschutz Brandenburg (Department for rural affairs, the environment, and customer protection in Brandenburg, Potsdam, Germany)
22 22
– Lufthygienisches ¨Uberwachungssystem Niedersachsen (Air quality monitoring system in Lower Saxony,
Hanover, Germany)
30 29
– Bayerisches Landesamt f¨ur Umwelt (Bavarian office for the environment, Augsburg, Germany) 51 25
– Hessisches Landesamt f¨ur Umwelt und Geologie (Office for the environment and geology in Hassia, Wies-baden, Germany)
20 17
– Bremer Senator f¨ur Bau, Umwelt und Verkehr (Senator for construction, the environment, and traffic in Bremen, Germany)
8 8
– Landesamt f¨ur Umwelt, Naturschutz und Geologie Mecklenburg-Vorpommern (Office for the environment, the protection of nature and geology Mecklenburg-Vorpommern, Schwerin, Germany)
10 10
– Ministerium f¨ur Landwirtschaft, Umwelt und l¨andliche R¨aume des Landes Schleswig-Holstein (Ministry for agriculture, the environment and rural areas Schleswig-Holstein, Kiel, Germany)
4 4
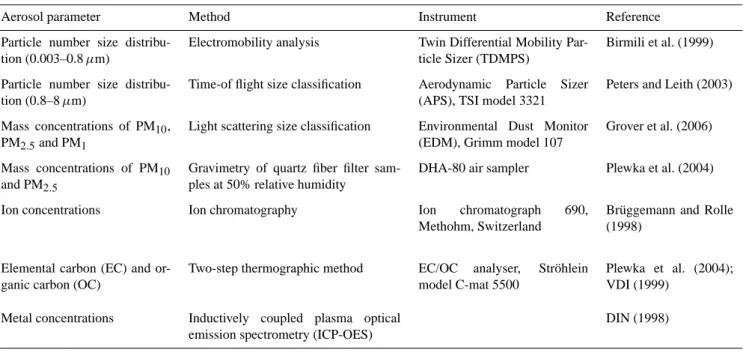
Table 2. In situ measurements used to characterise the dust plume: Parameters, methods and instruments.
Aerosol parameter Method Instrument Reference
Particle number size distribu-tion (0.003–0.8 µm)
Electromobility analysis Twin Differential Mobility
Par-ticle Sizer (TDMPS)
Birmili et al. (1999)
Particle number size distribu-tion (0.8–8 µm)
Time-of flight size classification Aerodynamic Particle Sizer
(APS), TSI model 3321
Peters and Leith (2003)
Mass concentrations of PM10,
PM2.5and PM1
Light scattering size classification Environmental Dust Monitor
(EDM), Grimm model 107
Grover et al. (2006)
Mass concentrations of PM10
and PM2.5
Gravimetry of quartz fiber filter sam-ples at 50% relative humidity
DHA-80 air sampler Plewka et al. (2004)
Ion concentrations Ion chromatography Ion chromatograph 690,
Methohm, Switzerland
Br¨uggemann and Rolle (1998)
Elemental carbon (EC) and or-ganic carbon (OC)
Two-step thermographic method EC/OC analyser, Str¨ohlein
model C-mat 5500
Plewka et al. (2004); VDI (1999)
Metal concentrations Inductively coupled plasma optical
emission spectrometry (ICP-OES)
2.3 PM10network observations
PM10 mass concentrations are monitored on a routine basis in every member state of the European Union. For this paper we evaluated time series from more than 360 governmen-tal air pollution monitoring stations in Slovakia, the Czech Republic, Austria, Poland, and Germany. Most data were available at a time resolution of 30 min and measured by ei-ther the Tempered Oscillating Microbalance (TEOM) (Allen et al., 1997), or beta-gauge attenuation (Macias and Husar, 1976). Table 1 lists the government institutions that supplied data as well as the number of sites in each network.
2.4 In situ measurements in Saxony
In-situ measurements of atmospheric aerosols were con-ducted during the dust episode at a number of measure-ment sites in Saxony, Germany. The most comprehensive set of measurements was carried out at the atmospheric re-search station Melpitz (51.2◦N, 12.9◦E), where atmospheric aerosols have been extensively characterised since 1996 (Bir-mili et al., 2001; Neus¨uss et al., 2002; Spindler et al., 2004; Engler et al., 2007). The suite of measurements and chemical particle analyses is summarised in Table 2.
Particle size distributions from the twin differential mobil-ity particle sizer (TDMPS) and the aerodynamic particle sizer (APS) were combined to obtain a complete particle spec-trum between 0.003 and 8 µm. Details of the evaluation can be found in the Appendix. Particle mass concentrations of PM10, PM2.5and PM1were determined using a Grimm Envi-ronmental Dust Monitor (EDM, model 107, Grimm GmbH, Ainring, Germany). As the response of the EDM is a func-tion of the particle refractive index, we are aware of possi-ble deviations from the true gravimetric mass in the case of strongly absorbing aerosols. The EDM was equipped with a heated inlet that allows to remove highly volatile particle material at 50◦C.
Particle number size distributions up to 0.8 µm were also recorded at two other sites in Saxony, Niesky (51.3◦N, 14.8◦E) and Schwartenberg (50.7◦N, 13.5◦E) using differ-ential mobility particle sizers. Table 2 also lists the meth-ods of chemical analysis that were performed for samples collected at Melpitz, Niesky, Schwartenberg, as well as Dresden-Nord and Dresden-Herzogingarten (both 51.0◦N, 13.7◦E). Here, aerosol particles were collected using PM10 and PM2.5high volume filter samplers over 24 h on 150 mm quartz fibre filters (MK 360, Munktell Filter AG, Falun, Swe-den). After equilibration at 50% relative humidity the filters were weighed and divided for the different subsequent anal-yses as described in Plewka et al. (2004).
Fig. 1. Dust source activation on 23 March 11:00 UTC over the
southern Ukraine (arrow). The image shows MSG dust index im-ages, based on BTD using the 8.7 µm, 10.8 µm and 12.0 µm wave-length bands of the SEVIRI instrument.
3 The Ukrainian dust plume
3.1 Satellite images
Due to its high spatio-temporal resolution the SEVIRI instru-ment is an accurate tool to track dust source activation and transport. Figure 1 shows SEVIRI’s MSG dust index image on 23 March 2007, 11:00 UTC and reveals a strong event of dust emission over the Southern Ukraine, indicated by ma-genta colour. Due to continuing high wind speeds, even a second event of dust source activation (not shown) could be detected on the following day. As will be shown below, the area of dust emission was located exactly on a pathway that leads the air mass to Central Europe.
The source region can be seen at higher resolution in the MODIS Aqua composite picture in Fig. 2. This image dis-plays shows the southern and eastern area of the Kahkova Reservoir and illustrates dust emission occurring over an area of approximately 20 000 km2. Brown stripes of dust can be seen over the blue-black colour of the reservoir, indicating dust mobilised from agricultural soil. In fact, the composite picture is not very sensitive for airborne dust but the colour of the dust plume can be seen to agree with that of the surface, which is mostly agricultural soil. Southern Ukraine is known for its fertile black earth (Chernozem), which has been in-tensively used for agriculture in the past and can, to date, be classified as erodible soil.
Fig. 2. The MODIS-Aqua composite image of Southern Ukraine on 23 March 2007, 10:50 UTC reveals the large scale emission of agricultural dust. The reservoir lake of Kakhovskaya on the Dnieper River can be seen in dark blue, ice clouds in light blue. Red boxes indicates thermal anomalies, caused in most cases by fire or even flares from a gas well. The dimensions of the area shown is 210×146 km.
On 23 March, meteorological observations in the south-ern and eastsouth-ern area around the Kahkova Reservoir report average wind speeds up to 15 m s−1 and wind gusts up to 25 m s−1and confirm “observations of atmospheric dust”. It is likely that these unusually high surface wind speeds in combination with a preceding drought period of two weeks as well as the lack of vegetation in March led to the high dust emission rates. Interestingly, the dust emission and transport can be seen to take place along lengthy filaments, located be-tween 1.5 and 3 km apart (Fig. 2). A speculative explanation for these filaments is that the sources are small areas, i.e. in-dividual fields are emitting dust particles, while others do not – depending on orientation, crop growth, or similar factors. In this case the filaments observed in the satellite retrievals would be just plumes from localized emissions, which do not rapidly mix because of the high wind speeds.
3.2 Synoptic situation
On 23 and 24 March 2007 the synoptic situation over Eu-rope was governed by a high-low dipole pattern due to a low pressure area over the Mediterranean Sea and a high
pres-sure region built up by a permanent anticyclone located over Fennoscandinavia and an anticyclone located over South Russia (Fig. 3). The eastward moving Mediterranean de-pression on the one side and the persistent high pressure area on the other side forced an increasing pressure gradi-ent over the Black Sea and Southern Ukraine, generating a low-level jet into Central Europe. High surface wind speeds prevailed over the southern Ukraine on 23 March, continu-ing until 25 March. The low-level jet effected the transport of a dry and subsiding air from the Black Sea area to Central Europe along a narrow corridor: Starting on 23 March over the Ukraine, the air mass was transported across Slovakia, Poland, the Czech Republic, and reaches Germany on 24 March. The transect was characterised by high wind speeds of more than 15 m s−1and low relative humidities.
3.3 Back trajectories
The exact pathway of the air mass arriving in Central Europe was verified through 3-D backward trajectory computations. For the second half of March 2007 backward trajectories were calculated by fine mesh analysis (Reimer and Scherer,
March 23, 12:00 UTC
March 24, 12:00 UTC
Fig. 3. Charts of sealevel pressure (hPa) and horizontal surface
wind speeds in Beaufort (colour code) on 23 and 24 March 2007, 12:00 UTC respectively. The charts were produced using the MM5 model and selected from the EURAD products offered by the University of Cologne, Germany (http://www.eurad.uni-koeln.de). Squares indicate the source region of the dust plume (magenta) and the region of the key measurements in Saxony, Germany (red).
1992), starting at 20 receptor locations in Germany at a 10-min frequency. For each site three types of trajectories
(a)
(b)
Fig. 4. Superposition of back trajectories originating on 24 March
2007 at 20 receptor sites in Germany. Colour coding indicates (a) date and (b) height above the ground.
were calculated: One driven by the 3-D wind field only, and two more with constant sedimentation velocities of 0.5 and 1.0 mm s−1. The two sedimentation velocities were intended to simulate gravitational settling of coarse particles and cor-respond to dust particle diameters of 2.8 and 4.0 µm, respec-tively. The bundles of back trajectories arriving in Germany are shown in Fig. 4. In close analogy to Fig. 3 the trajectory model predicts a strongly channelled flow from the region of the Caspian Sea over Ukraine towards Central Europe. Air from the northern shore of the Black Sea is predicted to reach Germany within only 18 to 24 h (Fig. 4a). The boundary layer jet can best seen in yellow colour in Fig. 4b, illustrat-ing that between the Ukraine and Germany the trajectories moved within the boundary layer mostly at heights below 1.2 km.
81 82 83 84 0 200 400 600 800 1000 1200 1400 25/03/07 24/03/07 23/03/07 PM1 0 i n µ g m -3 D Dresden D Leipzig D Meiningen D Fulda D Erlangen CZ Praha CZ Cheb CZ Chomutov CZ Teplice CZ Zlín SK Bratislava SK Košice SK Ružomberok PL Katowice PL Nowy Sacz
Fig. 5. Time series of PM10mass concentrations at a number of selected air quality monitoring stations in Slovakia, the Czech Re-public, Poland, and Germany. The data show the singular and short-lived nature of the dust plume as measured across the networks of stations.
4 Aerosol measurements in Central Europe
4.1 PM10network observations 4.1.1 Time series of PM10
Exceptionally high concentrations of airborne particles were observed on 24 March 2007 at numerous air pollution moni-toring stations in Slovakia, the Czech republic, Poland, Aus-tria and Germany. Figure 5 illustrates the time series of PM10 at a number of selected monitoring stations: The dust plume can be detected in the time histories of all monitoring stations as a clear, outstanding peak. Before the arrival of the dust plume, the concentrations were below 50 µg m−3at most sta-tions. The first station to detect the dust event in the late evening of 23 March was Koˇsice in Eastern Slovakia (48.7◦
N, 21.2◦E), where PM10 concentrations increased dramati-cally within a matter of two hours (Fig. 5). During the entire day of 24 March, the plume was transported in westerly di-rection, traversing Central Europe within a confined band. PM10concentrations rose to 1400 µg m−3in Slovakia in the morning of 24 March, and up to 640 µg m−3 in Germany during mid-day.
4.1.2 Geographic mapping of the dust event
Figure 6 shows the map of peak PM10mass concentrations during the dust event, generated from observational data at a total number of about 360 monitoring stations (cf. Ta-ble 1). The PM10 time series at all monitoring stations tra-versed by the dust cloud showed a pronounced maximum, and were similar in shape to those shown in Fig. 5. In order to simplify the amount of data, all individual time series were
parametrised by Gaussian model curves, thereby yielding the peak value of PM10 concentration as well as the time of its occurrence.
The advancement of the dust cloud across Central Europe is visualised in Fig. 6. Shown are the frontal lines that indi-cate the temporal evolution of the dust cloud as well as the peak PM10concentrations occurring along the pathway. Re-markably, the highest PM10concentrations occurred in Slo-vakia and the Małopolskie voivodeship1in Poland, which are the areas the closest to the source region in Ukraine. The other most affected areas include the Czech Republic and Saxony in Germany. It can be seen that the dust cloud moved faster across the south of Poland than across the Czech Re-public. Two reasons are responsible for this, the flatter ter-rain in Poland and the decrease of the wind speed towards the south, where the centre of the low pressure system resides.
After passing over Germany, the dust cloud reached the North Sea in the afternoon of 24 March. Traces of the dust plume could still be detected over South England, as indi-cated by UK Automatic Particulate Monitoring Network data (not shown). A time lag analysis of the multiple station data suggests that the air mass was moving at relatively constant speeds around 20 m s−1across Central Europe.
Towards its southern edge, the dust plume could be de-limited accurately because of a relatively dense coverage of Austria and Germany with PM10 data. Meteorological ob-servations reported a band of rainfall (daily sum: 5–8 mm) to the southern edge of the dust cloud, which is the main rea-son why dust particles did not penetrate further south. The eastern and northern edge of the dust cloud could not be de-fined with the same accuracy because of the unavailability of PM10observations for the Ukraine and some voivodeships of Poland.
4.1.3 Estimation of the total amount of dust
The PM10mass concentration data was used to full capacity when estimating the total mass of particles present in the dust plume. Such an estimate will be the most accurate when ex-amining the measurements close to source; we accordingly analysed PM10 time series from sites in the vicinity of the 04:00 CET frontal line of Fig. 6. Close to this frontal line lie, from north to south, the monitoring stations Tarn´ow and Nowy Sacz in Poland, and Preˇsov, Krompachy, Koˇsice, and Velk´a Ida in Slovakia.
The transversal dimension of the dust plume was derived from Fig. 6. To determine the longitudinal dimension of the dust cloud, the flow field of the plume was split into volume elements passing across each of the six sites men-tioned above. The speed of the air mass was determined individually for each volume element using the time lag of PM10 observations along the longitudinal axis. From this, time series of PM10 as a function of longitude could
M N
S L D
Fig. 6. Spatio-temporal evolution of the dust plume in Central Europe on 24 March 2007. The map is based on time series of PM10mass concentration at over 360 government monitoring stations in Slovakia, the Czech Republic, Austria, Poland, and Germany. Labelled frontal
lines indicate where the peak values of PM10occurred simultaneously. The peak PM10concentration is coded in colour. The dust plume is
delimited in grey if well supported by the observational data. Additional markers indicate the measurement sites Leipzig (L), Melpitz (M), Niesky (N), Schwartenberg (S) and Dresden (D). Dashed isolines are extrapolations along backtrajectories over areas of missing data. be constructed. The vertical dimension of the of the dust
cloud was estimated from radiosoundings (Source: Univer-sity of Wyoming, http://weather.uwyo.edu/upperair/). The vertical profiles of the virtual potential temperature sug-gested a boundary layer height of 1.2 km (uncertainty range 1.0–1.4 km) at Poprad-Ganovce in Slovakia, and 1.4 km (range 1.0–1.6 km) at Wrocław in Poland. These values were found to be in relatively good agreement with boundary layer heights determined further downwind at Prague in the Czech Republic and Lindenberg in Germany. An additional neces-sary assumption was that the particles were distributed ho-mogeneously within the boundary layer, but this was sup-ported by the lidar observations over Leipzig (Sect. 4.3). An integration over the entire concentration field yielded an ap-proximation for the total dust mass in the atmosphere.
Our calculation yielded a total dust mass of 60 Gg (±20 Gg) in the plume at 04:00 CET. Due to the upper size cut involved in PM10sampling, this figure includes only par-ticles smaller than 10 µm aerodynamic diameter. The mass of the totally suspended dust may have accordingly been higher.
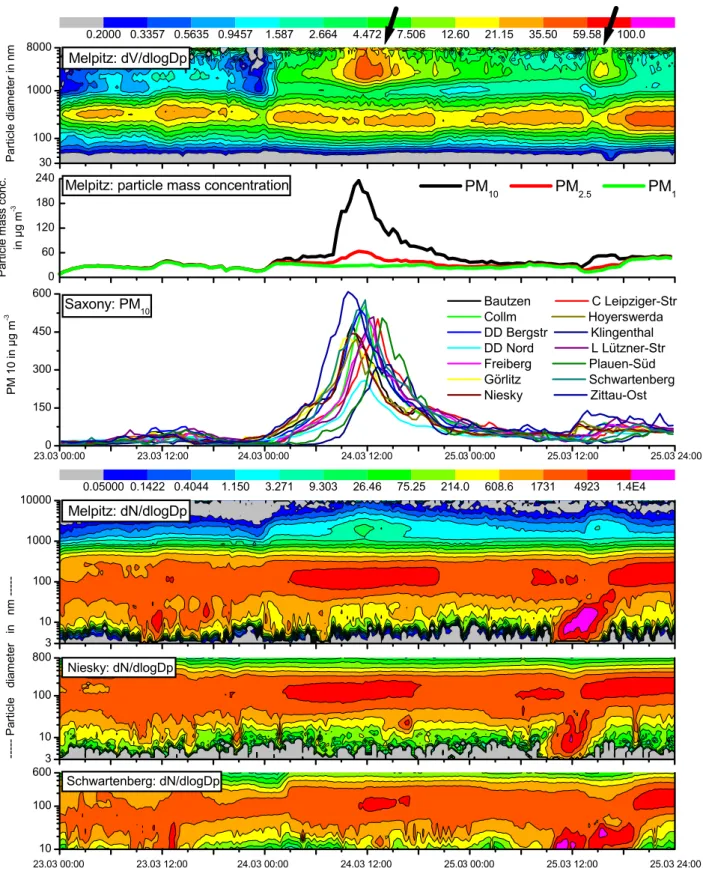
4.2 Aerosol characteristics in Saxony
Figure 7 compiles particle size distributions (0.003–8 µm) as well as mass concentrations measured in Saxony before, during, and after the advection of the dust plume from South-ern Ukraine. The particle volume size distribution in the top graph reveals the presence of a pronounced coarse particle mode, separated from the fine mode by a concentration min-imum around 1 µm. Featuring an early concentration rise at 00:00 CET, the coarse mode attained its maximum concen-tration in Melpitz at around 11:00 CET, and across Saxony between 09:30 and 14:00 CET. Quite obviously, the coarse particle concentration changes independently from the fine particles. During its time of maximum concentration the coarse mode was characterised by a count median diameter around 2 µm and a volume median diameter of about 3 µm. In the afternoon, the coarse mode concentration decreased to its former level.
The size-fractionated mass concentrations (Fig. 7, lower top graph) confirm that the mass concentration of PM10 is almost entirely dominated by the coarser fraction. PM1,
10 100 600 23.03 00:00 23.03 12:00 24.03 00:00 24.03 12:00 25.03 00:00 25.03 12:00 25.03 24:00 3 10 100 800 3 10 100 1000 10000 Schwartenberg: dN/dlogDp Niesky: dN/dlogDp Melpitz: dN/dlogDp 23.03 00:00 23.03 12:00 24.03 00:00 24.03 12:00 25.03 00:00 25.03 12:00 25.03 24:00 0.05000 0.1422 0.4044 1.150 3.271 9.303 26.46 75.25 214.0 608.6 1731 4923 1.4E4 0 150 300 450 600 Saxony: PM 10 Bautzen C Leipziger-Str Collm Hoyerswerda DD Bergstr Klingenthal DD Nord L Lützner-Str Freiberg Plauen-Süd Görlitz Schwartenberg Niesky Zittau-Ost 0 60 120 180 240
Melpitz: particle mass concentration
--- P a rt ic le d ia m e te r in n m -PM 1 0 i n µ g m -3 P a rt ic le m a s s c o n c . in µ g m -3 P a rt ic le d ia m e te r in n m PM10 PM2.5 PM1 30 100 1000 8000 Melpitz: dV/dlogDp 0.2000 0.3357 0.5635 0.9457 1.587 2.664 4.472 7.506 12.60 21.15 35.50 59.58 100.0
Fig. 7. In situ aerosol observations in Saxony, Germany, between 23 and 25 March 2007. High coarse particle concentrations are indicated by
arrows. Top graph: Particle volume size distribution measured by TDMPS and APS at Melpitz. Lower top graph: Particle mass concentration
measured by the Grimm EDM. Third graph: PM10mass concentration at 14 monitoring stations measured by TEOM. Bottom graphs: Particle
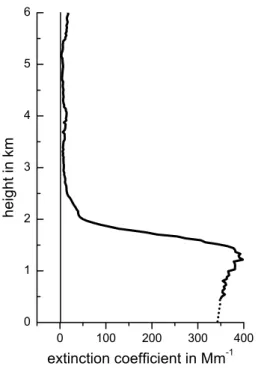
0 100 200 300 400 0 1 2 3 4 5 6 h e ig h t in km extinction coefficient in Mm-1
Fig. 8. Vertical profile of the volume extinction coefficient of the
aerosol as retrieved from Lidar observations at 0.532 µm wave-length at Leipzig, on 24 March 2007, 12:33–13:44 UTC. The height of the dust layer was about 1800 m. The free troposphere was al-most deplete of aerosol and clouds during the observation period. Below 500 m the profile was extrapolated towards the ground.
which represents the fine mode, remains practically constant throughout March 24, and PM2.5shows a diurnal variation by a factor of two. During the main dust event PM10is made up to 75% by the coarse fraction PM10−2.5. Time series of PM10 mass concentrations in Fig. 7 (centre graph) indicates a sim-ilar spatial homogeneity of their peak concentrations across 14 measurement sites in Saxony.Simultaneous particle num-ber size distribution measurements at three observation sites across Saxony (Fig. 7, bottom graph) demonstrate a homoge-neously distributed accumulation mode (count mean diame-ters around 100 nm) across a few hundred kilometres. The spatial homogeneity of the air mass could also be confirmed by meteorological and gas phase chemical parameters (not shown). The relative humidity was 40–50% around mid-day, emphasizing that the air inside the boundary layer jet was dry in comparison to the centre of the low pressure system. The low relative humidities imply that the optical observations in Sect. 4.3 refer to an overwhelmingly dry aerosol.
It is of a certain interest that one day later (25 March, 14:00 CET) a second, albeit less pronounced maximum of coarse particle concentration occurred. This second event was associated with high concentrations of particles <40 nm as well as temporarily reduced concentrations of the accu-mulation mode. A decrease in the accuaccu-mulation mode in the middle of the day can be indicative of vertical mixing with air from aloft. The observation therefore suggests that
200 400 600 800 1000 1200 1400 1600 1800 0.2 0.3 0.4 0.5 0.6 0.7 0.8 0.9 o p ti ca l d e p th wavelength in nm
Leipzig, March 24, 2007, 12:47 UTC Saharan dust, Ouarzazate, May 15, 2006 Saharan dust, Leipzig, Oct 14, 2001
Fig. 9. Aerosol optical depth as a function of wavelength as
re-trieved from the Leipzig AERONET Sun photometer. The data from 24 March 2007 are complemented by two cases featuring Sa-haran dust aerosol: Ouarzazate, Southern Morocco, on 15 May 2006, 06:41–08:31 UTC, and Leipzig, 14 October 2001, 10:42– 11:42 UTC. All measurements were performed using the same Sun photometer.
the coarse mode particles could be mixed down from a re-motely transported layer aloft. The formation of the new ultrafine particles <40 nm at all sites could likewise be as-sociated to this mixing process, as this process tends to bring about favourable conditions for the formation of new parti-cles (Nilsson et al., 2001).
4.3 Lidar and Sun photometer observations
Figure 8 shows lidar observations that were recorded during the time of maximum dust concentration at Leipzig (“L” in Fig. 6). The vertical profile of the volume extinction coeffi-cient suggests that the aerosol plume arriving on 24 March in Central Europe was confined to the lowest two kilome-ters of the troposphere. On 24 March, no lofted aerosol layers could be detected in the free troposphere, neither in the morning nor the early afternoon. Apparently, the aerosol layer originating from the northern shore of the Black Sea be-came well mixed during the long-range transport with strong winds. The lidar observations revealed a high aerosol optical depth (AOD) of 0.65 and high extinction coefficients of 300 to 400 M m−1at 0.532 µm throughout the dust layer in the early afternoon of 24 March 2007. The typical background values at Leipzig are substantially lower, around 0.1 and 80– 90 M m−1, respectively (Mattis et al., 2004).
At 13:02 UTC the AERONET Sun photometer measured an AOD of 0.71 at 0.500 µm at the station Leipzig (see Fig. 9). An ˚Angstr¨om exponent, which is an indicator of relative particle size ( ˚Angstr¨om, 1961), was derived by fit-ting all optical depths across the wavelength interval 0.440– 0.870 µm. The resulting ˚Angstr¨om exponent of 0.46 is in
0 50 100 150 200 250 300 25.3.2007 24.3.2007 23.3.2007 M a ss co n c . in µ g m -3 PM[10-2.5] volatile PM[10-2.5] non-vol. PM[2.5-1] volatile PM[2.5-1] non-vol. PM1 volatile PM1 non-vol.
Fig. 10. Size fractionated PM mass concentrations measured in
Meliptz between 23 and 25 March 2007 using an EDM. “volatile”
denotes the mass fraction that is volatile at 50◦C.
the range of previous observations of desert dust layers (0.2, 0.5, 1.1 in M¨uller et al., 2007) but rather outside the range of biomass burning and continental pollution aerosols (10 ob-servations between 1.0 and 1.4 in M¨uller et al., 2007). In addition, the extinction-to-backscatter ratio (lidar ratio) of 60 sr retrieved from the combined AERONET (optical depth) and lidar observations (column-integrated backscatter coeffi-cient) shows a clear signature of non-spherical soil or dust particles. In the case of a large fraction of large particles as measured at ground, the lidar ratio would be 20–25 sr ac-cording to Mie scattering theory, which assumes spherical particles. As shown during our previous long-term measure-ments, the lidar ratio for obviously non-spherical particles can be larger by a factor of 2–3 compared to spherical parti-cles (Mattis et al., 2002).
The Sun photometer measurements from 24 March 2007 are complemented in Fig. 9 by two cases featuring Sahara dust aerosol, one measured in immediate vicinity of the Sa-hara, at Ouarzazate, Southern Marocco, on 15 May 2006, and another after a major transport event of a Saharan dust layer to Leipzig on 14 October 2001 (M¨uller et al., 2003; Ansmann et al., 2003). The comparison of the Saharan dust and the Ukrainian soil dust spectra reveal that the aerosol on 24 March was composed of fine mode particles (continen-tal haze), indicated by a strong spectral dependence of the optical depth from 0.340–0.600 µm, and coarse mode parti-cles which cause a similarly flat spectral slope of the optical depth in the range from 0.80–1.70 µm as the Saharan dust particles. The contribution of anthropogenic fine mode par-ticles to the total particle-related optical depth is estimated
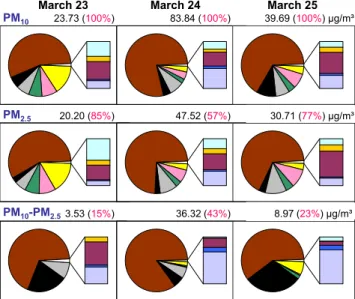
March 23 March 24 March 25
PM 10 PM 2.5 PM10-PM2.5 23.73 (100%) 83.84 (100%) 39.69 (100%) µg/m³ 20.20 (85%) 47.52 (57%) 30.71 (77%) µg/m³ 3.53 (15%) 36.32 (43%) 8.97 (23%) µg/m³
Fig. 11. Main components of bulk PM on 23 March (clean air
mass), 24 March (dust event), and 25 March 2007 (continental air mass) at Melpitz. The circular charts indicate relative mass
frac-tions. Total mass concentrations in µg m−3and mass fractions
rel-ative to PM10are added in black and red font, respectively.
to be about 0.1. Thus, 80% of the optical depth results from light extinction by the soil dust.
4.4 Physico-chemical and chemical properties 4.4.1 Volatility of bulk PM at 50◦C
Figure 10 shows time series of PM concentrations mea-sured by the EDM instrument. The mean mass concentra-tions for PM10 and PM2.5 over the three days were 50.7 and 32.0 µg m−3, and in fair agreement with corresponding gravimetric measurements of 49.1 and 32.8 µg m−3, respec-tively. PM1, representing the fine particle mode, was found to consist between 11 and 67% of material that was volatile at 50◦C. (The main volatile specie evaporating at 50◦C is particulate nitrate (Hildemann et al., 1984).) In contrast, the coarse particle fractions, PM2.5−1 and PM10−2.5 contained practically no material that volatilises at 50◦C. The results from the EDM add up to the impression that increase in total particulate mass on March 24 was caused by involatile mate-rial concentrated mainly in the PM10−2.5fraction.
4.4.2 Main components of bulk PM
Figure 11 gives an overview of the mass concentrations of selected compounds for daily samples of PM10and PM2.5at Melpitz on 23, 24 and 25 March. Here, concentrations for PM10−2.5were calculated by subtracting the value of PM2.5 from that of PM10. As shown before, PM10 and PM10−2.5 were significantly increased on 23 March by the impact of
the dust plume, and PM10 reached a daily average value of 84 µg m−3 on 24 March. Again, the major mass gain from 23 March to 24 March is caused by the coarse fraction PM10−2.5, which increased by a factor of 10.
The chemical speciation identified major amounts of sol-uble ions (ca. 30%) in PM2.5 on 23 March and a total car-bon (TC) fraction of about 8%. PM10−2.5, in contrast, fea-tures only negligible amounts of soluble ions, about 30% car-bonaceous material, and an overwhelming fraction (∼70%) of unidentified material. The unidentified material contains those compounds that are neither soluble, ionic, nor carbona-ceous. The major class representing this unidentified fraction in atmospheric aerosols is crustal material, which typically includes silicates and insoluble carbonates (e.g. Fernandez-Espinosa et al., 2002).
The air mass change from 23 March to 24 March featured, above all, an increase in the unidentified chemical fraction. This change is most notably in PM10−2.5, where the uniden-tified fraction attains a share of ∼85%. This is a strong indi-cator for the presence of crustal material in the dust plume. On 25 March, the bulk PM composition changes again, now with a reduced share of unidentified material but an increased fraction of carbonaceous material, notably elemental carbon (Fig. 11). To our experience such relative amounts of carbon are usual for continentally aged aerosols, so that this obser-vation is not surprising based on air mass residence times of more than 6 days over land, as shown by trajectory calcula-tions.
It is worth to note that the chemical analysis of PM samples from four additional sites (Nord, Dresden-Herzogingarten, Schwartenberg, Niesky) confirmed a similar degree of spatial homogeneity of the dust plume as found ear-lier in Sect. 4.2, now with respect to chemical particle com-position.
4.4.3 Ti and Fe in in bulk PM10
Iron (Fe) and Titanium (Ti) concentrations in daily PM10 samples are depicted as a function of time in Fig. 12. Like PM10mass concentrations, extremely high concentrations up to 0.36 µg m−3 (Ti) and 4.4 µg m−3 (Fe) were observed at all measurement sites in Saxony on March 24, the day of the dust event. On the day of the dust event, the mass fractions of Ti and Fe were 0.24% and 3.2%, respectively, at the rural stations Schwartenberg, Niesky, and Melpitz. On 28 March, in contrast, the corresponding values were merely 0.08 and 1.1%. It is straightforward to see that the dust event corre-lates with an increased fraction of Ti and Fe. To assess the geogenic contribution to each sample, the relative mass frac-tions of Ti and Fe were compared to their relative abundance in the upper continental crust. Taylor and McLennan (1985) report crustal abundances of 0.30% (Ti) and 3.50% (Fe), which are rather similar to the values observed on 24 March 2007. Ti originates almost solely from geogenic sources, and a simple mass balance model assuming geogenic dust to be
0 4 .0 3 .2 0 0 7 0 8 .0 3 .2 0 0 7 1 2 .0 3 .2 0 0 7 1 6 .0 3 .2 0 0 7 2 0 .0 3 .2 0 0 7 2 4 .0 3 .2 0 0 7 2 8 .0 3 .2 0 0 7 0.0 0.1 0.2 0.3 0 1 2 3 4 5 µ g m -3
Ti
Fe
µ g m -3 DN DHG SW N MFig. 12. Daily average mass concentrations of iron (Fe) and
Ti-tanium (Ti) in PM10at the 5 sampling sites Dresden-Nord (DN),
Dresden-Herzogingarten (DHG), Schwartenberg (SW), Niesky (N) and Melpitz (M) in Saxony, Germany between 3 and 28 March 2007. 24 March corresponds to the day of the dust event over cen-tral Europe.
the only source of Ti leads to the result that 80% of the PM10 mass concentration on 24 March would be geogenic dust. It is worth noting that this value agrees very well with the 80% mass fraction of unidentified material derived in Sect. 4.4.2.
5 Discussion
5.1 Causes of the extreme PM concentrations
The causes of the extreme values of PM10 on 24 March 2007 in Central Europe were severalfold. After a two-week drought period in the southern Ukraine, high amounts of agricultural dust were activated under high surface wind speeds at a time of the year, when little vegetation was present. This dust was transported within only 18–24 h into Central Europe along a narrow boundary layer jet on the northern edge of a low pressure system. The rapid trans-port at low relative humidities (day-time values 40–50%) prevented its efficient removal during the transect by dry or wet deposition. The fact that the dust plume could not ex-pand into the free troposphere is considered to be the main
reason for the high aerosol concentrations measured at the ground. In fact, no indications for lofting or mixing with clean free tropospheric air were found during the transport (Sect. 4.3). Radiosounding observations along the transport path of the plume yielded boundary layer heights between 1.0 and 1.6 km, topped by a capping inversion (Sect. 4.1.3). A cause of the stability of the dust layer is the topping of the boundary layer with warm air merging from the south. In summary, the combination of the soil structure, strong local winds, and fast transport within a relatively dry and stable boundary make this dust event for Central Europe extraordi-nary.
5.2 Influence of Saharan dust?
Dust transport from the Ukraine into Central Europe is an unusual feature, and has not been documented in the liter-ature. Rather than Southern Eurasia, the Sahara desert has traditionally been viewed as the main source region of re-motely transported mineral dust in Europe. Saharan dust can usually be observed over Central Europe several times a year, but generally enters Europe via lofted aerosol lay-ers (Ansmann et al., 2003; Barkan et al., 2005; Amiridis et al., 2005). While such detached layers may remain rel-atively stable, they need to mix with boundary layer air for the dust particles to reach the ground. Consequently, Saha-ran dust plumes spread and dilute over large areas and ap-pear at the ground only at moderate concentrations. A record of PM10 observations at Hohenpeissenberg, Southern Ger-many, where Saharan dust is usually seen several times a year yielded 280 µg m−3 as a 7-year hourly maximum concen-tration (Christian Plass-D¨ulmer, personal communication). This is considerably lower than the maximum concentrations observed in the Ukrainian dust plume (640 µg m−3 at the station Borna, Germany) and illustrates the limited impact of Saharan dust intrusions on ground-based concentrations. From the features discussed in Sect. 5.1 it is very clear that the Ukrainian dust plume does not fall into the same meteo-rological transport category as the Saharan dust plume.
A second argument to rule out the influence of Saharan dust uses actual observations along transport path. Accord-ing to Fig. 4, any dust from the Sahara would have been re-quired to pass over the Aegean Sea, or Turkey and the Black Sea in order to reach the jet flow into Central Europe. Numer-ous cloudless SEVIRI satellite scans recorded on 23 March 2007 over these areas were scrutinized but did in fact not reveal any amounts of dust remotely comparable to those re-leased over the Ukrainian source region. Any coarse dust present in the marine boundary layer would have likely been removed by the precipitation reported at many sites on the northern shore of the Mediterranean (5–16 mm daily sums on 23 March).
The last doubts about the origin of the Ukrainian dust plume could be resolved by a geochemical analysis of dust particles collected in the Czech Republic (Hladil et al.,
20082) These authors compared the multi-elemental metal content, Pb isotope ratios, and the prevalence of biota (paly-nological analysis) of particles from the plume with soil dust samples collected in the Southern Ukraine. Their unequivo-cal conclusion is that the particles from the dust plume orig-inated in the Southern Ukraine rather than in Africa. 5.3 Influence of biomass burning?
The MODIS composite image (Fig. 2) reveals small spots of fires in southern Ukraine at the time the dust was acti-vated. However, the aerosol characteristics in the Ukrainian dust plume do not indicate strong contributions from biomass burning. Figure 11 demonstrated that only 10% of the PM10 mass concentration was carbonaceous on 24 March, which is low, for instance, compared to 80% in sub-µm PM re-ported in African biomass burning plumes (Formenti et al., 2003). Also, the ˚Angstr¨om exponent and the lidar ratio of the Ukrainian dust plume are far more typical for mineral dust than for biomass burning plumes (cf. Sect. 4.3). Ob-servations of CO2and CO by the German Federal Environ-ment Agency on 24 March at Neuglobsow (53.2◦N, 13.0◦E) yielded mixing ratios of 390 ppmV and 240 ppbV, respec-tively. Both levels were representative of the continental Eu-ropean background and did not show any particular increase during the occurrence of the Ukrainian dust plume. For the reasons given we can safely exclude a major influence of biomass burning on the plume observed on 24 March 2007. 5.4 Long-term representativeness
To address the long-term representativeness of the Ukrainian dust plume observations, existing long-term time series of daily PM mass concentrations and chemical composition at Melpitz were screened for similar events. On 24 March, the coarse PM mass fraction (PM10−2.5/PM10) attained a daily mean value of 43% (Fig. 11). PM2.5has been available since May 2004, and the second-highest coarse PM mass frac-tion since then was 21% (23 July 2005). The latter event, however, occurred in westerly Atlantic air and was therefore characterized by local dust resuspension under summertime conditions rather than remote transport.
PM10mass concentrations and chemical composition have been available at Melpitz since 1993. A screening of the data over the years 1993–2007 yielded that no single day showed the same chemical composition features as the aerosol in the dust plume of 24 March 2007. Two days with PM10greater than 100 µg m−3 were found where where the ionic mass fractions were relatively low: 28 December 1996 (PM10 116 µg m−3, ionic mass fraction 27%) and 11 December 2002 (104 µg m−3and 27%, respectively). A back trajectory
2Hladil, J., Strnad, L., ˇS´alek, M., et al.: An anomalous
atmo-spheric dust deposition over Central Europe, 24 March 2007, and fingerprinting of the SE Ukrainian source, B. Geosci., submitted, 2008.
analysis showed that both air masses originated in Central Russia, but were not particularly related to high wind speeds, so that their unidentified chemical fraction cannot be at-tributed to a specific area such as on 24 March 2007. 5.5 Soil condition and desertification trends in Ukraine The total area of the Ukraine is 603 700 km2, 70% of which are used as farm lands. The southern Ukraine has been char-acterised as a “forest-steppe” zone, in its less droughty part, or as a “steppe” zone in its more droughty part. In both zones, human impact has almost completely removed the former na-tive forests and steppe lands, and created large-scale agricul-tural units. In the wide “loess” plains the very fertile black earth (Chernozem) has formed, which belongs to the most fertile soils worldwide. Due to the intensive agricultural de-velopment, the soil has become prone to wind erosion and in fact, wind has been found to have eroded Ukrainian soils over an area of 220 000 km2. Wind erosion in the area of the former USSR has been recognised in the scientific liter-ature as early as the 1920s and in fact, a considerable body of scientific studies (exclusively in Russian language) have been directed towards identifying the reasons of wind erosion and their environmental and economic consequences (Dol-gilevich, 1997; Larionov et al., 1997). Wind erosion has increased since the 1930s and particularly the 1950s when many natural areas were turned into intense agriculture. Cur-rently, wind erosion in Eurasia gravitates to the southern forestless zone, where strong winds prevail. The areas of the most severe wind erosion are located in the European part and include the North Caucasus, Lower Don and, explicitely, the eastern and southern parts of Ukraine. A comparison of the climate of the past (ca. 100 years ago) with the climate of today shows that the territory of the Ukraine has become arid due to human activities. Consequently, wind erosion has be-come wide-spread even in areas formerly unaffected by wind erosion.
Meteorological statistics over the past 40 years indicated the frequency of dust storms was found to be 3–5 per year in the steppe zone, with an average duration of 8–17 h (Dol-gilevich, 1997). Dust storms in the Ukraine are typically as-sociated with wind speeds of 20 m s−1and more with Cher-nozemic soils being the most susceptible to wind erosion. During dust storms, these soils can lose 70 t of soil per ha and hour. Based on this statistics it can be recognised that the dust storm on March 23, 2007 was not very unusual for the southern Ukrainian region.
As early as the 1950s, counter-actions have been devised to diminish wind erosion. Until now about 10% of the arable land has been re-transformed into untilled land. Also, sys-tems of shelterbelts, i.e. coherent rows of trees that slow down surface winds, were planted over more than 440 000 ha in all the natural zones of the Ukraine (Larionov et al., 1997). However, the privatisation process in Ukraine has not
re-lieved the pressure of intense agricultural use on the ecosys-tem (USAID, 2001).
It appears, at this date, uncertain whether the desertifi-cation trends will continue, and how climate change might change the properties of the soil and the future frequency and intensity of dust activation. The IPCC report from 2007 mentions “increased drought in some mid-latitude and semi-arid low-latitude areas”, as well as an increased intensity of “floods, droughts, and erosion” as a result of the predicted climate change over the coming decades (Schneider et al., 2007). Desertification trends, however, will depend in a com-plex manner on changes in water and wind circulation, as well as further economic and societal changes in the mid-term future. Consequently, there remains a considerable de-gree of uncertainty about the role of dust activation on future air quality, even in relatively distant areas like Central Eu-rope.
5.6 Health effects
It is believed, but little researched, that increased dust storm activity has an impact on human health. Natural inorganic dust particles have traditionally been viewed as nonthreat-ening to human health after inhalation, and soil dust con-sisting mainly of crystalline rock has been rated less toxic compared for instance to anthropogenic soot (Taylor, 2002). However, Schenker (2000) suggest that inorganic agricul-tural dusts might explain some of the increase in chronic bronchitis reported in occupational studies among farmers. Wiggs et al. (2003) found a link between increased dust ex-posure and respiratory health in the Autonomous Republic of Karakalpakstan, Uzbekistan, a region which bears simi-lar desertification trends like Southern Ukraine. It is evident that more research is needed to understand the consequences of increasing dust emissions on the health of the populations inside and outside the source regions.
6 Conclusions
A comprehensive body of in situ and remote sensing aerosol measurements was used to depict the advection of an unusual dust plume into Central Europe on 24 March 2007. Hourly PM10mass concentrations reached 1400 µg m−3in Slovakia and 1200 µg m−3in Poland. The maximum hourly value in Germany was 640 µg m−3, where rural PM
10levels are typ-ically around 20 µg m−3. As a result of the dust event the le-gal daily limit value of PM10(EU First Air Quality Daughter Directive (1999/30/EC)) was exceeded over an area spanning several EU member states.
Rather than through lofted aerosol layers, as often the case with African dust, the coarse dust entered into Central Eu-rope within a well mixed but vertically confined boundary layer. Satellite images, back trajectory calculations as well as meteorological status reports gave evidence that the southern
Ukraine (district of Kherson, around the Kakhovka Reser-voir) was the source region of the dust plume. Owing to the meteorological dipole constellation of low pressure over the Balkans and high pressure over Central Russia, wind gusts up to 30 m s−1 were generated over Southern Ukraine and could activate large amounts of soil dust – on the order of 60 Gg, from a dry and largely unvegetated surface.
PM10 measurement data from 360 government monitor-ing stations across Central Europe served as a powerful tool to illustrate the advancement and the spatial extent of the dust plume. Lidar observations over Leipzig, Germany revealed that the high aerosol mass concentrations were confined to a homogeneous boundary layer of about 1.8 km height. The wavelength dependence of light extinction measurement us-ing both lidar and sun photometer with an ˚Angstr¨om expo-nent of 0.46 suggested dominating amounts of coarse parti-cles during the main event. Relatively high volume extinc-tion coefficients of 300–400 Mm−1(typical background val-ues 80–90 Mm−1) and an aerosol optical depth of 0.71 (typ-ical background value 0.1) were observed at the wavelength 0.532 µm. In-situ particle size distributions confirmed the presence of a dominating coarse particle mode with mode diameter >2 µm in the dust plume whereas multiple point measurements in Saxony, Germany demonstrated the homo-geneous distribution of particle mass, number, as well as bulk chemical composition across a few 100 km. Independent ap-proaches came to the conclusion that the mass fraction of crustal material in daily average PM10 was about 80% on 24 March. Based on the observed aerosol characteristics as well as CO2and CO measurements, a significant confound-ing impact of biomass burnconfound-ing on the dust aerosol can be ruled out. Further meteorological transport considerations make any larger contribution of Saharan dust unlikely.
A screening of the long-term time series of PM10at Mel-pitz showed that between 1993 and 2007 no event compa-rable to the dust plume of 24 March 2007 occurred. It ap-pears that the transport of extreme PM concentrations from the Ukraine into Central Europe is an infrequent meteorolog-ical phenomenon, which probably does not occur more often than once in 10 years.
Questions and concerns, however, have remained whether such events of dust activation might become more frequent in the future as a result of continuing anthropogenic de-sertification processes. Natural vegetation growth, cultiva-tion patterns, and even meteorological transport pathways are vulnerable to predicted climate change. An assessment of the role of dust in future climates will therefore require a more thorough understanding of the controlling factors of dust emission, including the role of changes in land use, such as the continuing destruction of soil crusts and removal of vegetation in semi-arid regions. In any case, our observa-tion highlights the need to improve the descripobserva-tion of large-scale dust emission fluxes under a changing climate as well as direct anthropogenic intervention, and models simulating 3-dimensional transport of coarse dust.
Appendix A
Charge correction of TDMPS mobility distributions using APS data
A combination of an electromobility spectrometer (TDMPS) and an aerodynamic particle sizer (APS) was deployed to measure particle size distributions at Melpitz across a wide size range between 3 nm and 10 µm. The TDMPS is a custom-built instrument based on Hauke differential mobility analysers that measures particles up to electromobility diam-eters of 800 nm (Birmili et al., 1999). The aerodynamic parti-cle sizer (APS; model 3321, TSI Inc., St Paul, USA) (Peters and Leith, 2003), in contrast, measures particles above an aerodynamic diameter of 835 nm. Aerodynamic and electro-mobility diameters are connected by the so-called “effective particle density”, a lump parameter that describes the com-bined effects of particle material density as well as shape on aerosol motion (Schmid et al., 2007). To evaluate the TDMPS size distributions, the solution of a multiple charge inversion algorithm is necessary (Hagen and Alofs, 1983). The procedure used here involves solving a system of lin-ear equations connecting particle mobility and size and was described in Stratmann and Wiedensohler (1996).
As long as particles larger than the upper size limit of the TDMPS are not removed physically, the multiple charge in-version requires either the knowledge of the size distribu-tion of larger particles, or the assumpdistribu-tion that the concen-tration of larger particles decreases so strongly with particle size that their contributions on smaller electromobility diam-eters become negligible. As the number concentrations of particles >800 nm were available from APS measurements, their effect could accurately be accounted for. In practice, we first used an effective particle density of 2.0 g cm−3 (Mar-ing et al., 2003), correspond(Mar-ing to soil dust, to convert the aerodynamic diameters of the APS to electromobility diame-ters. Then, the contributions of multiply charged particles in APS size channels onto mobility diameters lower than 800 nm were calculated and subtracted from the TDMPS raw mobility spectrum. Here, we used the bipolar charge distri-bution according to Wiedensohler (1988) and accounted for multiple charges up to n=15, which includes more than 99% of the total of the multiply charged particles. The corrected TDMPS raw spectrum was then inverted.
Figure A1 shows the inverted TDMPS particle size distri-butions as a function of mobility diameter with and without correction for particles >800 nm. Two main effects are evi-dent: First, the correction procedure reduces the TDMPS size distributions at the upper end by relative values up to 40%, which advocates the necessity of the correction scheme. Sec-ond, the TDMPS and APS size distributions appear to match better in the overlap region of both instruments after apply-ing the correction. This demonstrates the need to take par-ticles beyond the upper size cut of the TDMPS into account if large amounts of coarse aerosol particles are present. For
101 102 103 104 10-1 100 101 102 103 104 105 101 102 103 104 10-4 10-3 10-2 10-1 100 101 102 number 3 100 40 20 with APS correction without APS correction APS 600 700 800 900 10 d N /d lo g D p i n c m -3 volume 2 4 d V /d lo g D p i n µ m 3 cm -3 Electromobility diameter in nm 600 700 800 900 1 10
Fig. A1. TDMPS number size distributions with and without
cor-rection for multiple charges of particles >800 nm (24 March 2007; 11:15–12:15 CET). The overlap region is highlighted for clarity. The lower graph shows volume size distributions assuming spheri-cal particles.
periods without high concentrations of coarse particles, how-ever, the effects of the correction procedure were below 0.5% on the TDMPS concentrations at the upper end. Under av-erage conditions, TDMPS size distributions can be safely in-verted without considering the concentrations of coarse par-ticles.
Acknowledgements. We greatly acknowledge the originators of
the PM10 mass concentration data, without whom the spatial
description of the dust event would not have been possible. R. Otto prepared several figures of the manuscript. We acknowledge the AERONET team for instrument calibration and data analysis. The Moderate Resolution Imaging Spectroradiometer (MODIS) project contributed the composite image made on board of the Aqua satellite. K. Weinhold was responsible for the maintenance and processing of TDMPS and SMPS measurements at Niesky and
Schwartenberg. In situ measurements in Saxony were supported the Umweltbundesamt (German federal environment agency, Dessau, Germany) and the S¨achsisches Landesamt f¨ur Umwelt und Geologie (Saxonian Office for the Environment and Geology, Dresden). Measurements at Melpitz and the data evaluation for this paper were conducted within the European Integrated project on Aerosol Cloud Climate and Air Quality Interactions (EUCAARI), coordinated by M. Kulmala, University of Helsinki, Finland. We finally thank three anonymous reviewers who helped improve this manuscript.
Edited by: A. Stohl
References
Ackerman, S. A.: Remote sensing aerosols using satellite infrared observations, J. Geophys. Res, 102, 17 069–17 079, 1997. Allen, G., Sioutas, C., Koutrakis, P., et al.: Evaluation of the TEOM
method for measurement of ambient particulate mass in urban areas, J. Air Waste Manage. Assoc., 47, 682–689, 1997. Alpert, P., Kishcha, P., Shtivelman, A., Krichak, S. O., and Joseph,
J. H.: Vertical distribution of Saharan dust based on 2.5-year model predictions, Atmos. Res., 70, 109–130, 2004.
Althausen, D., Engelmann, R., Foster, R., Rhone, P., and Baars, H.: Portable Raman lidar for determination of particle backscatter and extinction coefficients, in: Reviewed and revised papers pre-sented at the 22nd ILRC, edited by: Pappalardo, G. and Amodeo, A., vol. 1 of ESA SP-561, pp. 83–86, ESTEC, Noordwijk, The Netherlands, ESA Publications Division, 2004.
Amiridis, V., Balis, D. S., Kazadzis, S., et al.: Four-year aerosol observations with a Raman lidar at Thessaloniki, Greece, in the framework of European Aerosol Research Lidar Network (EAR-LINET), J. Geophys. Res., 110, D21203, doi:2005JD006190, 2005.
˚
Angstr¨om, A.: Techniques of determining the turbidity of the atmo-sphere, Tellus, 13, 214–223, 1961.
Annesi-Maesano, I., Forastiere, F., K¨unzli, N., and Brunekreef, B.: Particulate matter, science and EU policy, Eur. Respir. J., 29, 428–431, 2007.
Ansmann, A. and M¨uller, D.: Lidar and atmospheric aerosol parti-cles, in: LIDAR – Range-resolved optical remote sensing of the atmosphere, edited by: Weitkamp, C., pp. 105–141, Springer, New York, 2005.
Ansmann, A., B¨osenberg, J., Chaikovsky, A., et al.: Long–range transport of Saharan dust to northern Europe: The 11–16 October 2001 outbreak observed with EARLINET, J. Geophys. Res., 108, D04783, doi:2003JD003757, 2003.
Barkan, J., Alpert, P., Kutiel, H., and Kishcha, P.: Synoptics of dust transportation days from Africa toward Italy and central Europe, J. Geophys. Res., 110, D08201, doi:2004JD005222, 2005. Belnap, J. and Gillette, D. A.: Disturbance of biological soil crusts:
Impacts on potential wind erodibility of sandy desert soils in Southeastern Utah, Land Degrad. Devel., 8, 355–362, 1997. Birmili, W., Stratmann, F., and Wiedensohler, A.: Design of a
DMA-based size spectrometer for a large particle size range and stable operation, J. Aerosol Sci., 30, 549–553, 1999.
Birmili, W., Wiedensohler, A., Heintzenberg, J., and Lehmann, K.: Atmospheric particle number size distributions in Central