HAL Id: halshs-01374451
https://halshs.archives-ouvertes.fr/halshs-01374451
Preprint submitted on 30 Sep 2016HAL is a multi-disciplinary open access archive for the deposit and dissemination of sci-entific research documents, whether they are pub-lished or not. The documents may come from teaching and research institutions in France or abroad, or from public or private research centers.
L’archive ouverte pluridisciplinaire HAL, est destinée au dépôt et à la diffusion de documents scientifiques de niveau recherche, publiés ou non, émanant des établissements d’enseignement et de recherche français ou étrangers, des laboratoires publics ou privés.
HOW DO PRODUCT AND LABOR MARKET
REGULATIONS AFFECT AGGREGATE
EMPLOYMENT, INEQUALITIES AND JOB
POLARIZATION? A GENERAL EQUILIBRIUM
APPROACH
Julien Albertini, Jean-Olivier Hairault, Francois Langot, Thepthida
Sopraseuth
To cite this version:
Julien Albertini, Jean-Olivier Hairault, Francois Langot, Thepthida Sopraseuth. HOW DO PROD-UCT AND LABOR MARKET REGULATIONS AFFECT AGGREGATE EMPLOYMENT, IN-EQUALITIES AND JOB POLARIZATION? A GENERAL EQUILIBRIUM APPROACH. 2016. �halshs-01374451�
WORKING PAPER
N° 2016 - 03
HOW DO PRODUCT AND LABOR MARKET
REGULATIONS AFFECT AGGREGATE EMPLOYMENT,
INEQUALITIES AND JOB POLARIZATION?
A GENERAL EQUILIBRIUM APPROACH
JULIEN ALBERTINI
,
JEAN
-
OLIVIER HAIRAULT
,
FRANCOIS LANGOT
,
THEPTHIDA SOPRASEUTH
www.tepp.eu
TEPP - Institute for Labor Studies and Public Policies
1
How do Product and Labor Market Regulations affect
Aggregate Employment, Inequalities and Job
Polarization?
A General Equilibrium Approach
Julien Albertini
Humboldt University (Berlin)
Jean-Olivier Hairault
Paris School of Economics (PSE), University of Paris I
& IZA
François Langot
University of Le Mans (GAINS-TEPP & IRA), PSE &
IZA
Thepthida Sopraseuth
University of Cergy-Ponthoise (THEMA) & IUF
March 2016
2
1 Introduction
"Further work tractably integrating various forms of labor market imperfections within a framework that incorporates the endogenous allocation of skills to tasks appears to be another fruitful area for research." Acemoglu & Autor (2011), p.1160.
For more than 30 years, developed countries have undergone dramatic structural changes driven by rapid technological progress. These technological changes affect the employment of skilled and low-skilled workers in a non-trivial way, generating task-biased demand shifts in favor of skilled and lowest-skilled workers, to the detriment of middle-skilled workers. These changes (sometimes referred to as “Task Biased Technological Change”, TBTC) thus lead to job polarization, namely the disappearance of mid-level jobs (requiring a moderate level of skills, such as autoworkers’ jobs) relative to both those at the bottom (requiring few skills such as cleaners and salespeople) and those at the top (requiring greater skill levels such as managers and professionals). Empirical evidence of pervasive ongoing job polarization has been provided for the US (Autor & Dorn, 2013)1 and for European countries (Goos & Salomons, 2014). However, in European countries, the persistence of a high unemployment as well as the low employment rate compared to the US suggests that transitional reallocation process matters in the long-run: this echoes the so-called "European employment problem" (Ljungqvist & Sargent (2008), Ljungqvist & Sargent (1998)). Since the empirical works by Blanchard & Wolfers (1999), this literature lays stress on the role of the interaction between Labor Market Institutions (LMI) and aggregate shocks in shaping transatlantic differences in employment rates and on the role of structural reforms in improving European employment levels (see e.g. Hornstein et al. (2007)). Hence, as suggested by Acemoglu & Autor (2011), this paper aims at bridging the gaps between micro and macro analysis of the labor market by analyzing endogenous allocation of skills to tasks in a general equilibrium model with labor and good market imperfections, as well as evolving institutional environments.
In a previous work (Albertini, Hairault, Langot and Sopraseuth (2015)), we developed a multi-sectorial search and matching model with endogenous occupational choice to shed light on the way structural changes affect aggregate employment and job polarization. The originality of our approach is to analyze the dynamic path of employment reallocations. Indeed, the transformations of the production process have been progressive, driven by an incremental implementation of new technologies. The process can be long, because occupational changes result from search and learning activities from new tasks. Hence, we have proposed a non-stationary model that allows understanding these employment movements during a structural change. By identifying the direction of the structural change that suppresses jobs in the middle of the wage distribution, our previous model (Albertini, Hairault, Langot and Sopraseuth (2015)) also explains the job polarization and inequalities observed in the US and in European countries.2
Moreover, our previous work showed that some labor market institutions can stall the reallocation process because they do not allow the labor market to open some jobs for inexperienced workers on potential new jobs. This was obtained contrasting 3 types of country that differ with respect to their labor market institutions. Type I economies
1Jaimovich & Siu (2015) show that this phenomenon is magnified in recession.
2 Albertini, Hairault, Langot and Sopraseuth (2015) provide a model that matches the evolution of aggregate
employment and employment shares by task. The model also captures the evolution of wage and income inequalities across countries and over time.
3
(reminiscent of the United States) have flexible labor market arrangements: there is no Minimum wage (MW) and low unemployment benefits. Type II are characterized by rigid labor market, mimicking that of France: a relatively high minimum wage, unemployment benefits and firing costs. Economies of Type III constitute an intermediate case (reminiscent of that in Germany): wage-setting displays sluggishness but there is no MW.
In this paper, we extend our previous analysis (Albertini, Hairault, Langot and Sopraseuth (2015)) along two dimensions. Firstly, we introduce an endogenous number of firms à la Melitz (2003) in order to account for interactions between good and labor markets, and their respective institutions. Secondly, rather than focusing on the historical path of our prototypical economies as in the previous paper we now want to forecast their future dynamics as spurred by large changes in technology. Hence, for each economy we analyze the transitional dynamics from today to a new world, i.e. the path along which structural technological changes remove the competitive advantages of workers in the middle of the wage distribution, leading them to move to new opportunities at the bottom of the wage distribution. By nature, this phenomenon takes time (searching for a job in a new occupation is time consuming), and it can be blocked if redistributive policies, by increasing the outside option of the poorest, cancel the potential profits of new jobs in the service sector.3 Beyond the comparison of the initial and final steady states, we also solve the transitional dynamics. Further, our paper goes beyond the traditional analysis of PMR and LMIs’ effects on labor market outcomes by focusing on their effects on the reallocation from routine to manual tasks.
Our main findings can be summarized as follows:
In the benchmark simulations, Task Biased Technological Change creates more jobs. In these benchmark scenarii, we assume that LMI and PMR are stable and given by their current level in the 3 types of countries. The magnitude of job creations and thus the extent of employment reallocation depend on LMI and PMR: flexibility fosters employment gains. However, flexibility also generates increasing wage and income inequalities.
LMI or PMR reforms have little effect on employment, except if they are targeted on segments of the expanding economy. Any policy that aims at protecting the declining tasks is inefficient in the medium and the long run. By contrast, the most efficient reforms are those that favor reallocation towards the expanding activities. These include targeting active labor market policy (ALMP) and payroll taxes reductions to low skilled workers, and liberalizing the service sector. The impact of these reforms depends on the wage-setting rule. In the Type III country, where the bargaining rules lead to wage moderation, the employment gains are the largest.
LMI or PMR reforms have little effect on inequality. Whatever the reform, inequalities increase, driven by the polarization of the jobs.
Nevertheless, employment gains in all types of country generate a government surplus in the long run. These new fiscal revenues can be used to reduce inequalities through a redistributive policy. The use of the government transfers as an additional income for all unskilled workers show how the efficiency gains can be used to reduce inequalities. We then show that the larger the employment gains, the more effective the redistributive policy.
3This approach contrasts with the stylized model proposed by Autor & Dorn (2013) who stress only the long-term
effects of the job polarization phenomenon in a frictionless economy. Workers move from the routine sector to the manual sector without search frictions.
4
2 Overview of the model
We develop a general equilibrium model that allows us to account for the transitional dynamics of the reallocation process induced by a "task biased technological change" (TBTC). This model is characterized by two features: first, there are search and matching frictions on the labor market, which helps us capture the speed of reallocation, and secondly, the number of firms in both good and service markets is endogenous, which will connect technological progress to competition through endogenous responses of markups to technological changes. From a methodological point of view, we introduce heterogeneity across countries only through their LMI: as preferences and technology are identical, heterogenous economic performances come only from country specific institutions. The idea is then to identify LMI that can alter the reallocation process towards new activities. Our 3 types of economies also differ with respect to their wage-setting arrangements. In Type I economies, wages are subject to bargaining between firms and workers, and hence are responsive to changes in productivity and workers’ outside options (unemployment benefits, social programs). In type II economies, wage-setting is bounded by a minimum wage, which is uniform for all sectors while, in Type III economies, wage evolves with a reference to a sector-specific social norm which leads to an endogenous wage moderation specific to each sector. By introducing imperfect competition and an endogenous number of firms in the products markets this paper extends the previous work of Albertini, Hairault, Langot and Sopraseuth (2015) assessing the role of "Product Market Regulation" (PMR) policies on the labor market outcomes during this period of structural change.
5
Regarding the model calibration, some parameter values are set based on existing empirical evidence and others calibrated to match selected moments in the data. Since the paper is focused on trends in employment, the selected moments in the data include employment rates (Figure 1) and employment shares (Figure 2): the beginning and the end on the sample as well as the average over the sample. Labor market institutions and wage-setting are country- specific while we consider that consumer preferences, technology and distribution of abilities within unskilled labor are the same cross countries. In addition, given that the model predicts the complete path of employment composition and level following a technological change, we need to set values for the path of labor market institutions, technological change and increase in skilled labor.
6
Figure 2: Job polarization: Changes in employment share in abstract, routine, and manual tasks in countries that exemplify types I, II and III
50 45 40 Manual Germany Routine Germany 35 Abstract Germany Manual France Routine France 30 Abstract France Manual US Routine US Abstract US 25 20 15
Source: OECD computations based on CPS US data, French and German labor surveys.
2.1 Building blocks of the model
The model is summarized in Figure 3, whereas the complete model is presented in Appendix A. It is a dynamic general equilibrium model with search and matching frictions, featuring workers’ endogenous occupational choice and job polarization induced by a deterministic task-biased technological change. We also account for an endogenous number of firms, specific to each type of goods. In order to make the model tractable, we abstract from financial markets. There are no savings.
7
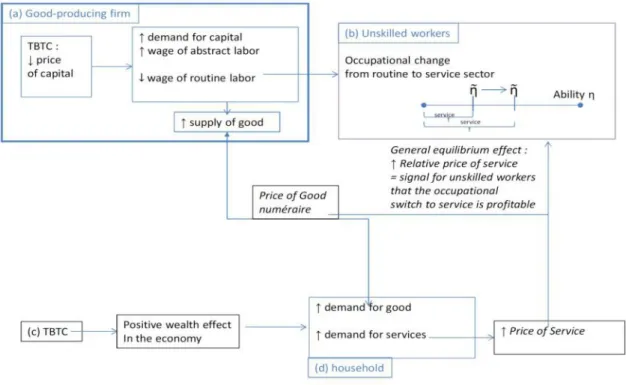
Figure 3: The model with labor market frictions and firm entry
The building blocks of the model are
(a) and (b) (section 2.3) :
o Block (a) (section A.4): The good producing sector uses 2 intermediate goods: a high-tech good Z1 and a low-tech good Z2. This decomposition of inputs (Z1 and Z2) is made in order to avoid the useless complexity of the strategic wage bargaining in large firms.
The high-tech good is produced by high-skilled workers in abstract non-routine cognitive jobs La.
The low-tech goods are produced by a CRS production function that uses i) un-skilled workers employed in routine Lr, and ii) technology (equipment, computers, machine), a good that can also perform repetitive tasks K.
In the production of low-tech goods, unskilled routine workers can be easily replaced by machines while high-tech goods, and thus abstract workers, complement repetitive tasks (whether performed by machines and/or unskilled workers). Technological change is captured by a downward trend in the price of technology pK, which creates a strong incentive for low-tech good producing firms to substitute unskilled labor for capital.
o Block (b): Search and matching frictions in both sectors, occupational choice and job polarization occurring because of the task-biased technological change.
The service sector employs only unskilled labor Lm in non-routine manual tasks (occupations involving assisting others such as janitors, cleaners ...).
(c) : Firm dynamics (section A.8 of the appendix)
o Retailers in each sector buy inputs from producing firms and sell it to consumers. We have retailers in good and retailers in services in order to allow the policy maker to possibly lower PMR only in one-sector rather than the two sectors.
o In each retailing sector, there is Cournot competition. The price and quantity therefore depend on the endogenous number of firms. The larger the number of firms, the keener the competition, the lower the retail price, the higher the
8
quantity produced by retailers. Firm entry is endogenous and subject to entry costs4. Firm exit occurs exogenously at a fixed rate, as in Melitz (2003).
(d) : Final demand (section A.9.1 of the appendix): households buy goods and services from retailers. General equilibrium effects now include the price dynamics in all sectors of the economy. The government budget is balanced each period by a lump-sum transfer to households (section A.9.3 of the appendix). In the benchmark scenario, transfers are similar across households. This will no longer be the case in section 6, with redistributive policies.
The model is thus well designed to address economic policy concerns and particularly to assess structural reforms on product and labor market allowing to transform this new technological opportunity into an employment opportunity for all workers. In Table 1, we report the policy tools available in each block of the model (b) and (c) by distinguishing the policy instruments.
Table 1: Policy tools in each block of the model Policies tools
(b) ALMP a subsidy to hiring costs
unemployment benefits a change in the replacement rate employment subsidies 2 payroll tax rates (unskilled, skilled) (c ) PMR entry costs (one in each sector)
2.2 Interaction between firm entry and employment dynamics
Several simplifying assumptions were made to make to keep the model tractable
Labor market frictions affect only the production of good and personal services (block (b)) and product market frictions affect only retailers (block (c)).
All firms in the retailing sector (block (c)) have the same productivity. Entry or exit will not affect the average productivity in the retailing sector.
In spite of this simplification, the model can capture large gains from lowering PMR as well as the strong interaction between PMR and LMI:
Lower entry costs in block (c) will increase firm entry, thereby lowering the retailing price. All households will benefit from the fall in retailing price.
In addition, higher firm entry in block (c) increases the demand for inputs from good and service producing firms in block (b), which could increase labor demand and aggregate employment, if labor market institutions are flexible enough. This last mechanism underlines the strong interaction between LMI and PMR.
2.3 Search and matching frictions with endogenous occupational
choices
4Entry costs are paid in terms of goods (rather than labor as in Melitz (2003)). The entry cost is also affected
by congestion effects: the larger the number of new entrants, the higher the entry cost. In Melitz (2003), entry costs are paid in terms of labor. Firm entry is then bounded by the households’ ability to supply labor. In our model, entry costs are paid in terms of goods. Firm entry is then bounded by adjustment costs to entry. We provide in section A.8 of the appendix a rationale for this assumption.
9
Even if the endogenous number of firms, and thus the endogeneity of the markup, can magnify the impact of technological change, the main originality of our model is to account for workers’ mobility across labor markets . We describe this part of the model in this section. Labor supply consists of skilled and unskilled workers (Figure 4)
Skilled workers are homogeneous and all perform abstract tasks (non-routine, cognitive jobs) in the good-producing firm.
There is a continuum of unskilled workers who differ with respect to their abilities. The model endogenously determines which unskilled workers occupy routine occupations versus service occupations (through the endogenous determination of the threshold [?] below which workers choose to work in manual jobs). Low- skill workers have homogeneous (heterogeneous) skills at performing manual (routine) tasks. This is consistent with the view that blue-collar workers in the factory differ in performing their tasks on the assembly line while jobs such as janitors can hardly differ in terms of productivity in providing non-routine manual services.
Figure 4: Workers Low-skilled High-skilled Endogenous
Threshold η Heterogeneous ability η Abstract
Manual Routine Non-routine
Non-routine (substitute for K) Cognitive
Service
heterogeneous skills Homogeneous homogeneous skills in performing high skill level
at performing routine tasks
manual tasks
Production of good
10
Labor market flows and occupational choices are (Figure 5)
Skilled workers are employed in abstract tasks. When fired, they join the pool of unemployed skilled workers and look for an abstract job.
Unskilled workers can be employed either in routine tasks in the good producing firm or in manual tasks in the service sector. When fired from the good-producing firms, routine unemployed workers can choose to switch occupation (we call them "new movers" Ln
m) and join the pool of unemployed workers looking for manual jobs. New movers differ from other unemployed workers looking for a manual job because i) their unemployment benefit depends on their past occupation as routine workers, ii) they just arrived on the market for manual jobs and lack proper information about the tasks and firms on the market. New movers gradually learn about the tasks and the market: they job finding probability and their productivity as manual workers is lower than their counterparts. The reallocation process from routine to manual jobs can then take time as manual jobs are slowly created and routine jobs are gradually destroyed.
Labor markets are characterized by search and matching frictions à la Mortensen & Pissarides (1994). Search is directed as there is a labor sub-market for each occupation and for each ability level in routine jobs. Within each pool, the meeting process between workers and firms is random. There is no on-the-job search (Appendix A.2).
3 Benchmark scenario: Job polarization in a context of
long-term technological change
3.1 Model Mechanisms
The long run conditions of different economies depend on their technological opportunities and their market arrangements. Technology changes over time putting pressure on some type of existing jobs but also creating new opportunities. It therefore involves intensive reallocation of resources and a change in the productive structure. While the increased production possibilities induce a "wealth effect", this is not shared by all agents. For some workers the technological progress is "labor augmenting"; but, by reducing the need for repetitive tasks, for others it is "labor saving". The final impact depends on the ability of the economy to reallocate the "saved" labor in "new" market activities. This story is at the heart of Autor & Dorn (2013) model: job polarization is the outcome of a technological change that destroys labor previously paid at wages in the middle of the distribution. These workers are occupied in "routine" tasks easily computerized and then replaced by capital. The other tasks are not directly substitutable by the technological change: "abstract" and "manual" tasks cannot be replaced by a computer. Even if "manual" tasks do not benefit from the technological change via an increase in their productivity, the more efficient production process ("wealth effect") allows the demand for these manual-producing jobs to grow.
if the reallocation from routine towards manual task is not stalled, the technology-induced structural change can be shared by all workers. But reallocation takes time, by itself, adding some delays in the convergence towards the "new long run" equilibrium. Beyond the persistence of the adjustment, this process can be costly in the short run: indeed, when jobs are destroyed, for workers that have no future in declining sectors of the economy, it is optimal to switch occupation. However, all workers switching at the same time creates a
11
congestion effect in labor market of manual tasks. Notice also that, while the time of reallocation is largely induced by the absence of opportunities on the labor market of routine tasks, opportunities on the labor market of manual tasks may be low at this reallocation time: in the short run, job polarization can induce a fall in the employment rate. One of the main contributions of our dynamic model is to provide a general equilibrium analysis of these adjustments. The originality of our approach is to account for market imperfections in both labor and good markets: in the labor markets, there are search-matching frictions and real wage rigidities, whereas in the good market there is an endogenous number of firms in both good and service markets determined by costly entry in imperfect competition markets. Hence, labor reallocation through unemployment and learning episodes is costly, whereas the entry of new firms magnifies the impact of the technological change via an increase in competition in the long run.
Hence, 3 main features distinguish our work from Autor & Dorn (2013)’s. First, we do not focus only on the asymptotic allocation after a "task biased technological change" (TBTC): we also analyze the reallocation dynamics during a gradual technological change, with their potential costs in the short run (employment losses). Secondly, in Autor & Dorn’s (2013) work, there are no frictions either on the labor market or the product market. We will show that such frictions slow down the reallocation process. Finally, Autor & Dorn (2013) show that employment gains are also associated with an increase in wage inequality. From the policy marker’s point of view, TBTC can not only generate employment gains but can also have negative redistributive effects. We quantify the employment gains and the expected deterioration in Gini coefficients.
3.2 The long-run effects of technological change in a frictionless
economy (Author and Dorn, 2013)
Autor & Dorn (2013)’s model is general equilibrium setting describing polarization without labor market frictions and perfect competition on product markets. Their model is based on several assumptions.
There is full employment on both skilled and unskilled labor market, and the labor supplies are exogenous and constant. Hence, by assumption, the technological change has no impact on the aggregate employment level. Only the repartition of unskilled workers between "routine" and "manual" tasks is endogenous.
There are two representative firms: the first one produces goods Yg with capital K, "abstract" tasks La and "routine" tasks Lr, whereas the second produces services Ys with "manual" tasks Lm. The number of firms is fixed.
There is one representative household. She consumes goods Cg and services Cs. The price of the capital is an exogenous process.
For Autor & Dorn (2013), the story behind polarization is the following.
The diffusion of the supply shock on inputs choices. The price of capital declines with the introduction of TBTC (supply shock), leading good-producing firms to intensify their production processes in capital. Capital is highly substitutable to "routine" tasks, because repetitive tasks can be replaced by machines, whereas it is weakly substitutable to "abstract" tasks. These technological possibilities then lead firms to increase the capital ratio over "routine" tasks when the price of capital declines (panel (a) in Figure 6). Even if it would be profitable for firm to hire more skilled workers on "abstract" tasks, the assumptions of (i) full-employment and (ii) constant population, imply that this tightness is completely reported on wages. Hence, new technologies allow the good sector to increase its production by a large
12
increase in capital, a relative decline in its number of "routine" jobs and a rise in the wage of workers on "abstract" tasks. Notice that the decline in "routine" jobs results from separations of the least productive workers on these tasks. Indeed, the real wage per unit of human capital declines for a routine task: hence, at the bottom of abilities distribution, it becomes more profitable to work in the service sector, where ability does not matter for the individual wage (panel (b) in Figure 6). These separations are immediately compensated by hirings on a "manual" task (no frictions on the labor market). This reallocation process is driven by frictionless individual choices: with the fall in routine wages, incentives are thus given to move towards new opportunities.
Figure 6: Autor & Dorn (2013) model : size of employment and number of firms are fixed, only relative wages change
Inequalities. Notice that the labor reallocation process requires that wages adjust downward in the routine sector while relative wages in abstract and service jobs increase. TBTC generates wage polarization.
The general equilibrium effect. The permanent increase in technological progress is a source of the large "wealth effect" that increases consumers’ aggregate income (panel (c) in Figure 6). This generates a "new" demand for both good and the service sectors (panel (d) in Figure 6). This can induce price increases. However, the two markets are not symmetrical:
in the good market, the supply shock coming from the decline in the capital price, generates a large rise in the supply. Hence, if these movements driven by the supply are larger than the ones driven by the demand, the price in the good market declines.
At the opposite, for the services, the impact of the demand shock is not compensated by the higher labor supply which comes from the reallocation from routine to manual labor markets (panel (6) in Figure 6). Hence, the relative price of services increases, which raises the wage in manual tasks, thereby providing a strong signal that the occupational
13
switch to service is profitable. This general equilibrium magnifies the reallocation process from routine to manual tasks.
3.3 Introducing
labor
market
frictions:
consequences
for
employment reallocation
Autor & Dorn’s (2013) analysis focus on long-run impact of TBTC: their model discards transitional dynamics, there is full-employment in all labor market, and the conditions to obtain job polarization are derived from the asymptotic properties of the model.
The first contribution of our analysis is to account for the levels of aggregate employment because we do not assume full employment and exogenous labor supply. Our second contribution is to account for the transitional (short and the medium run) dynamics in an economy where the length of reallocation is not negligible: there are movements in unemployment due to the search process when workers switch from one occupation to another. We also explain why the transitional dynamics specific to the matching model, is also important to explain the sluggishness in employment rates. By including unemployment dynamics along the transitional path, we are also able to analyze income inequalities, in addition to wage inequalities.
3.3.1 Frictional labor market and the long run impact of TBTC
Figure 7 shows that, with respect to Autor & Dorn (2013), this study takes into account labor market institutions (LMI) and product market regulations (PMR). LMI affects labor market adjustments, while PMR modifies price adjustments. Given the general equilibrium effect of relative prices on occupational choices, LMI strongly interacts with PMR. The endogenous dynamics of these inefficiency wedges on product and labor markets explain the employment levels for each tasks, and thus the dynamics of aggregate employment.
Figure 7: TBTC in a model with labor market frictions, product market regulations and and occupational choice: size of employment and number of firms adjust to TBTC
14
With labor market frictions, hiring takes time as firms (and job seekers) have incomplete information on the pool of potential employees (and job openings). Job finding is also subject to congestion effects as the endogenous probability of finding a job depends on the number of vacancies relative to the number of job seekers. This ratio is the labor market tightness.
A very simple way to understand the complete mechanism of our model, is to capture the equilibrium in each labor market (routine, manual and abstract tasks) as the intersection of the job creation condition (JC) and the wage curve (WC). The first one is a decreasing relation between the ratio "vacancies over unemployment", labor market tightness (θ), and the wage (w): it indicates that hiring intensity declines with the wage (the labor cost). The second locus is an increasing relation between θ and w, showing that workers ask for a higher wage when their relative scarcity is large. The general equilibrium effects are captured by the standard AD=AS model, in each market, goods and services. Finally, the last relationship equates tightness in the routine and manual labor markets. Because individual ability (η) matters for productivity in routine tasks, the incentive to hire (and thus tightness) rises with ability in the market for routine workers. Hence, the equilibrium with tightness for the manual tasks, which is a function independent from ability η, determines the ability threshold η at which it is optimal for workers to switch from routine to manual tasks (“occupational choice). Figure 8 depicts these relationships.
15
The impact of the Task Bias Technological Change (TBTC) can be decomposed as follows:
The decline in the computer price reduces the marginal productivity of routine task (they are replaced by computers). This shifts the JC curve downward (panel 1 of Figure 8). Part of this lost competitiveness is absorbed by a wage cut (the WC curve shifts upward, because TBTC results in lower productivity on routine jobs). The total effect is a decline in both tightness and wages for these workers.
TBTC increases productivity on abstract tasks (JC curve shifts upward, panel 3 of Figure 8). Despite a crowding out effect induced by wage bargaining (the WC curve shifts down-ward in panel 3 of Figure 8), the total effect is an increase in both tightness and wages for these workers.
This supply shock shifts AS downward in the good market (panel 4 of Figure 8), and for a given level of ability η, the profitability of routine task declines, leading the curve θr(η ) to rotate to the right (panel 5 of Figure 8).
This supply shock also generates additional incomes. Their allocations between goods and services drive the demand expansion. Given that the good market is also affected by the supply shock (which tends to lower good prices), the increase in the price of service is necessarily larger than the one observed in the good market (the green lines in panels (4) and (6) of Figure 8). Hence, the relative price of services goes up, and so does the marginal gain of each produced services.
The feedback effect on the labor market magnifies the initial impact of the supply shock. Indeed, the marginal return of services goes up: this leads to a shift upward (downward) of the JC (WC) curve in the labor market of manual tasks (the bold lines in panel (3) of Figure 8). Higher returns on service also lead more workers to move towards manual jobs (the horizontal line representing the value of θs shifts up in panel (5) of Figure 8).
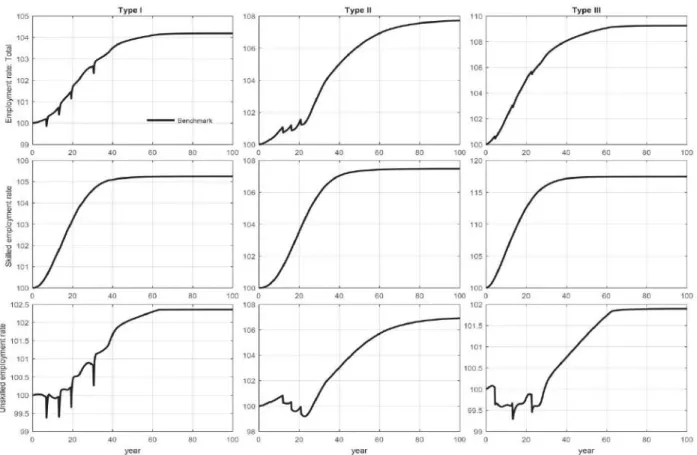
16 Figure 9: Employment rates (levels)
These adjustments show that job polarization is worth being analyzed in a matching model. The first value added of a matching model lies in its ability to provide employment levels that depend on the good and labor market institutions. Its second value added is to provide elasticities of these employment rates to exogenous changes (technology or policies), which depend on the level of the employment and hence on the good and labor market institutions. Finally, this model being dynamic, its third value added lies in its ability to account for persistence in the adjustment dynamics, and this labor market flexibility also depends on the institutions. Figure 9 accounts for these 3 dimensions: the initial level of the employment rate, its final level (the long term multiplier of the shocks) and the persistence of the adjustment. Type I economies begin with a high initial employment rate for skilled and unskilled workers. Hence, it is more difficult to improve this initial "good" situation. The adjustment of unskilled employment also suggests large and rapid reallocations, as employment losses are absorbed rapidly. In contrast, Type II economy has an initial low employment rate: the margins to improve this poor situation are large. Adjustment paths of unskilled dynamics shows that the creative process allowing to absorb the destructions of routine job takes time, leading to persistent adjustments. Type III economy is an intermediate case.
3.3.2 Why does time for labor reallocation matter?
Given that the employment state is always preferred to unemployment, occupational choices, (ie. to search for a "routine" or a "manual" job), are governed by unemployment values.5
5We study only situations where employment value is larger than unemployment value in "routine" or "manual"
17
These unemployment values depend on two main components: the expected gains (wages and benefits) and the time duration of an unemployment episode.
At the time of the technological change, workers, whether employed or unemployed, learn that their contemporaneous and future labor incomes will be modified. For some unemployed workers searching for a "routine" task, the unemployment duration can become infinite (firms stop opening vacancies on -type labor market segment). Thus, they decide to start searching for a manual job. At this time, the intensity of "computerization" of the production process is at its beginning. Thus, the increase in the demand for service, and thus the rise in the relative price of the service is moderate. This implies that the creation of new jobs in the service sector is also moderate: a labor market with "reasonable" unemployment duration disappears, workers move to a labor market where the unemployment duration is higher. The occupational switch still makes sense as the prospects of finding a job in the future improve. Hence, the search frictions allow us to account for transitional "technological unemployment", which is an unemployment "excess" generated by the instantaneous closure of opportunities in the labor market of routine jobs, replaced by opportunities lower than the ones before the shock. Moreover, when some unemployed workers decide to move towards manual jobs, the stock of unemployment worker is transitionally beyond its long-run value. Hence, non-employment is larger than its "natural" rate even if workers have instantaneously a higher probability to be hired than in their previous unemployment spells. This last point underlines the importance to develop a dynamic model to account for a reallocation process.
Given that the computerization process takes time, and that the re-organization of the production process extends the length of the transition, one can observe a decline in employment rates of unskilled workers, despite their occupational choices, leading them to search on markets where opportunities are better and improving (Figure 10).
Notice that these opportunities are better because the previous ones, on the labor market of routine tasks, disappear. Hence, this additional "technological unemployment" can be resorbed only after a meeting with a firm, and this search process can take time. These adjustment processes are quantitatively large because non-employment adjusts to its long-run level with some sluggishness.
18
Figure 10: Employment rates (base=100)
Figure 11 shows that the service labor market gradually absorbs new arrivals from the routine labor market. This search process is not the same across countries. In type I economies, Figure 11 shows that, when workers have no opportunities in the labor market of the routine jobs, they move towards the manual labor market: instantaneously, the non-employment in the manual labor market jumps, but rapidly, the high job finding rate allows worker to find a job. In contrast, in type II economies, after the same type of reallocation, given that the job finding rate is low, the persistence in non-employment is larger. Type III economies, with a finding rate lower than the one in type I economies but larger than the one for type II, constitute an intermediate case. 6
When we evaluate policy reforms, we will account for these differences between transitional costs across countries (short-term costs). Indeed, if the job polarization is accompanied by large movement of the workforce into unemployment, and if unemployment spells are long, then the social costs will be large even if this phenomenon is transitory. These social costs are measured by the rise in government expenditures along the transition path. We will also give a dynamic measure of the employment gains over time.
6 In type-II economy, TBTC leads to a decreasing in the non-employment rate in the long run, unlike what it is
predicted for the other types of economy. This "positive" effect of TBTC in the type-II economy is explained by the fact the TBCT leads the MW to become non-binding in the long run: the economy quits the trap of the MW equilibrium at the bottom of the wage distribution. Hence, in the long run, the marginal product of a job increases more rapidly than the labor cost. This result comes from the absence of an indexation of the MW on the technological progress, and hence its decreasing relatively to productivity.
19
Figure 11: Non-employment by task (base=100)
3.3.3 Why do labor market institutions matter?
Labor market institutions alter the labor allocation and its dynamic through wage-setting rules: the bargaining process as well as workers’ outside options can be country-specific. Moreover, a minimum wage can be a substitute for this bargained wage for low-paid workers. Beyond this main channel, labor market institutions can also have an impact on hiring and firing costs. The basic effect of the heterogeneity in LMI among countries is the gap between Type I economies and levels of employment rates in types II and III (Figure 9).
Beyond these large effects of the distortions on the levels of the labor market outcomes, we are interested in the interaction between the LMI and the diffusion of TBTC in the economy, and thus in the heterogeneity in elasticities of employment rates. From an analytical point of view, one can summarize the impact of TBTC in Autor & Dorn (2013) model by the key relationships governing the labor reallocation across sectors. Occupational choice is based on the comparison of wages in both sectors, each wage being equal to the labor productivity. In a model with labor market frictions, the occupational choices are based on the evaluation of the search returns in each market by a worker. Unlike Autor & Dorn (2013)’s static model, occupational choices are based on intertemporal values, which takes into account the contemporaneous gains, but also the value of future opportunities. These expected values are summarized in the tightness, deduced from firms’ free entry condition.7 In a model with labor market frictions, the impact of TBTC also depends on the wage setting rule. The interaction between labor demand (the hiring decision) and wage bargaining yields the equilibrium solution for labor market tightness θ, which then depends on the interaction between LMI and technological progress, which is specific to each labor market. More precisely, LMI alters real wage through the reservation wage (wr depends on replacement rate r and social assistance programs h), the Nash bargained surplus (wNash depends on the
20
bargaining power and search costs sc) and real wage rigidities (the minimum wage MW, the level of the social norms w and their weight in the wage ω).
Hence, the responsiveness of the occupational choice to TBTC is market-specific, through the wage setting rules and the dynamics of each sector. Hence, asymmetries across labor markets, in addition to the productivity gap, are necessary to find a value for that differs from the ones proposed by Autor & Dorn (2013). The search and matching framework makes employment an investment decision: time matters, and so does the capitalization of the profit flows. If these profit flows are decreasing with time, the firm’s incentive to open vacancies is reduced. This leads workers to quit the labor market of the routine jobs earlier than in a frictionless market. Even in this example where the chances to find a job are identical in the labor market segments at the "moving time", the job finding rate is lower than the one at which the worker has found her previous "routine" job: unemployment has then increased between these two episodes. Hence, our dynamic framework allows to account for "technological unemployment" which is the excess of unemployment linked to reallocations at times where the chance of finding a job in a new occupation is not yet very high, although it dominates that of finding in a declining demand for routine tasks.
Figure 12: Employment rate by task (base=100)
3.3.4 The wage-setting rule implications
In Figure 8, one of the main new elements is the shape of the WC. It allows to share labor market adjustments between wage and employment changes, as a supply curve of the labor supply. The elasticity of WC is thus central in the quantitative analysis. The steeper WC, the larger the adjustments of quantities. If quantities react rapidly, then unemployment duration is also highly elastic, so is the persistence of dynamic adjustments.
When discussing the wage response to TBTC, we need to look at the 2 dimensions of wage dynamics: i) households’ real labor earnings, net of income taxes and divided by the CPI,
21
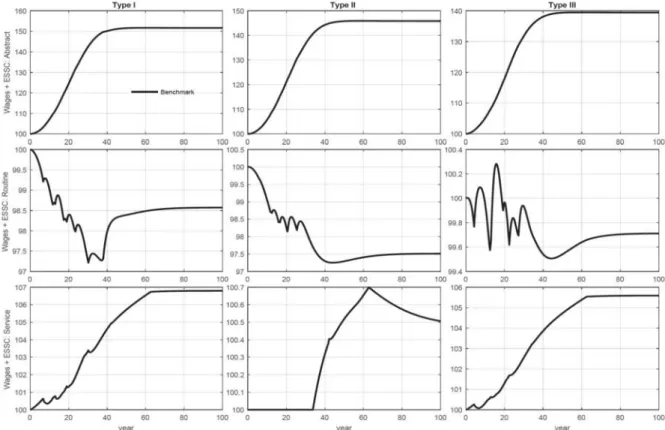
which is a primary indicator for policy makers interested in income distribution and ii) bargained wage including payroll taxes, which captures labor costs, whose dynamics determines labor demand decisions. In the discussion, the extent to which MW binds is crucial in countries of type II. The consumer price index is nearly stable over all the simulation paths because the increase of the price of services is compensated by the decline in the price of goods. Hence, in the benchmark scenario, the dynamics of the purchasing power of the workers is close to the one of labor cost, except for countries of type II with minimum wage. We then report in Figure 13 the dynamics of the real wage and, in Figure 19, Appendix C, the dynamics of labor costs. In the benchmark scenario, without change in payroll taxes, the main difference between the 2 sets of wage graphs lies on the binding MW for country II economies, in the service sector.
The main features that can be observed are that (i) average wages in routine jobs do not tend to fall in type III economies, (ii) the average wages on manual jobs increase in in type I and III economies, whereas it is constrained by the minimum wage in type II economies.
The wage sluggishness in type III economy8 imply that the quantities must largely decline in the market of the routine jobs in response to these relative losses of competitive-ness. In contrast, in type II economies, the decline in routine employment is less important, a large part of the adjustment being ensured by the wage (Figure 12 for the employment rates by task). In type II economies, routine jobs are maintained longer and their wages converge to the minimum wage: this generates a concentration of low-paid worker at the minimum wage level (Figure 19, Appendix C).
In the service sector, the absence of a MW allows types I and III economies to start with a higher employment rate for manual tasks. The wage moderation allows them to generate a higher growth in service employment. In type II economics, the growth in the service sector is ensured by the rise in the price of service with a constant unit cost, the minimum wage. As a minimum wage is more rigid than a wage that accounts for "social norms", the employment growth is slower because the number of vacancies is smaller (level effect of the MW) and also because the number of workers that choose to move is smaller than in countries of types I or III.
A reform of the wage setting rules then leads to change the speed at which the economy transforms the new opportunities generated by the technological progress into (employment and wage) gains. If, in the long run, this seems to be trivial, in the short run, labor market frictions and institutions can stall this reallocation process.
22
Figure 13: Real Wage dynamics (Base=100), households’ labor earnings
3.4 Introducing imperfect competition: consequences for job
polarization
Job polarization depends on intensity of the reallocation between "routine" and "manual" jobs: thus, it depends on the substitution between goods (produced by "routine" jobs) and services (produced by "manual" jobs) in the consumer’s basket and the production technology. In a perfectly competitive market, the price of service (that signals the direction of substitution) is only function of technology and preference parameters (Autor & Dorn (2013)’s result). In our analysis, this process can also be affected by the imperfect competition on the good and service markets.
In order to illustrate the importance of the endogenous markup on the product markets (goods and services), we assume that households become richer (the "wealth effect" induced by TBTC). The firm "Value", Vi, for i = g; n, provides the link, at the steady state, between the number of firms and the price induced by firm entry in the market: this relationship states that the entry cost must be equal to aggregate demand valued at its price, "shared" by the number of firms on the market. Hence, when consumer revenue increase the V schedule shifts down: at any given price and given the cost of entry, a larger number of firms can profitably operate in the market (Figure 14).9 On the other hand, the other relationship between the price and the number of firms is given by the price setting rule Pi, for i = g; s: the larger the number of firms, the lower the markup, and thus the price. If marginal costs increase, this relationship shifts upward (Figure 14, service market). The new equilibria are such that the number of firms is larger than before TBTC. Entries of new firms intensify the competition and then reduce the markup (in the left panel of Figure 14 prices decrease until they reach their long run values, which is given by the intersection of the "price setting" curve
9When the demand valued at its price increases, the expected capitalized gain of the firms rises and signals to
23
Pi, for i = g; s, with the curve representing the "Value" of the firm, Vi, for i = g; n). After the adjustments of the firm numbers, there is a multiplier effect: an increase in the aggregate demand is accompanied by a markup reduction, dampening the inflationary effect of the demand shock and leading to a production closer to its efficient level.
Figure 14: The dynamics of markups
This suggests that TBTC, by inducing a rise in aggregate demand, leads to a decline in the markup in all sectors: then, the impact of this "supply" shock is magnified by an increase in the competition on the product market. As a corollary, in countries with large entry costs, the amplification of TBTC by the rise in competition on the product market is less important, leading to slow job polarization. Lower entry costs would shift V curves downward, thereby triggering more entry.
Why are markup dynamics asymmetrical across sectors? The asymmetry comes from the opposite dynamics of marginal costs in each sector: for retailers in the goods sector, the cost of the transformation of a good into a final good does not change, whereas for service retailers, the unit cost in goods of the intermediate service increases, ie. its marginal cost increases (in Figure 14, the price setting curve is stable in the left panel that represents the dynamic of the market, whereas, on the right panel, the service market, this price setting curve shifts upward due to the rise in input price). Hence, for services, the increase in demand is accompanied by a relative increase in marginal costs: this dampens the decline in service prices and reduces the multiplier effect generated by a decrease in markup (Figure 14, panel "service market").10 If we focus on the relative price between goods and services, this suggests that job polarization can be slowed down through a larger improvement in competition in good market, allowing this sector to retain longer its workers occupied on
10In the AD/AS equilibrium depicted in panels (4) and (6) of Figure 8, the decreases in markups take the form of
additional shifts downward of the AS curves. On the good market, entries of new firms are not restrained by the rise in the marginal cost: the fall in markups (the increase in competition) is larger on good market than on service market. Hence, the magnitude of the shift of the AS curve is larger on the good market than in services.
24
routine tasks. We deduce from this analysis that product market regulation, targeted at service markets, can be considered as an efficient policy in order to accelerate job polarization and to reduce the costs of the transition.
Hence, beyond the technological and the preference parameters, it seems that the elasticity of markups matters in the job reallocation process, relative to an economy with perfect competition. Moreover, given that the entry of firms is a dynamic process, due to time varying entry costs, these adjustments in markups take time: in the short run, a demand expansion leads to higher price, but, in the medium run, entries of new firms reduce markups and thus reduce prices.
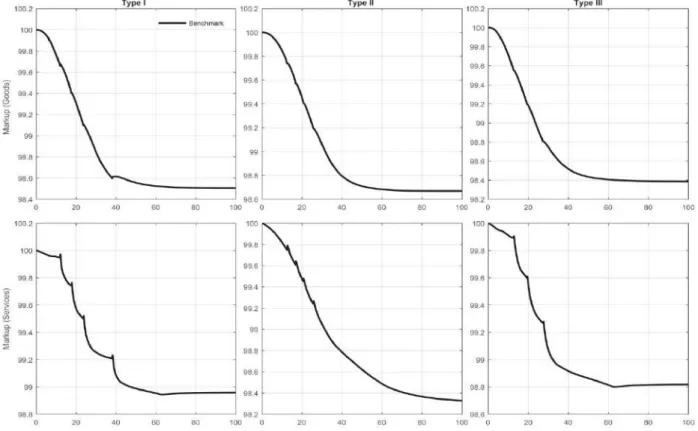
Figure 15 provides the quantitative measures of these phenomena. It appears that (i) markups decline in all markets (goods and services), (ii) they decline more in good market than in the service market, but the gaps of the variations between the two markets, in all countries, is small. Hence, even if these evolutions of the competition are not theoretically identical, from a quantitative point of view, they are very close. We conclude that the dominant effect is the one driven by the increase in demand, leading to more competition in each sector: the entries of firms magnify the wealth effect of TBTC and thus exacerbate job polarization. The gap of the response of the markup across sector is a second order phenomenon. Finally, even if the quantitative changes in markups are small, this does imply that the product market regulation cannot have a significant impact on the speed of the reallocation process.
Figure 15: The dynamic of the markups (Base=100)
3.5 Job polarization and inequalities
By nature, job polarization generates a rise in inequalities that our model can predict. A structural model is well suited to measure the implications on inequalities of each reform, beyond the dynamics of the aggregates.
25
We focus on inequalities in wages and incomes.11 In a previous study (Albertini, Hairault, Langot and Sopraseuth (2015)), focusing on the period 1970-2010, it has been shown that the "social model" in type III economies has two characteristics: it allows, during a structural change, to benefit from the technological progress in terms of employment, while containing the rise in wage inequalities. The main factor explaining this result comes from a wage moderation, particularly for high paid workers. From a theoretical point of view, these "social norms" that affect the wage bargaining process, fix a part of the contemporaneous wage to its historical value. This introduces real wage rigidities, and thus more adjustments are due to quantities. These dynamics dampen the rise in inequalities if the variation in the number of new jobs created at the top of the distribution is lower than the variation of individual gains for these workers. Our previous results show that even if the "social model" in countries of type III cannot stop the increase in the Gini index for wages, this country remains the most egalitarian.
A first set of new results can be deduced from the benchmark scenario of each country: how does technological progress, accompanied by an increase in the share of skilled workers, affect inequalities? These changes are evaluated in economies where labor market institutions and product market regulation are not modified during the adjustment path. Figure 16 shows that type I economies (type III economies) are characterized by the contemporaneous and the predicted highest (lowest) wage inequalities, type II economies being an intermediate case. With respect to the evolution of these predicted wage inequalities, the common feature for all countries is a large increase. Finally, in the types I and III economies, the Gini index of wages over-shoots its long run value: this comes from a rapid increase in wages at the top of the distribution (abstract tasks), whereas, at the bottom, new jobs are paid at low wage, the wage increase takes time.
Figure 16: Inequalities during the technological change
11Given that we have no financial asset, pension system,... in the model, the measure of the incomes that we
consider, include only the wages and unemployment benefits and other social programs, target on individuals between 15 and 65 years old.
26
4 Labor Market Reforms
4.1 Employment gains
In Table 2, we provide a synthetic view on LMI reforms12. In the first column, we display the policy under study. In the second column, we report the number of the Figures that display the results (see Appendix D for the predicted levels of the aggregates, the Appendix F for the employment shares and Appendix G for inequalities). In the other columns, we provide a measure of the aggregate employment gains in the long-run as well as changes in deficit as % of output (with respect to baseline) in the short-run and the long-run.
In view of the results reported in Table 2, we can establish a ranking of policy reforms according to their effectiveness.
Table 2 : LMI reforms
Type I Type II Type III Policy Figure ΔNlr ΔDsr ΔDlr ΔNlr ΔDsr ΔDlr ΔNlr ΔDsr ΔDlr A Lower ESSC (all) 26,33 0.1375 0.3946 0.2286 1.5710 1.2419 -0.1128 0.9924 0.8727 0.1551 B Lower ESSC (unskilled) 27, 28, 34, 41 0.1252 0.2537 0.0847 1.1485 0.7723 -0.2300 0.9318 0.5330 -0.1328 C lower RR 21, 22, 23, 24, 25, 35, 40 1.0372 -0.7469 -0.7842 3.7438 -2.0810 -3.7391 1.9179 -1.5013 -1.7267 D ALMP (all) 36 2.4920 1.4659 -0.0285 1.0887 0.3741 -0.4857 0.7843 0.4786 -0.1282 E ALMP (movers) 29, 30, 37, 42 0 0.1151 0 0.1229 -0.0021 -0.0716 0.3398 0.0980 -0.1115
ΔNlr = N (final steady state, with policy, level of employment rate) - N (final steady state, benchmark, level of employment rate): variation in
percentage points of the level of employment rate in the long run induced by the policy with respect to the case without policy. Figures from the table are percentage points while the Figures displayed in this report are percentages. As a result, the reader cannot directly infer the figures in this table from the graphs displayed in this report.
ΔDlr = D(final steady state, with policy, deficit as % of GDP) - D(final steady state, benchmark, deficit as % of GDP) : Long-run difference in deficit
induced by the policy, with respect to benchmark, as % of GDP
ΔDsr = short-run measure (1 quarter after the policy change)
Lower ESSC, (all): Lower Employer’s social security contribution, for all workers. Lower ESSC (unskilled): Lower Employer’s social security contribution, unskilled workers; lower RR : Lower Replacement Rate; ALMP (all) : Active Labor Market Policy (all workers); ALMP (movers) : ALMP for workers who switched occupation
The fall in unemployment benefit replacement ratio
– The fall in replacement ratio (lower RR, line C) seems to be the most effective policy in terms of employment gains and change in deficit with respect to baseline. Indeed, all countries experience employment gains for skilled and unskilled workers. The magnitude of the effect is larger for countries of Type II as these economies start with a lower employment rate than the other countries. The high labor costs of the Types II and III economies are then reduced by this reduction in workers’ reservation wage. The cost of this policy can be measured in terms of a rise in inequalities. An additional (trivial) dividend of the policy is to reduce government expenditures in the short run and in the long run. – For Type I economies, the employment impact of the reduction in
RR is low, compared with, e.g., an increase in ALMP (line D). This is because in Type I economies RR is already small, which limits the possibility to further lower it. Hence, in the Type I economy, the
12Policy packages have been explored in the draft of this manuscript. Quantitative predictions are not improved
27
reduction in unemployment benefits does not lead to large employment gains.
Lowering payroll taxes:
– Altering the labor costs by lowering payroll taxes for all workers yields employment gains (line A) but generates short-run deficits due to lower fiscal revenues13. In the long run, the short-run deficit can be absorbed or not depending on the employment gains. With low employment gains in types I and III economies, government budget does not improve in the long-run. In contrast, with large employment gains, the deficit in type II economies is reduced in the long run, with respect to baseline.
– Table 2, line B, suggests that, what actually matters is the labor cost for unskilled workers. The effect of the fall in the payroll tax mainly lies in the employment boost for manual workers, in the context of occupational labor reallocation towards service jobs. This result is true for Type II and III economies, where the generosity of unemployment benefits and social incomes are higher. Hence, this suggests that the generosity of Type II and III economies can be compensated in term of chance to be employed for an unskilled worker only if the labor cost is reduced. This is in accordance with the view that the reallocation can be achieved only if manual jobs, at the bottom of the wage distribution, are created.
ALMP
– Altering ALMP for all workers (through a fall in hiring costs, Table 2, line D) yields employment gains, with short term worsening of government deficit and little improvement in deficit with respect to baseline (because of the small long run employment gains). Table 2 might suggest that ALMP for all workers yields interesting results, especially for type I economies. However, recall that abstract workers also benefit from ALMP. The policy mechanically boosts employment in an already expanding segment of the labor market.
– We also explore the quantitative implications of targeting ALMP only for workers who switch occupations. This policy is less expensive and directed to the workers directly affected by TBTC. Table 2, line E, might suggest that this is not a good idea, if we only look at the aggregate employment levels. Even though it is clearly not the most effective policy, notice that, in the short-run, the policy makes more routine workers willing to switch occupations which tends to increase unemployment in the short-run but, as employment gains materialize, employment rate actually goes up in the long-run. Hence, this policy, which is by definition transitory, has a permanent impact: it is then an interesting tool. Remark that the impact of this transitory policy (its duration depend on the spell of the reallocation process) has also a permanent impact on the government budget, leading to a
28
surplus in the long-run in Type II and III countries (it generates short-run deficits, though).
4.2 Labor market reforms and inequalities
Labor market reforms aim at boosting employment, i.e. the opportunity to obtain a work and thus a wage. Hence, they increase the number of insiders. Does this entry of new workers lead to a rise in inequality between workers (wage inequalities)? Do these reforms reduce the gap between insiders and outsiders (income inequalities)? It could exist a trade-off : if it is easier to become a worker, but only at the top and the bottom of the wage distribution, this increase in the mobility can lead to more inequalities in wages. We analyze these questions using the predictions of the model. Some warnings are necessary: the Figures presented are forecasts. They are obtained by considering the past policies as given and above all stable. Thus the constancy observed in wage inequality in a Type II country, such as France, over the last decades cannot be reproduced here without a gradual and simultaneous rise in the tax exemptions on low wages and the increase in taxes on high earners, as this has been the case between 1990 and 2007.
4.2.1 Unemployment benefits
Wage inequality. The impact of the UB reduction on wage inequalities depends on the existence of MW. Without MW, for low paid workers, the reduction in UB significantly reduces wages, thereby raising inequalities (for high paid workers, the share of UB in the wage is less important). Wage inequalities then rise in type I and III. In countries of type II, insiders are protected from these wage cuts through the MW and thus the wage inequalities are not affected by the reform (Figure 40 in Appendix).
Income inequality. The costs for countries of type II from this neutrality on wage inequality, are the employment losses induced by the MW: given that the UB reduction does not change the labor costs at the bottom of the distribution in an economy with a MW, there is no employment gains induced by the reform in that part of the distribution, only unemployed workers who are less paid. Income inequalities increase in type II economies. This is not the
case in countries where UB reduction leads to more employment at the bottom of the distribution (types I and III).
4.2.2 Payroll tax subsidies
In this section, we focus on the payroll tax subsidies, targeted at low skilled workers. The main impact of this policy is to increase the "employment chances" at the bottom of the distribution. Hence, its impact on wage inequalities is negligible, in all countries, as this is shown in Figure 41 in Appendix. Concerning income inequality, this policy reduces them in all countries. This contrasts with the reduction in UB: even in countries of type II, we observe a reduction in inequalities induced by the reform. Indeed, unskilled workers enjoy higher "employment opportunities", and do not suffer from a fall in their income when they are unemployed.
4.2.3 Active labor market policy
The evaluation of an active labor market policy (Figure 42) is the one of a subsidy on hiring costs for workers who choose to move from the routine labor market towards manual tasks. So this is a policy targeted at a small fraction of the total population.