HAL Id: hal-01509861
https://hal.sorbonne-universite.fr/hal-01509861
Submitted on 18 Apr 2017HAL is a multi-disciplinary open access archive for the deposit and dissemination of sci-entific research documents, whether they are pub-lished or not. The documents may come from teaching and research institutions in France or abroad, or from public or private research centers.
L’archive ouverte pluridisciplinaire HAL, est destinée au dépôt et à la diffusion de documents scientifiques de niveau recherche, publiés ou non, émanant des établissements d’enseignement et de recherche français ou étrangers, des laboratoires publics ou privés.
High-resolution Infrared Spectroscopy and analysis of
the ν2 /ν4 bending dyad of Ruthenium Tetroxide
S. Reymond-Laruinaz, M. Faye, V. Boudon, D. Doizi, L. Manceron
To cite this version:
S. Reymond-Laruinaz, M. Faye, V. Boudon, D. Doizi, L. Manceron. High-resolution Infrared Spec-troscopy and analysis of the ν2 /ν4 bending dyad of Ruthenium Tetroxide. Journal of Molecular Spectroscopy, Elsevier, 2017, �10.1016/j.jms.2017.04.010�. �hal-01509861�
1
High-resolution Infrared Spectroscopy and analysis of the ν
2/ν
4bending dyad
of Ruthenium Tetroxide
S. Reymond-Laruinaz1 ; M. Faye2 ; V. Boudon3; D. Doizi1; L. Manceron2,4
1
Den-Service d’Etude du Comportement des Radionucléides (SECR), CEA, Université Paris-Saclay, F-91191, Gif-sur-Yvette, France,
2
Synchrotron SOLEIL, AILES Beamline, L’Orme des Merisiers, St-Aubin BP48, 91192 Cedex, France,
3
Laboratoire Interdisciplinaire Carnot de Bourgogne, UMR 6303 CNRS-Université Bourgogne Franche-Comté, 9 avenue Alain Savary, BP 47870, F-21078 Dijon Cedex, France,
4
MONARIS, UMR 8233, Université Pierre et Marie Curie, 4 Place Jussieu, case 49, F-75252 Paris Cedex 05, France.
Abstract
RuO4 is a heavy tetrahedral molecule of interest in several fields. Due to its chemical toxicity and
radiological impact of its 103 and 106 isotopologues, the possible remote sensing of this compound in the atmosphere has renewed interest in its spectroscopic properties. We investigate here, for the first time at high resolution, the bending modes region in the far infrared. High resolution FTIR spectra have been recorded near room temperature, using a specially designed cell and an isotopically pure sample of 102RuO4. New assignments and effective Hamiltonian parameter fits for
the main isotopologue (102RuO4) have been performed, treating the whole ν2/ν4 bending mode dyad.
We provide precise effective Hamiltonian parameters, including band centers and Coriolis interaction parameters.
Keywords
Ruthenium Tetroxide - High resolution FTIR spectroscopy – Simulation – Isotopic shift
1. Introduction
Ruthenium tetroxide (RuO4) is one of the few neutral tetroxide species. It is a heavy tetrahedral
molecule, but is relatively volatile with a notable vapor pressure at room temperature. It is also a powerful oxidant and can be used in oxidation reactions [1, 2]. RuO4 is quite reactive at room
temperature and decomposes readily to produce RuO2 films, which is used in the semiconductor
industry [3]. Ru is also a fission product of uranium and can be created, under its volatile form RuO4,
after an air inlet in the nuclear containment and can be used as a marker of air ingress in the reactor during a severe nuclear accident [4-6]. For this reason, the possible remote sensing of this compound in the atmosphere has gained technological importance and motivated recent spectroscopic studies [7]. Besides this interest motivated by nuclear reactor technology, detailed studies of RuO4 high
resolution FTIR absorption spectrum present an interest for quantum chemistry, as it would provide vibrational and structural parameters as benchmarks for the modeling of heavy element compounds [8-14].
For the low frequency bending modes, only low resolution vibrational studies of RuO4 in the vapor
(IR) or condensed (Raman) phases [15, 16] exist. These have, from band shape studies and force fields, approximately estimated band center positions, as well as rotational and Coriolis constants. These studies have been used ever since as benchmarks for ab initio calculations of vibrational properties [11-14].
2 Up to now, only the strongly IR-active, ν3 stretching fundamental has been investigated at
high-resolution (0.001 cm-1) and rotationally analyzed as an isolated band [7,17], with help of a 102Ru- sample. Analysis of the rotational structure was made possible by the fact that oxygen atoms have no nuclear spin, implying that only A1 and A2 rovibrational levels are allowed, which makes the
RuO4 spectrum rotationally resolvable as, here, most rotational lines are isolated. Natural abundance
ruthenium has seven isotopes: 104Ru (18.7%), 102Ru (31.6%), 101Ru (17.0%), 100Ru (12.6%), 99Ru (12.7%), 98Ru (1.88%), 97Ru (5.52%) and, thus, use of an enriched 102RuO4 sample is necessary. An
experimental high resolution study of RuO4 in the far infrared is a specially challenging task and
several difficulties must be overcome: the molecule is reactive and a special procedure must be used for the synthesis and handling of an isotopically enriched sample.
In this paper, we present new experimental results, using Synchrotron Radiation (SR) coupled to a high resolution FTIR spectrometer and a new long path cell made of inert materials to study the vibrational spectra of RuO4. High resolution (0.001 cm-1) spectra of the ν2/ν4 region of pure 102RuO4
have been recorded. Using the tensorial formalism and methods developed previously [18-21], spectra are analyzed in detail and compared to its heavier analogue, osmium tetroxide [22-24]. Assignments are performed up to high J rotational quantum number values. In Section 2 we present the experimental details of the FTIR spectra acquisitions. Section 3 recalls the basics of the theoretical model used for spherical-top molecules. We present the results of the analysis and discuss them in Section 4.
2. Experimental details and results
Sample preparation and handling. RuO4 and a monoisotopic 102RuO4 sample have been prepared
using the method of Ruff and Vidic [25], starting from Ru powder (Aldrich, 99.9%) or 102Ru (Eurisotop, 99.8% enrichment), oxidized first to perruthenate by permanganate using alkaline fusion and, next, partly reduced in acidic solution. To eliminate unwanted impurities (water, carbon dioxide, etc), a slight variant in the preparation involved flowing the product from the warmed solution with dry nitrogen gas for trapping and distillation of the product over dried and outgassed magnesium perchlorate-filled traps to remove water condensate. Carbon dioxide traces were eliminated by pumping over the product maintained in a cold bath around -35°C. All preparative glassware must be completely grease-free, with Teflon seals and stopcocks. The products were kept in sealed glass flasks over magnesium perchlorate outgassed at 200°C in high vacuum. The sample was handled using equipment and handling procedures as described in [7].
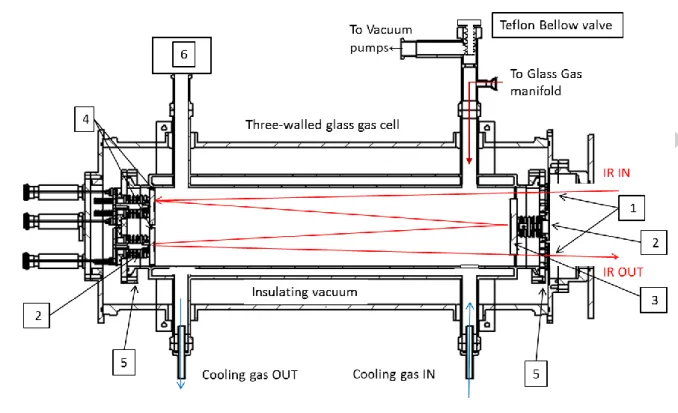
Because of the weakness of the IR absorption in the bending mode region, a new, long path cell was designed in a simple White-configuration. As RuO4 progressively decomposes in contact with metal
or oxidizable surfaces, a special gas cell was made of glass for the cell cylindrical body, Teflon bellows for mirror steering or PTFE-coated aluminum alloy for the flanges. The cell was fitted with wedged KRS5 windows mounted with Teflon-coated silicone or Kalrez gaskets (Eriks, France). A triple-envelope glass cell body has been manufactured (Verrerie Soufflée Normalisée, Paris, France) with an inner volume of about 14 liters (15 cm ID × 80 cm length) surrounded by an annular cylindrical space for circulating a cooling gas and a third envelope for keeping an insulating vacuum (Figure 1). The metal flanges supporting the windows, mirror mounts and viewports were covered with a thick PTFE coating (STIM, Cachan, France) and the mirrors were mounted on Teflon bellows (Elkinger, Germany) allowing for travel and tilt adjustments.
3
Figure 1. Schematic View cut of the glass and Teflon multi pass cell built for the experiment. 1- Wedged KRS5 windows. 2- Teflon Bellows. 3- Field mirror. 4- Objective Mirrors. 5- PTFE-coated flanges. 6- Passivated capacitance Pressure Gauge [7].
After various trials, it was found that gold coated-mirrors passivated with a thin, sub-micron homogeneous alumina layer (OPTIMASK, Morangis, France) could be used without catalyzing sample decomposition. The cell has an optical base length of 0.68m and a volume of about 14 liters. The optical path length can be varied between about 2.80 and 42 m. As in ref. 7, the cell and gas manifold were treated with a low pressure oxygen discharge and ozone to clean and passivate surfaces in contact with the gas. After four days in the cell, the product loss was about 30%.
The cell is coupled to the side compartment of the IFS 125HR (Bruker, Germany) of the AILES beamline, so that the insulating vacuum insulating the inner cell is that of the spectrometer. With two magnetic bearing turbopumps in operation, the residual vacuum (ca 5×10⁻⁵ mbar) was good enough for our purpose. The infrared beam was extracted from and redirected into the spectrometer sample compartment with an f/12 transfer optics, to match the f/10 cell mirror optical aperture without risk of vignetting the IR beam.
Spectroscopic measurements. The experiments were carried out on the AILES Beamline of
synchrotron Soleil, with the IFS 125 Bruker interferometer coupled to the SR source. Two spectra were recorded, one with 5.44 m and 0.2 mbar sample pressure and a second with 19.04 m path length and the same pressure for a better recording of the weaker lines. The resolution used was 0.00102 cm-1 (Bruker definition, Res = 0.9/MOPD, where MOPD = 882cm) with no apodization (“boxcar” software option), 5.06 cm/s scanner velocity, a Si/6µm Mylar beamsplitter and a liquid Helium-cooled Bolometer, using a 650 cm-1 low-pass filter. For each spectrum 296 and 240 interferograms, respectively, were averaged in a total recording time of about 27 hours and processed against a background of the empty cell taken at the same temperature at 0.1 cm-1 resolution. Another spectrum was recorded at 0.0025cm-1 resolution with natural RuO4, using the
Globar source of the spectrometer, 570 interferograms were averaged over about 30 hours measurement time, corresponding to two refills of the cell with a pressure of about 0.13 mbar.
4 Spectra were zero-filled, corrected for channelling effects and calibrated using well-known H2O and
CO2 rotational lines [27].
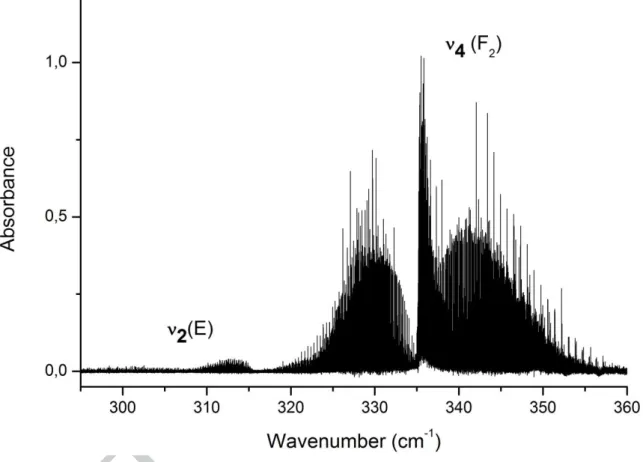
Experimental results. Figure 2 presents a survey of the whole bending region, recorded with a
moderate 0.2 × 544 mbar.cm pressure × optical path length product. Note that the product decays slowly during the experiment. After passivation, the half-life is more than 96 h.
Figure 2. Survey of the 300-360 cm-1 ν2/ν4 bending region of 102RuO4 for a sample pressure of about 0.20 mbar and a path
length of 5.44m, Residual water vapor lines have been subtracted out for clarity.
3. Theoretical model
RuO4, like other tetrahedral spherical top molecules (Td point group), possesses four normal modes of vibration: one non-degenerate mode with A1 symmetry (ν1), one doubly degenerate mode
with E symmetry (ν2), and two triply degenerate modes with F2 symmetry (ν3 and ν4).
Only F2 fundamentals are infrared active, in a first approximation, but the other modes can gain
some absorption intensity through couplings with the F2 modes. If the ν1 and ν3 stretching
fundamental wavenumbers are relatively far apart (885.0 and 921.0 cm−1, respectively, for 102RuO4,
see ref. 7), the ν2 and ν4 bending fundamental wavenumbers are much closer to each other and
both are located in the far infrared region (about 314 and 336 cm−1, respectively [16]). It is obvious from the spectrum that the ν2m o d e g a i n s s u b s t a n t i a l I R i n t e n s i t y f r o m t h e
n e i g h b o r i n g F2 mode, which is possible through Coriolis coupling. This leads to a vibrational dyad
structure that will be discussed later.
The theoretical model described below to develop the Hamiltonian operator is based on the tensorial formalism and vibrational extrapolation methods used in Dijon. These methods have already been
5 explained for example in Refs. [18, 19, 21]. Only the basic principles and their application to the case of a tetrahedral molecule are recalled here.
If we consider an XY4 molecule for which the vibrational levels are grouped into a series of polyads
designed by Pk (k =0,…,n ), P 0 being the ground state (GS), the Hamiltonian operator can be put in
the following form (after performing some contact transformations):
( 1 )
Terms like contain rovibrational operators which have no matrix element within the Pk ′ > k
basis sets. The effective Hamiltonian for polyad Pn is obtained by projecting H in the Pn Hilbert subspace, i.e. (2)
The different terms are written in the form
(3)
In this equation, the are the parameters to be determined, while and
are vibrational and rotational operators of respective degree Ω
v and Ω . Their construction
is described in Ref. [21]. Again, the vibrational operators only have matrix elements within the Pk ′ ≤ k basis sets. β is a factor that allows the scalar terms (Γ = A1) to match the usual terms like B0J2, etc.
The order of each individual term is Ω + Ωv− 2 .
Such a Hamiltonian development scheme enables the treatment of any polyad system. The ν2 and
the ν4harmonic wavenumbers being close to each other, as mentioned above, we a priori consider
that the two stretching fundamentals form a ν2/ ν4 dyad, just as for the OsO4 case [24]. Thus, we
build up the following effective Hamiltonians: •The ground state (polyad P0) effective Hamiltonian.
(4)
•The ν2/ ν4 bending dyad (P1 effective Hamiltonian) effective Hamiltonian.
(5)
A dipole moment operator for ν2/ ν4 is developed in the same way (see for instance [21] for details
about its construction). In the present work, it is expanded at the minimum order for this stretching dyad, giving only one parameter which is the dipole moment derivative of ν4 (see Section 4).
Here a vibrational basis restricted to the ν2 and ν4 modes is used:
(6)
i.e. a three dimensional harmonic oscillator wavefunction for the triply degenerate mode ν4 with
vibrational angular momentum l4 and a two dimensional one for the mode ν2 is used. The
Hamiltonian and dipole moment matrix elements are calculated in the coupled rovibrational basis: (7)
is a rotational wavefunction with angular momentum J, rotational symmetry species Cr and multiplicity index n (see Ref. [19]), while C is the overall symmetry species (C = Cv Cr).
6
4. Analysis
Due to the overlap of the different isotopologue spectra, it is not possible to reliably assign lines with a natural abundance spectrum. Thus, an isotopically pure sample of 102RuO4 was studied, allowing
much easier assignments. A preliminary simulation for 102RuO4 only was performed, using the XTDS
software [25], which implements the formalism described in the previous section, starting from first guess Hamiltonian parameters, adapted from ref 7 and 24, and estimating first the Coriolis constants from the well-known sum rule and relations [28]. In particular, from ref 7, the Coriolis constant 3
could be determined as 0.1943, thus, since 3+ 4≈ 0.5, 4=0.3057 was taken as a starting value and
thus a parameter value was assumed. In the following, the ground state effective Hamiltonian was expanded up to order zero only, since we have no precise spectroscopic ground state data. Unlike for OsO4, we found no experimental gas phase spectroscopic
determination of the bond length, but a recent X-Ray diffraction study of crystalline RuO4 exists [29].
The authors found two distinct crystalline phases, in which RuO4, although distorted from tetrahedral
symmetry, presents an average bond length of 1.697±0.004Å. The crystal structure has been obtained at low temperature (170K) and the bond distance should not be too different from that of the vibrational ground state. It has thus be used here as a starting point for the molecular equilibrium structure. The single ground state parameter used here, namely the B0 rotational
constant, was therefore fixed to 0.135794 cm-1, deduced from Ref. [29].
Due to the lack of references concerning intensities, we adapted manually an estimated value for the dipole moment parameter, in order to match roughly the experimental spectrum using the SPVIEW software [25].
Next, the ν4 band center value was varied stepwise, to match approximately the onset of the strong
Q branch in the 335.5 cm-1vicinity. The general shape (contour, relative intensities) of the dyad was very understandably strongly dependent upon the energy interval between effective band centers and the extent of the Coriolis interaction. Again, since 24= [ (1+2 3)]1/2 in a first approximation [28],
a starting value of -0.292144 was assumed for the parameter. As
will be seen later, the actual values for and depart only by -5 and +8 % from these starting guesses. For other parameters, the starting guesses were inspired by corresponding values in our 192OsO4 study [22-24], but vary more substantially.
Below 320 cm-1 the most prominent feature is the ν2 Q-branch, constituted by relatively evenly
spaced line clusters split by centrifugal effects. These clusters all correspond to relatively high J values (J≥20) as the coupling and thus intensity transfer originates from a rotational Coriolis effect. The assignment of the first observable line cluster is by no means obvious and, in a first step, the band center positions and magnitude of the coupling parameters were varied manually, until the relative intensities and Q branch positions reproduced approximately the observation. At this point, the simulated spectrum could reproduce well enough the positions of the low J values transitions in the P and R-branches of the ν 4 so that lines could be assigned at low J values and the rotational and
distortion constants, as well as band centers were fitted.
This led to better simulations and more lines could be assigned, with increasing J values. This procedure was repeated until no more lines could be assigned. The ν2/ν4 effective Hamiltonian was
finally expanded up to order 4 and 6, respectively. The results for the fitted effective Hamiltonian parameters are shown in Table 1. For ν2 6 parameters, for ν4 17 parameters and two interaction
parameters were necessary. Attempts at increasing the Hamiltonian parameter order did not converge to meaningful values for the additional parameters introduced in the model.
7
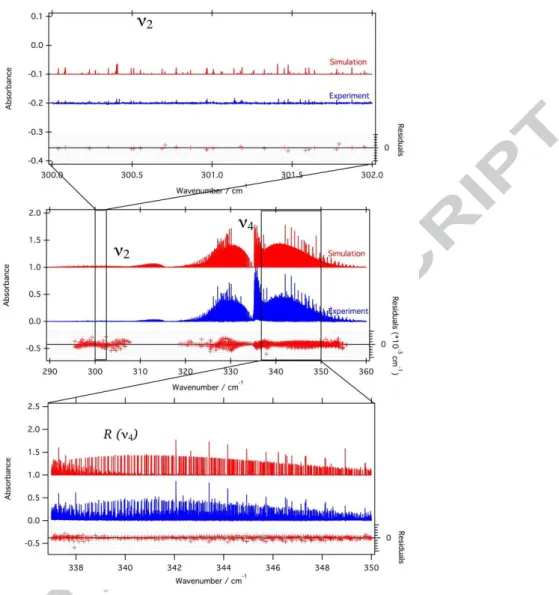
Figure 3: Top: Simulation of the ν2 stretching mode of 102RuO4, compared to the experiment. Middle: global view of the
bending dyad, compared to the experiment. Bottom: detail in the R branch of the ν4 region of 102RuO4.
Finally, the obtained root mean square deviation (dR M S) is 0.7 ×10⁻³ cm−1 for all 1037 assigned
transitions (Jmax = 88). Fig. 3 shows a global comparison and P- and R- branch details between the
simulation and the experimental spectrum of the 102RuO4, while Fig. 4 show details in the ν2a n d
ν4Q branches.
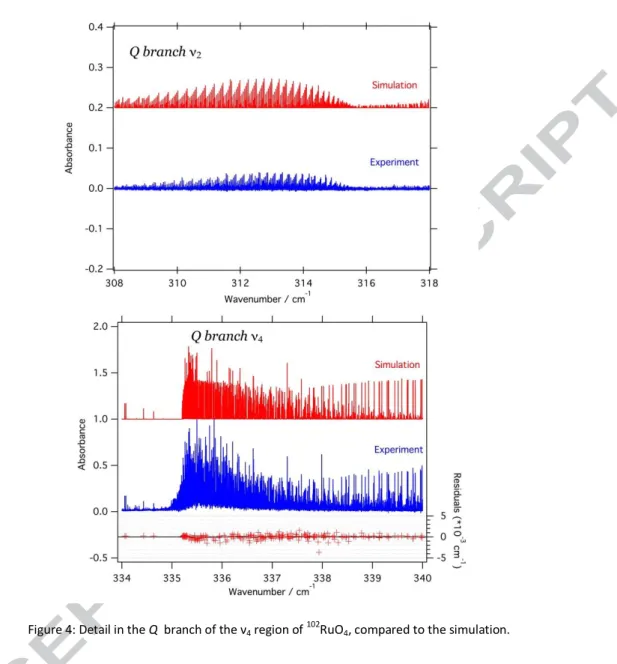
It should be noted that the rotational resonance affecting the dyad is not entirely described by the model. In particular, when a good fit is obtained on the ν4 R-, Q- and first part (J<26) of the
P-branches, as well as the P branch of the ν2 itself, the simulations of the ν2 Q-branch and the closest
part of the ν4 P branch presented as small offset, which could not be eliminated by adjusting any of
the parameters here. While the model is successful at reproducing the broad picture (figure 4, top), it is clear that further refinement would be needed to account entirely of the spectrum in all details. Our attempts at correcting this using any of the effective Hamiltonian parameters listed were not successful and here other ground state parameters remain undetermined. As the bending levels are the lowest vibrational levels above the ground state, the closest vibrational states are combinations or overtones of these at about twice their energies, thus any vibrational resonance seems very unlikely. Perhaps a more complete modeling should include the ν3level as well, as a Coriolis coupling
linking it with ν2can also exist. Given the large energy difference between ν2and ν3this was ignored
8
Figure 4: Detail in the Q branch of the ν4 region of 102RuO4, compared to the simulation.
Conclusions
We have performed the first detailed FTIR high resolution spectroscopic investigation of the 300-350 cm−1 bending region of 102RuO4, the major isotopologue of ruthenium tetroxide. The spectrum
was analyzed in detail. Our analysis covers the range of line assignments to high J values (88).
The effective Hamiltonian parameters determined in this work will allow generating reasonable simulation for all RuO4 isotopologues, including the radioactive isotopologues 103RuO4 and 106RuO4.
The parameters and simulations can be obtained thanks to the XTDS software [25]. It has been updated with the present results and can be downloaded from the Dijon spectroscopy group’s web page:
http://icb.u-bourgogne.fr/departement/omr/spectroscopie-moleculaire-processus-collisionnels-et-applications/
9 It is clear that this study leads to a more precise determination of the spectroscopic molecular parameters for the ν2 and ν4vibrational modes of RuO4 (Table 1). A complete line list with
attributions is available as supplementary material (S1). It is a first step on the way to a more precise structural parameters of this important benchmark molecule. This molecule poses also many challenging questions to ab initio quantum chemical calculations, as a recent study points out [14]. Among other properties, the predicted bond length varies substantially from one method to the next and is calculated always shorter. The predicted fundamental frequency ordering is also method-dependent [12 - 14]. The present study provides a very reliable estimate for the ν4fundamental band
center, but the ν2 is less precisely determined and might shift by some hundredths of wavenumbers
if all interactions were taken into account. Acknowledgements
This work has been funded by the project DECA-PF “Investments for the future” program through ANR-11-RSNR-0003 grant, supervised by the “Agence Nationale pour la Recherche” under the “Research in Nuclear Safety and Radioprotection (RSNR)” initiative. We wish to thank Karine Chaouchi and Stéphanie Blanchandin (Soleil Chemistry support group) for their contribution in the sample synthesis.
Bibliography
[1] J. Beattie, Ruthenium-catalyzed homogeneous oxidation processes, Pure and Applied Chemistry 62, p. 1145 (1990).
[2] K. Masutani, T. Uchida, R. Irie, T. Katsuki, Catalytic asymmetric and chemoselective aerobic oxidation: kinetic resolution of sec-alcohols, Tetrahedron Letters 41(26), 5119 (2000)
[3] J. Gatineau, K. Yanagita, C. Dussarrat, A new RuO4 solvent solution for pure ruthenium film
depositions, Microelectronic Engineering (2006).
[4] C. Mun, J. J. Ehrhardt, J. Lambert, C. Madic, XPS investigations of ruthenium deposited onto representative inner surfaces of nuclear reactor containment buildings, Applied Surface Science 253(18), 7613 (2007).
[5] P. Giordano, A. Auvinen, G. Brillant, J. Colombani, N. Davidovich, R. Dickson, T. Haste, T. Kärkelä, J.S. Lamy, C. Mun, D. Ohai, Y. Pontillon, M. Steinbrüci, N. Vér, Recent advances in understanding ruthenium behaviour under air-ingress conditions during a PWR severe accident, Progress in Nuclear Energy 52(1), 109 (2010).
[6] P. Chatelard, N. Reinke, S. Arndt, S. Belon, L. Cantrel, L. Carenini, K. Chevalier-Jabet, F. Cousin, J. Eckel, F. Jacq, C. Marchetto, C. Mun, L. Piar, ASTEC V2 severe accident integral code main features, current V2.0 modelling status, perspectives, Nuclear Engineering and Design 272, 119 (2014).
[7] S. Reymond-Laruinaz, V. Boudon, L. Manceron, L. Lago, D. Doizi, Infrared Spectroscopy of Ruthenium Tetroxide and High-resolution analysis of the ν3 band, Journal of Molecular Spectroscopy
315, 46 (2015).
[8) C.E. Düllmann, B. Eichler, R. Eichler, H. Gäggeler, A. Türkler , On the stability and volatility of group 8 tetroxides, MO4 (M= Ru, Os and Hs), The Journal of Physical Chemistry B 106, 6678 (2002).
10 [8] M. Filatov, D. Cremer, Calculation of electric properties using regular approximation to relativistic effects: the polarizabilities of RuO4, OsO4 and HsO4, The Journal of Chemical Physics 119, 1412
(2003).
[9] V. Pershina, T. Bastug, B. Fricke, Relativistic effects on the electronic structure and volatility of group 8 tetroxides MO4, where M=Ru, Os and Hs, The Journal of Chemical Physics 122, 124301
(2005).
[10] M. Filatov, D. Cremer, A gauge-independent zeroth order regular approximation to the exact relativistic Hamiltonian-formulation and applications, The Journal of Chemical Physics 122, 044104 (2005).
[11] H. Hameka, J. Jensen, J.G. Kay, C.M. Rosenthal, G.L. Zimmerman, Theoretical predictions of geometries and vibrational infrared spectra of ruthenium oxide molecules, Journal of Molecular Spectroscopy 150, 218 (1991).
[12] P. Carbonnière, I. Ciofini, C. Adamo, C. Pouchan, Vibrational behavior of tetrahedral d0 oxo-compounds: A theoretical study, Chemical Physics Letters 429, 52 (2006).
[13] L. Jose, M. Seth, T. Ziegler, Molecular and Vibrational Structure of Tetroxo d0 Metal Complexes in their Excited States. A Study Based on Time-Dependent Density Functional Calculations and Franck−Condon Theory, The Journal of Physical Chemistry A 116, 1864 (2012).
[14] F. Miradji, S. Souvi, L. Cantrel, F. Louis, V. Vallet, Thermodynamic Properties of Gaseous Ruthenium Species, Journal of Physical Chemistry A, 119 4961 (2015).
[15] I.W. Levin, Low-temperature Raman spectra of solid osmium tetroxide and ruthenium tetroxide, Inorganic Chemistry 8(4), 1018 (1969).
[16] R. S. McDowell , L. B. Asprey, L. Claron Hoskins, Vibrational Spectrum and Force Field of Ruthenium Tetroxide, The Journal of Chemical Physics 56(11), 5712 (1972).
[17] Marcel Snels, Maria Paola Sassi, Martin Quack, High-resolution Fourier-transform infrared spectroscopy of the ν3 (F2) fundamental of RuO4, Molecular physics 72(1), 145 (1991).
[18] J.P. Champion, M. Loëte, G. Pierre, Spherical top spectra, K.N. Rao, A. Weber (Eds.), Spectroscopy of the Earth's atmosphere and interstellar medium, Academic Press, San Diego, p. 339– 422 (1992).
[19] V. Boudon, J.P. Champion, T. Gabard, M. Loëte, F. Michelot, G. Pierre, et al., Symmetry-adapted tensorial formalism to model rovibrational and rovibronic spectra of molecules pertaining to various point groups, Journal of Molecular Spectroscopy 228, 620 (2004).
[20] A. Robiette, D. Gray, F. Birss, The effective vibration-rotation Hamiltonian for triply-degenerate fundamentals of tetrahedral XY4 molecules, Molecular Physics 32(6), 1591 (1976).
[21] C. Wenger, V. Boudon, M. Rotger, M. Sanzharov, J.P. Champion, XTDS and SPVIEW: graphical tools for the analysis and simulation of high-resolution molecular spectra, Journal of Molecular Spectroscopy 251(1–2), 102 (2008).
11 [22] M. Louviot, V. Boudon, L. Manceron, P. Roy, D. Balcon, High resolution spectroscopy and analysis of the ν1/ ν3 stretching dyad of osmium tetroxide, Journal of Quantitative Spectroscopy and Radiative
Transfer 113, 119 (2011).
[23] M. Louviot, V. Boudon, D. Bermejo, R. Martinez, L. Manceron, High resolution stimulated Raman spectroscopy and analysis of the ν1 band of osmium tetroxide. Journal of Raman Spectroscopy 43(11)
(2012).
[24] M. Louviot, V. Boudon, L. Manceron, P. Roy, D. Bermejo, R. Martinez, High resolution spectroscopy and structure of osmium tetroxide: a benchmark study on 192OsO4, Inorganic Chemistry
51, 10356 (2012).
[25] O. Ruff, E. Vidic, Wertigkeit des Rutheniums, Rutheniumtetroxyd und Ruthenium halogenid, Zeitschrift für Anorganische und Allgemeine Chemie 136, 49 (1924).
[26] A. B. Nikolskii, Saturated vapor pressure of ruthenium tetroxide, Russian Journal of Inorganic Chemistry 8, 541 (1963).
[27] L.S. Rothman, D. Jacquemart, A. Barbe, D.C. Benner, M. Birk, L.R. Brown, M.R. Carleer, C. Chackerian, K. Chance, L. Coudert, V. Dana, V. Malathy-Devi, J.M. Flaud, R.R. Gamache, A. Goldman, J.M. Hartmann, K.W. Jucks, A.G. Maki, J.Y. Mandin, S. Massie, J. Orphal, A. Perrin, C.P. Rinsland, M.A. Smith, R.A. Toth, J. Vander Auwera, P. Varanasi and G. Wagner, The HITRAN 2004 molecular spectroscopic database., Journal of Quantitative Spectroscopy and Radiative Transfer 96, 139 (2005).
[28] J.H.Meal, S.R.Polo The Journal of Chemical Physics 24,1119 (1956).
[29] M.Pley, M.S. Wickleder, Journal of Solid State Chemistry. 178, 3206 (2005). Two crystalline modifications of RuO4.
[30] J.K. Watson, Journal of Molecular Spectroscopy 39(2), 364 (1971). Quadratic Coriolis Zeta sum rules.
12 Table 1: Effective Hamiltonian Parameters for the ν2/ ν4 dyad of RuO4. Uncertainty is indicated in
parentheses, in the unit of the last two digits. Only fitted parameters are reported
Order Ω (K, nΓ) Parameters Values / cm
-1
(1 σ St. Dev.)
"Usual" notation
Band {s} {s'}
ν2 0 0(0,0A1) 0100E 0100E 315.82914(62) ν2
2 2(0,0A1) 0100E 0100E 2.440(38) X10 -4 B2-B0
2 2(2,0E ) 0100E 0100E 2.082(33) X10 -4 3 3(3,0A2) 0100E 0100E 3.1(1.2) X10 -8 4 4(0,0A1) 0100E 0100E 4.66(30) X10 -9 4 4(2,0E ) 0100E 0100E -7.03(15) X10 -9
ν4-ν2 1 1(1,0F1) 0100E 0001F2 -3.1843(53) X10 -1 ν4-ν2 interaction 2 2(2,0F2) 0100E 0001F2 -2.402(16) X10 -4 ν4 0 0(0,0A1) 0001F2 0001F2 335.28053(11) ν4 1 1(1,0F1) 0001F2 0001F2 1.67321(10) X10 -1 3√2Bζ3 (Coriolis ν4) 2 2(0,0A1) 0001F2 0001F2 -1.747(25) X10 -4 B4-B0 2 2(2,0E ) 0001F2 0001F2 3.239(37) X10 -4 2 2(2,0F2) 0001F2 0001F2 -2.516(27) X10 -4 3 3(1,0F1) 0001F2 0001F2 0(1.1) X10 -8 (3√3/4√2) F3110 3 3(3,0F1) 0001F2 0001F2 6.9(1.0) X10 -8 (3/√5/2) F3134 4 4(0,0A1) 0001F2 0001F2 -3.58(17) X10 -9 -(D4-D0) 4 4(2,0E ) 0001F2 0001F2 -1.7(1.4) X10-10 4 4(2,0F2) 0001F2 0001F2 -1.9(1.3) X10-10 4 4(4,0A1) 0001F2 0001F2 7.0(1.5) X10-11 4 4(4,0E ) 0001F2 0001F2 -3.067(51) X10 -9 4 4(4,0F2) 0001F2 0001F2 -1.050(61) X10 -9 5 5(1,0F1) 0001F2 0001F2 -7.42(45) X10-12 5 5(3,0F1) 0001F2 0001F2 5.23(49) X10-12 5 5(5,0F1) 0001F2 0001F2 4.01(21) X10-12 5 5(5,1F1) 0001F2 0001F2 -2.792(60) X10-11 6 6(0,0A1) 0001F2 0001F2 -1.48(85) X10-14